Python Data Mastery
A Hands-On Guide to Efficient Data Analysis for Engineers and Students
Embark on a transformative journey into the world of data analysis with Python Data Mastery.
284 pages14 chaptersSep 19, 2024PythonCreated by Charles
About this book
This comprehensive guide is tailored for students and professionals with an engineering background who are eager to harness the power of Python for data processing and analysis. From the fundamentals of Python to advanced techniques in pandas and NumPy, this book offers a structured approach to mastering data analysis. You'll learn how to clean and normalize data, automate repetitive tasks, and tackle large datasets with confidence. Each chapter builds upon the last, providing you with the skills and knowledge to contribute effectively to data projects. Whether you're looking to enhance your academic projects or boost your career prospects, Python Data Mastery equips you with the tools and techniques used by industry professionals. With hands-on examples and practical exercises, you'll gain the expertise to turn raw data into meaningful insights, setting you apart in the rapidly evolving field of data science.
Table of contents
- IntroductionWhy Python for Data Analysis?, Book Overview and How to Use It, Setting Up Your Python Environment, The Data Analysis LandscapeRead below
- Chapter 1: Python Basics for Data AnalysisPython Syntax and Data Types, Control Structures and Functions, File Handling in Python, Working with Modules and Packages
- Chapter 2: NumPy FundamentalsUnderstanding NumPy Arrays, Array Operations and Broadcasting, Indexing and Slicing in NumPy, Essential NumPy Functions, Practical Exercises with NumPy
- Chapter 3: Introduction to PandasSeries and DataFrames, Importing and Exporting Data, Basic DataFrame Operations, Data Selection and Indexing, Hands-on Pandas Exercises
- Chapter 4: Data Cleaning TechniquesHandling Missing Data, Removing Duplicates, Data Type Conversion, String Manipulation and Cleaning, Outlier Detection and Handling
- Chapter 5: Data Normalization and TransformationScaling Techniques, Normalization Methods, Encoding Categorical Variables, Feature Engineering Basics, Practical Normalization Exercises
- Chapter 6: Data Aggregation and GroupingGroupBy Operations, Aggregation Functions, Creating Pivot Tables, Advanced Grouping Techniques, Data Aggregation Exercises
- Chapter 7: Time Series Analysis with PandasWorking with Datetime Data, Resampling Time Series Data, Rolling Windows and Moving Averages, Time Series Plotting, Time Series Analysis Exercises
- Chapter 8: Data Visualization with Matplotlib and SeabornMatplotlib Basics, Introduction to Seaborn, Creating Statistical Plots, Customizing and Styling Plots, Interactive Visualizations
- Chapter 9: Advanced Pandas TechniquesMulti-indexing and Advanced Indexing, Merging and Joining DataFrames, Working with Categorical Data, Memory Optimization Techniques, Advanced Pandas Exercises
- Chapter 10: Handling Large DatasetsChunking Large Files, Introduction to Dask for Big Data, SQL Database Integration, Parallel Processing Techniques, Big Data Handling Exercises
- Chapter 11: Automating Data Analysis WorkflowsWriting Reusable Scripts, Command-line Tools for Data Analysis, Scheduling Data Analysis Tasks, Creating Data Processing Pipelines, Automation Project: End-to-End Workflow
- Chapter 12: Introduction to Machine Learning with Scikit-learnMachine Learning Fundamentals, Introduction to Scikit-learn, Data Preprocessing for Machine Learning, Training and Evaluating Models, Mini Machine Learning Project
- Chapter 13: Real-World Data Analysis ProjectsPlanning a Data Analysis Project, Data Collection and Preparation, Exploratory Data Analysis, Advanced Analysis Techniques, Presenting Results and Insights, Capstone Project: Full Data Analysis Workflow
- Chapter 14: Best Practices and Future TrendsCode Organization and Documentation, Version Control with Git, Ensuring Reproducibility in Data Analysis, Ethical Considerations in Data Analysis, Future Trends in Python Data Analysis
- Conclusion
- Appendix: Additional Resources
- Glossary
Introduction
Welcome to "Python Data Mastery: A Hands-On Guide to Efficient Data Analysis for Engineers and Students." This book is your gateway to the exciting world of data analysis using Python, designed specifically for students and professionals with an engineering background who are eager to expand their skills in this rapidly evolving field. As we embark on this journey together, you'll discover how Python, with its powerful libraries and intuitive syntax, has become an indispensable tool for data analysts, scientists, and engineers across various industries.
In today's data-driven world, the ability to efficiently process, analyze, and derive insights from large datasets is not just an advantage—it's a necessity. Whether you're working on academic projects, conducting research, or aiming to enhance your career prospects in the industry, mastering Python for data analysis will equip you with invaluable skills. This book is crafted to guide you through the fundamentals of Python programming for data analysis, introduce you to essential libraries like pandas and NumPy, and provide you with hands-on experience in tackling real-world data challenges.
Throughout this book, we'll focus on practical, actionable knowledge. Each chapter is designed to build upon the last, gradually increasing in complexity while ensuring that you gain a solid foundation in each concept before moving forward. By the end of this journey, you'll not only understand the theoretical aspects of data analysis but also have the practical skills to apply these concepts to your own projects and datasets.
As we progress, you'll learn how to clean and preprocess data, automate repetitive tasks, handle large datasets efficiently, and visualize your findings in compelling ways. We'll explore advanced techniques in pandas and NumPy, delve into time series analysis, and even touch upon the basics of machine learning with scikit-learn. Each topic is accompanied by real-world examples and exercises that will challenge you to apply your newfound knowledge in practical scenarios.
Remember, mastering data analysis is not just about learning syntax or memorizing functions—it's about developing a mindset that allows you to approach data problems creatively and efficiently. As you work through this book, you'll develop this analytical mindset, learning to ask the right questions of your data and use Python tools to find the answers.
Why Python for Data Analysis?
Python has emerged as the language of choice for data analysis across various fields, from scientific research to business intelligence. Its popularity in this domain is not without reason. Python offers a unique combination of simplicity, versatility, and power that makes it ideal for handling the complex tasks involved in data analysis. Let's explore why Python stands out as the go-to language for data professionals and why it's particularly well-suited for engineers and students venturing into the field of data analysis.
First and foremost, Python's syntax is clear and readable, making it an excellent language for beginners and experienced programmers alike. This readability is crucial in data analysis, where complex algorithms and data manipulations need to be understood not just by the original programmer but often by entire teams. Python's simplicity doesn't come at the cost of power; it's a fully-fledged programming language capable of handling everything from simple data cleaning tasks to complex machine learning models.
One of Python's greatest strengths is its vast ecosystem of libraries and tools specifically designed for data analysis. Libraries like NumPy provide efficient array operations, pandas offers powerful data structures for working with structured data, and matplotlib and seaborn enable the creation of publication-quality visualizations. These libraries are not just add-ons; they form the core of Python's data analysis capabilities, offering optimized performance for handling large datasets and complex computations[1].
For engineers and students with a background in other programming languages, Python offers a gentle learning curve while still providing the depth needed for advanced applications. Its object-oriented nature will feel familiar to those coming from languages like Java or C++, while its high-level functions and dynamic typing allow for rapid development and prototyping—essential in the iterative world of data analysis.
Python's versatility extends beyond just data analysis. It's widely used in web development, scientific computing, artificial intelligence, and more. This means that skills learned in the context of data analysis can be applied to a wide range of other domains, making Python a valuable language to master for career growth and versatility. Furthermore, Python's cross-platform compatibility ensures that code written on one operating system will run seamlessly on others, facilitating collaboration and deployment across different environments.
The open-source nature of Python and its data analysis ecosystem is another significant advantage. This not only makes it cost-effective for students and professionals but also means that the language and its libraries are constantly evolving and improving. The vibrant community around Python ensures that there's always support available, whether through extensive documentation, online forums, or continuous development of new tools and libraries.
For engineers specifically, Python's ability to integrate with other languages and systems is particularly valuable. It can easily interface with C/C++ code for performance-critical operations, work with databases through various connectors, and even integrate with tools like MATLAB or R when necessary. This flexibility allows engineers to leverage existing systems and code while taking advantage of Python's data analysis capabilities.
In the realm of big data and machine learning, Python has established itself as a frontrunner. Libraries like PySpark allow Python to work efficiently with big data processing frameworks like Apache Spark, while scikit-learn, TensorFlow, and PyTorch have made Python the language of choice for machine learning and artificial intelligence applications. This positions Python not just as a tool for current data analysis needs but as a gateway to the cutting-edge developments in data science and AI.
Lastly, Python's role in automation cannot be overstated. For data analysts and engineers dealing with repetitive tasks or complex workflows, Python offers powerful scripting capabilities. From automating data collection and cleaning processes to creating entire data pipelines, Python enables analysts to focus on interpretation and insight rather than getting bogged down in manual, time-consuming tasks.
In conclusion, Python's combination of simplicity, power, and extensive ecosystem makes it an ideal choice for data analysis, especially for those with an engineering background. Its ability to handle the entire data analysis workflow—from data collection and cleaning to advanced statistical analysis and machine learning—in a single, coherent environment sets it apart from other tools. As we progress through this book, you'll see firsthand how Python's features and libraries come together to create a robust and flexible platform for tackling real-world data challenges.
Book Overview and How to Use It
"Python Data Mastery" is designed to be your comprehensive guide to mastering data analysis with Python. This book is structured to take you from the basics of Python programming to advanced data analysis techniques, ensuring that you build a solid foundation while progressively tackling more complex concepts. Whether you're a student looking to enhance your academic projects or a professional aiming to apply data analysis in your work, this book is tailored to meet your needs. Let's take a closer look at how the book is organized and how you can make the most of it.
The book is divided into 14 chapters, each focusing on a specific aspect of data analysis with Python. We begin with an introduction to Python basics, ensuring that even those new to the language can quickly get up to speed. From there, we dive into the core libraries for data analysis: NumPy and pandas. These chapters form the backbone of your data analysis toolkit, covering everything from array operations to data manipulation and cleaning.
As we progress, you'll learn about data cleaning techniques, normalization, and transformation—essential skills for preparing your data for analysis. We then move on to more advanced topics such as data aggregation, time series analysis, and data visualization. These chapters will equip you with the skills to extract meaningful insights from your data and present them effectively.
The latter part of the book covers advanced pandas techniques, handling large datasets, and automating data analysis workflows. We also introduce you to machine learning with scikit-learn, providing a foundation for more advanced data science techniques. The book concludes with real-world projects and best practices, ensuring that you're not just learning theory but also how to apply your skills in practical scenarios.
To get the most out of this book, we recommend the following approach:
- Read sequentially: The chapters are designed to build upon each other, introducing concepts gradually.
- Practice actively: Each chapter includes hands-on exercises and code examples. Don't just read—code along!
- Experiment: Try modifying the provided code examples and apply the concepts to your own datasets or problems.
- Utilize resources: Take advantage of the additional resources provided in the appendix to deepen your understanding.
- Revisit and review: Data analysis is a skill that improves with practice. Don't hesitate to revisit chapters as you progress.
Each chapter is structured to include theoretical explanations, practical examples, and hands-on exercises. The theoretical sections provide you with the conceptual understanding necessary to grasp each topic. These are complemented by real-world examples that demonstrate how to apply these concepts in practice. The hands-on exercises at the end of each chapter are crucial for reinforcing your learning. They challenge you to apply what you've learned to solve realistic data analysis problems.
Throughout the book, you'll find callout boxes with tips, tricks, and important notes. These are designed to highlight key concepts, common pitfalls, and best practices. Pay special attention to these as they often contain insights gained from real-world experience in data analysis.
We've also included case studies and extended examples that span multiple concepts. These are particularly valuable as they show how different techniques can be combined to solve complex, real-world problems. They also provide context for when and why you might choose one approach over another.
As you progress through the book, you'll notice that we emphasize not just the "how" but also the "why" of data analysis. Understanding the reasoning behind different approaches is crucial for developing the analytical mindset needed to tackle novel problems in your future work.
Remember, data analysis is as much an art as it is a science. While this book provides you with the technical skills, developing intuition and creativity in approaching data problems comes with practice and experience. We encourage you to apply the concepts you learn to your own projects or datasets. This practical application will help solidify your understanding and give you valuable experience in dealing with the nuances and challenges of real-world data.
Finally, don't be discouraged if you find some concepts challenging at first. Data analysis is a vast field, and even experienced professionals are continually learning. The key is persistence and practice. As you work through the book, you'll find that concepts that seemed difficult at first become second nature, and you'll be able to tackle increasingly complex problems with confidence.
By the end of this book, you'll have a robust toolkit for data analysis with Python. You'll be able to import, clean, and analyze data efficiently, create insightful visualizations, and even build basic machine learning models. More importantly, you'll have developed the problem-solving skills and analytical mindset needed to approach any data analysis task with confidence.
Setting Up Your Python Environment
Before we dive into the exciting world of data analysis with Python, it's crucial to set up a proper development environment. A well-configured environment ensures that you can follow along with the examples in this book seamlessly and start working on your own projects without technical hurdles. In this section, we'll guide you through the process of setting up a Python environment tailored for data analysis, including installing Python, essential libraries, and choosing an Integrated Development Environment (IDE) or text editor.
First and foremost, let's install Python. While your system may come with a pre-installed version of Python, it's recommended to install the latest stable version to ensure compatibility with all the libraries we'll be using. We recommend using Python 3.8 or later for this book. You can download Python from the official website (python.org). During installation, make sure to check the option to add Python to your system PATH, which will allow you to run Python from the command line easily.
Once Python is installed, the next step is to set up a virtual environment. Virtual environments are isolated Python environments that allow you to install packages and manage dependencies for specific projects without affecting your system-wide Python installation. This is particularly useful when working on multiple projects with different requirements. To create a virtual environment, open your command prompt or terminal and run the following commands:
Replace 'myenv' with your preferred environment name. Once activated, your command prompt should show the name of your virtual environment, indicating that it's now active.python -m venv myenv source myenv/bin/activate # On Windows, use: myenv\Scripts\activate
With your virtual environment set up, it's time to install the essential libraries for data analysis. We'll be using pip, Python's package installer, to install these libraries. Run the following commands in your activated virtual environment:
This command installs NumPy for numerical computing, pandas for data manipulation, matplotlib and seaborn for data visualization, scikit-learn for machine learning, and Jupyter for interactive notebook environments.pip install numpy pandas matplotlib seaborn scikit-learn jupyter
Speaking of Jupyter notebooks, they are an excellent tool for data analysis, allowing you to combine code execution, rich text, and visualizations in a single document. To start a Jupyter notebook server, simply run:
This will open a new tab in your web browser where you can create and manage your notebooks.jupyter notebook
While Jupyter notebooks are great for exploratory data analysis and presenting results, you might prefer a full-fledged IDE for larger projects or more complex development tasks. Some popular IDEs and text editors for Python development include:
- PyCharm: A powerful IDE specifically designed for Python, with excellent support for data science libraries.
- Visual Studio Code: A lightweight but feature-rich editor with excellent Python support through extensions.
- Spyder: An IDE designed for scientific computing, included in the Anaconda distribution.
- Atom: A highly customizable text editor with good Python support through packages.
For version control, which is crucial for managing your code and collaborating with others, we recommend using Git. You can download and install Git from git-scm.com. Once installed, you can initialize a Git repository in your project folder with:
This allows you to track changes to your code, revert to previous versions if needed, and collaborate with others using platforms like GitHub or GitLab.git init
Lastly, it's worth mentioning the Anaconda distribution, which is popular among data scientists. Anaconda comes pre-packaged with Python and many of the libraries we'll be using, along with tools like Jupyter and Spyder. While it's not necessary for following this book, it can be a convenient option if you prefer an all-in-one solution.
Remember to keep your Python environment and libraries updated regularly. You can update individual packages using pip:
Or update all packages with:pip install --upgrade package_name
(Note: The second command is for Windows PowerShell. For Unix-based systems, use: pip freeze | cut -d'=' -f1 | xargs -n1 pip install -U)pip freeze | %{$_.split('==')[0]} | %{pip install --upgrade $_}
With your Python environment set up, you're now ready to embark on your data analysis journey. This setup provides you with a robust and flexible environment that will serve you well throughout this book and in your future data analysis projects. As you progress, you may find the need to install additional libraries or tools, but this base setup will cover the majority of your needs for the tasks and examples we'll be exploring.
The Data Analysis Landscape
As we embark on our journey into Python data analysis, it's crucial to understand the broader landscape of data analysis and where Python fits within it. Data analysis has become an integral part of decision-making processes across various industries, from business and finance to healthcare and scientific research. In this section, we'll explore the current state of data analysis, its importance in today's world, and how Python has emerged as a leading tool in this field.
Data analysis, in its essence, is the process of inspecting, cleansing, transforming, and modeling data to discover useful information, draw conclusions, and support decision-making. In today's digital age, where data is generated at an unprecedented rate, the ability to extract meaningful insights from this data has become more critical than ever. Organizations rely on data analysis to understand market trends, optimize operations, predict future outcomes, and gain a competitive edge.
The field of data analysis encompasses various disciplines and techniques, including:
- Descriptive Analytics: Summarizing and describing the main features of a dataset.
- Diagnostic Analytics: Examining data to understand why certain events occurred.
- Predictive Analytics: Using historical data to forecast future trends and behaviors.
- Prescriptive Analytics: Determining the best course of action based on data insights.
In recent years, we've seen a significant shift towards data-driven decision making across industries. This shift has been fueled by several factors:
- Big Data: The exponential growth in the volume, velocity, and variety of data available.
- Advancements in Computing Power: Increased processing capabilities allowing for more complex analyses.
- Artificial Intelligence and Machine Learning: The development of sophisticated algorithms capable of uncovering patterns in large datasets.
- Cloud Computing: Scalable infrastructure that enables processing of massive datasets.
Within this evolving landscape, Python has emerged as a frontrunner for several reasons. Its simplicity and readability make it accessible to beginners, while its powerful libraries and frameworks satisfy the needs of advanced users. Python's versatility allows it to be used across the entire data analysis workflow, from data collection and cleaning to advanced statistical modeling and machine learning.
Key Python libraries that have contributed to its dominance in data analysis include:
- NumPy: Provides support for large, multi-dimensional arrays and matrices, along with a collection of mathematical functions to operate on these arrays.
- Pandas: Offers data structures and operations for manipulating numerical tables and time series.
- Matplotlib and Seaborn: Enable the creation of a wide range of static, animated, and interactive visualizations.
- Scikit-learn: Provides simple and efficient tools for data mining and data analysis, particularly for machine learning.
- TensorFlow and PyTorch: Powerful libraries for deep learning and artificial intelligence.
The data analysis landscape is also characterized by the increasing importance of real-time analytics and streaming data. As businesses and organizations seek to make decisions based on the most up-to-date information, tools and techniques for processing and analyzing data in real-time have become crucial. Python's ability to integrate with big data technologies like Apache Spark (via PySpark) positions it well for these emerging needs.
Another significant trend in the data analysis landscape is the growing emphasis on data ethics and privacy. As data collection becomes more pervasive, concerns about data protection, bias in algorithms, and ethical use of data have come to the forefront. Python's open-source nature and transparent libraries align well with the need for explainable and auditable data analysis processes.
The field of data analysis is also seeing a convergence with other domains. For instance, the integration of data analysis with Internet of Things (IoT) devices is opening up new possibilities in fields like predictive maintenance and smart city planning. Similarly, the application of data analysis techniques in fields like genomics and climate science is leading to groundbreaking discoveries.
As we look to the future, several trends are likely to shape the data analysis landscape:
- Automated Machine Learning (AutoML): Tools that automate the process of selecting and optimizing machine learning models.
- Edge Computing: Performing data analysis closer to the source of data generation to reduce latency and bandwidth usage.
- Augmented Analytics: The use of machine learning and natural language processing to automate data preparation and insight discovery.
- Quantum Computing: The potential for quantum computers to solve complex data analysis problems at unprecedented speeds.
In conclusion, the data analysis landscape is dynamic and rapidly evolving, driven by technological advancements and the ever-increasing value of data-driven insights. Python, with its rich ecosystem of libraries and tools, stands at the forefront of this landscape, providing data analysts and scientists with the capabilities they need to tackle complex data challenges. As we progress through this book, you'll gain hands-on experience with many of the tools and techniques that are shaping the field of data analysis, preparing you to contribute effectively to this exciting and impactful domain.
Notes
Introduction
- 1. W. McKinney, Python for Data Analysis: Data Wrangling with Pandas, NumPy, and IPython, O'Reilly Media, 2017
This is the end of the free sample. The full book has 14 chapters.
Want this book written for you?
Tell us your goals and background, and get your own version of this book, tailored by AI to you.


Benefits of AI-tailored books
- Read one book, not ten:
- all the Python knowledge you need, gathered into a single book.
- Save days of learning:
- tell us your goals, choose your topics, and the whole book is built around them.
- Learn effortlessly:
- Python book written for your specific background and expertise.
- Understand at a glance:
- includes charts, tables, timelines, checklists, decision trees, and more.
- Stay current:
- written the day you order it, not years ago.
- Trust what you read:
- every book is checked for accuracy, with real research when your subject needs it.
Create your unique book in 3 steps
- 1. Select your focus
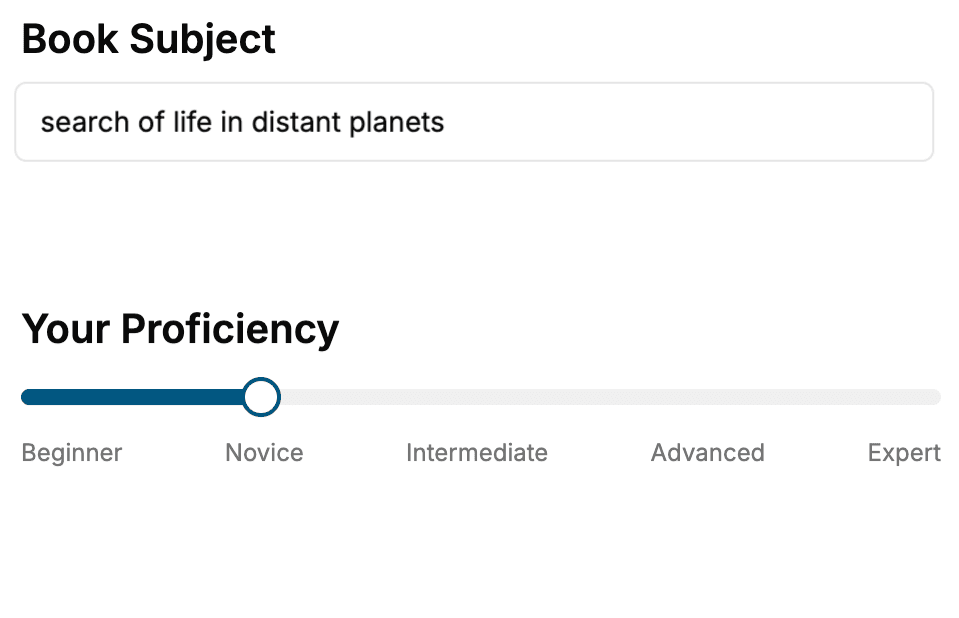
Select the focus of your Python book and share your background
- 2. Personalize your book
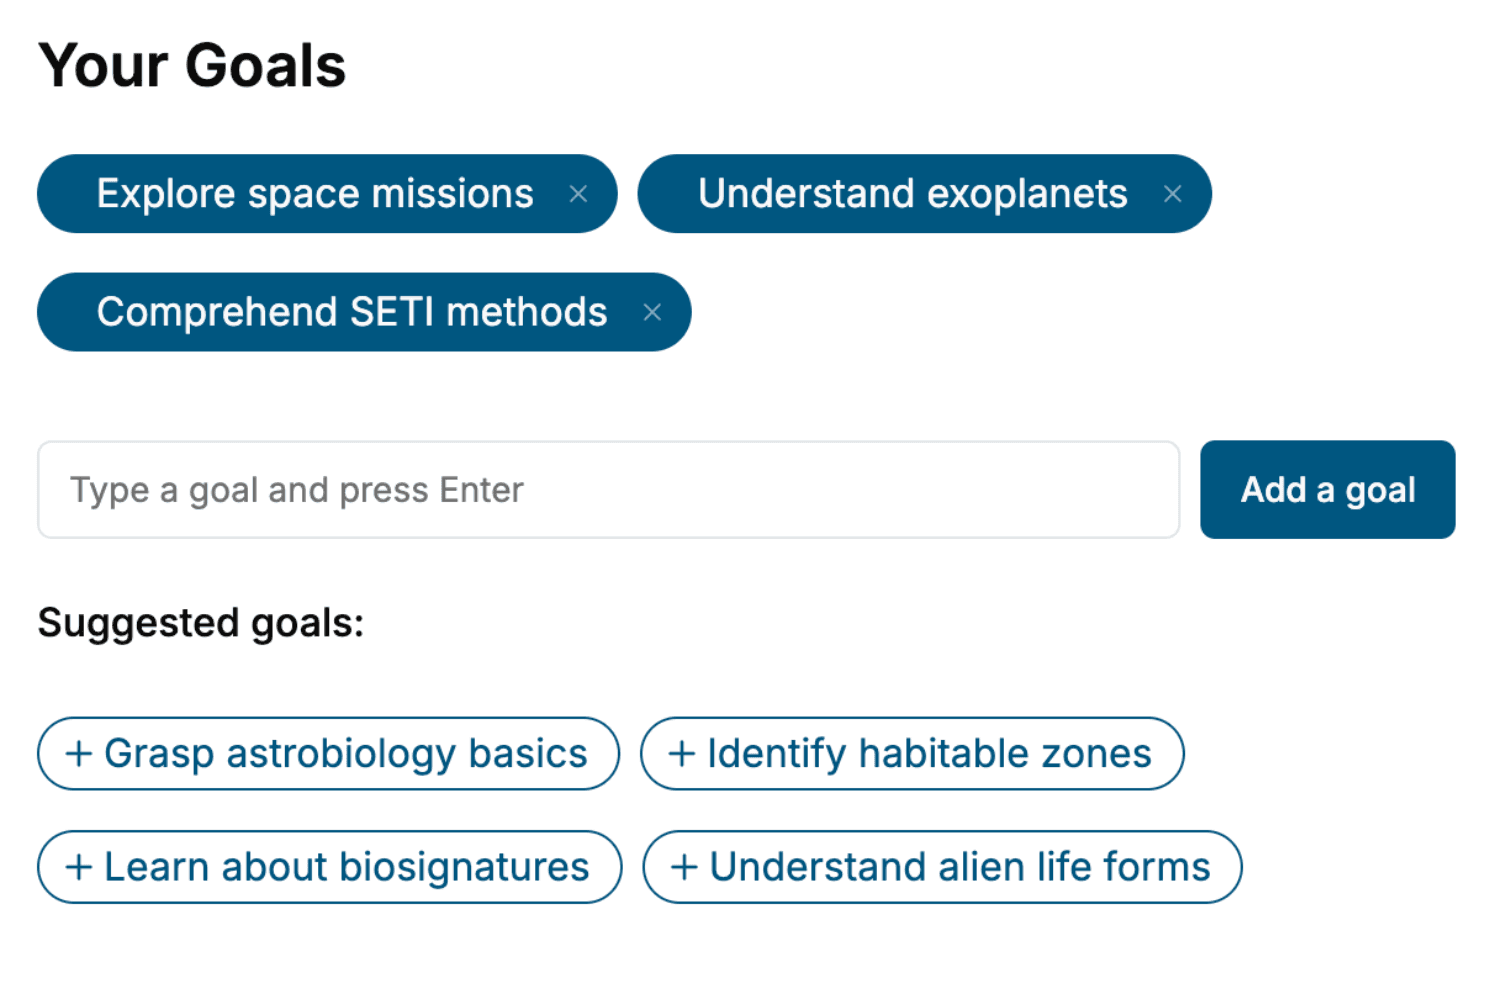
Specify your goals and choose sub-topics to include
- 3. Get your tailored book
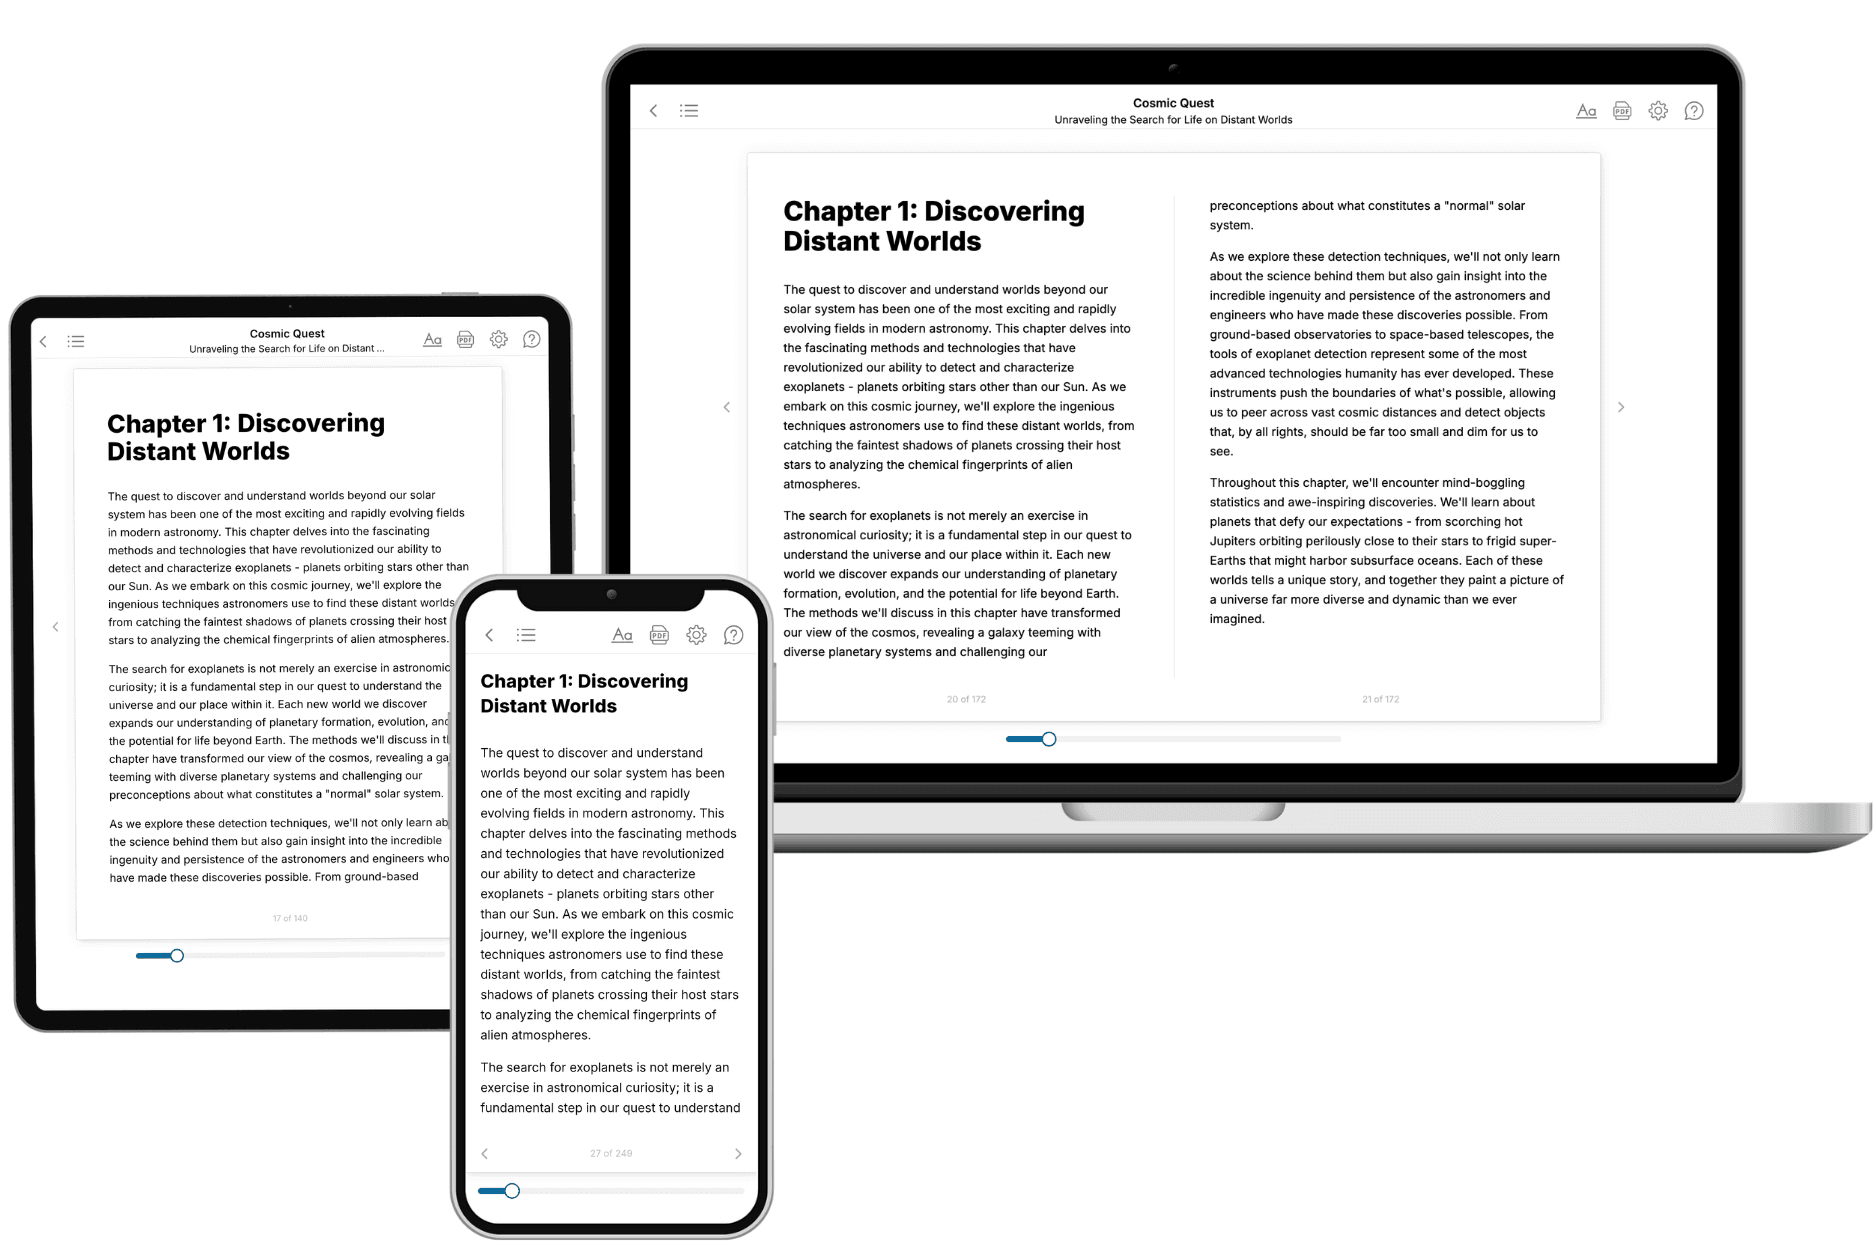
Your book is ready in 10 minutes. Read it online, download as EPUB or PDF, or send to Kindle.
Frequently asked questions
- What is TailoredRead?
TailoredRead creates complete, full-length nonfiction ebooks, written specifically for you. Tell us what you want to learn and why, and TailoredRead writes you a complete ebook on it, with charts, tables, and diagrams throughout. Read it online, on Kindle, or on any e-reader, or download it as a PDF or EPUB. Every book is written fresh the day you order it.
- How is the book tailored to me?
Before anything is written, you answer a few short questions about your goals, your background, and the topics you care about. Your book is then planned around your answers: written at your level, focused on your goals, and covering the topics you chose, instead of the one-size-fits-all book a store sells everyone.
- Will it read like generic AI content?
No. Your book isn't a chat transcript: it's planned chapter by chapter before a single word is written, told in a clear book voice, and explains ideas visually with charts, tables, and diagrams. After writing, every book goes through an editorial pass that polishes chapters so the book reads consistent from start to finish. Judge for yourself: browse thousands of sample books on our Explore Books page.
- How accurate is the content?
Our AI first checks whether your subject needs live research. Niche and fast-moving subjects are researched before writing, and the book plan and chapters are grounded in what it finds. After writing, every book goes through a quality pass that checks its facts and consistency, and researched books list their sources in a Notes section at the back.
- How long is the book?
You choose the length: Comprehensive (250-300 pages), Detailed (150-200 pages), Essential (70-100 pages), or Short (30-50 pages).
- Does the book include visuals?
Yes. Every book includes charts, tables, and diagrams: timelines, checklists, step-by-step guides, decision trees, comparison tables, matrices, and bar charts. A typical book includes dozens of these visual elements.
- Can I read it on Kindle? What formats can I download?
Yes. Every book can be read in our online reader or downloaded as a PDF or EPUB. The EPUB can be opened with Kindle, Apple Books, Kobo, and any e-reader. The Commercial and Author licenses also include an editable Word (DOCX) and Markdown download.
- How much does it cost?
About the price of a regular ebook. The exact price depends on your book's length and complexity, from $2 for the shortest books to $35 for the most comprehensive, and it's shown when you review your book, before you commit to anything. Each book is a one-time purchase, yours to keep, no subscription. Licenses that let you share, teach, or publish your book range from $35.99 to $49.99.
- Can I preview the book before purchasing?
Before you pay, you'll see what your book will cover: the title, a detailed description, the estimated length, and the complete chapter-by-chapter table of contents, so you know what you're getting before you decide. The full text itself is written after you purchase.
- How long does it take to create a book?
About 10 minutes. You can start reading the opening chapters while the rest is still being written.