The 30-Day Wealth Acceleration Blueprint
Proven Strategies to Optimize Your Portfolio, Maximize Cash Flow, and Accelerate Net Worth Growth in One Month
Most financial professionals believe that wealth growth requires years of patient investing and market timing luck.
253 pages12 chaptersNov 19, 2025Investment StrategyCreated by ardavan
About this book
The reality is far different. Within 30 days, you can systematically optimize your portfolio, eliminate hidden fees, recapture tax inefficiencies, and accelerate cash flow generation through proven tactical frameworks. This book reveals the specific mechanisms that separate high-performing portfolios from mediocre ones—and shows you exactly how to implement them. You'll discover how to leverage asset allocation precision, strategic rebalancing, tax-loss harvesting, and behavioral discipline to generate 2-4% additional risk-adjusted returns. Learn the exact sequencing of portfolio adjustments, cash flow optimization tactics, and risk management protocols that create measurable wealth acceleration. Whether you're managing client portfolios or your own wealth, this system provides the actionable playbook to achieve significant financial progress in just 30 days, with frameworks you can repeat quarterly for sustained momentum.
Table of contents
- Introduction: The 30-Day Wealth Acceleration OpportunityThe Hidden Wealth Gap: Why Most Portfolios Underperform, How the 30-Day System Works: Framework Overview, Your Implementation Roadmap: What to Expect, Quick Wins Available in Week OneRead below
- Chapter 1: Foundation: Wealth Velocity Metrics and Baseline AssessmentUnderstanding Wealth Velocity: The Speed of Your Money, Conducting Your 30-Day Baseline Audit, Benchmark Outperformance Analysis: Where You Stand
- Chapter 2: Asset Allocation Precision: Optimizing Your FrameworkThe Asset Allocation Framework: Core Principles, Correlation Analysis Methods: Building Resilient Portfolios, Identifying and Reducing Equity Concentration Risk, Portfolio Rebalancing Tactics: Threshold-Based Approach
- Chapter 3: Risk Management Mastery: Stress Testing and Volatility ControlPortfolio Stress Testing: Scenario Analysis Framework, Volatility Forecasting Models: Anticipating Market Moves, Systematic Risk Measurement and Mitigation, Drawdown Recovery Tactics: Protecting Downside
- Chapter 4: Tax Efficiency Acceleration: Capturing Hidden ReturnsTax-Loss Harvesting Techniques: Systematic Implementation, Capital Gains Tax Planning: Strategic Timing, Inflation-Adjusted Returns and Tax-Adjusted Performance, Withdrawal Rate Planning: Tax-Efficient Distribution
- Chapter 5: Cash Flow Optimization: Generating Immediate MomentumCash Flow Generation Methods: Multiple Income Streams, Expense Ratio Minimization: Fee Impact Quantification, Savings Rate Optimization: Accelerating Accumulation, Debt Paydown Acceleration: Strategic Sequencing
- Chapter 6: Dividend and Income Maximization: Passive Income StreamsDividend Reinvestment Strategy: Compounding Acceleration, Yield Enhancement Strategies: Maximizing Income, Income Stream Diversification: Building Resilience, Passive Income Maximization: Systematic Approaches
- Chapter 7: Market Timing Enhancement: Tactical PositioningMarket Cycle Positioning: Understanding Phases, Momentum Investing Signals: Identifying Opportunities, Sector Rotation Tactics: Tactical Allocation Shifts, Valuation Metric Analysis: Identifying Mispricings
- Chapter 8: Portfolio Diversification Strengthening: Building ResilienceDiversification Strengthening Framework: Beyond Traditional Allocation, Alternative Investment Integration: Expanding Opportunities, Bond Ladder Construction: Fixed Income Optimization, Liquidity Management Strategies: Balancing Flexibility
- Chapter 9: Risk-Adjusted Return Optimization: Maximizing EfficiencyRisk-Adjusted Return Optimization: Sharpe Ratio Enhancement, Opportunity Cost Evaluation: Making Strategic Choices, Micro-Cap Growth Potential: Capturing Emerging Opportunities, Compounding Acceleration Methods: Exponential Growth
- Chapter 10: Behavioral Finance and Decision-Making: Overcoming Cognitive BiasesBehavioral Finance Pitfalls: Recognizing Cognitive Biases, Systematic Processes: Eliminating Emotional Decisions, Dollar-Cost Averaging: Disciplined Investment Approach, Investment Discipline: Building Consistent Habits
- Chapter 11: The 30-Day Action Plan: Week-by-Week ImplementationWeek One: Assessment and Quick Wins, Week Two: Optimization and Rebalancing, Week Three: Tax Efficiency and Income Maximization, Week Four: Monitoring, Adjustment, and Sustainability
- Chapter 12: Wealth Milestone Planning and Net Worth TrackingWealth Milestone Planning: Setting Meaningful Targets, Net Worth Growth Tracking: Measurement Systems, Financial Goal Setting and Alignment, Progress Monitoring: Quarterly Review Protocols
- Conclusion: Sustaining Your Wealth AccelerationMaintaining Momentum: Beyond the 30 Days, Continuous Improvement: Iterating Your System
- Glossary of Key Terms
- Further Reading and Resources
Introduction: The 30-Day Wealth Acceleration Opportunity
Most financial advisors operate under a persistent myth: that meaningful portfolio optimization requires months or years of careful analysis, market timing, and gradual adjustments. This belief costs professionals and their clients thousands—sometimes millions—of dollars in unrealized returns. The reality is starkly different. Within thirty days, you can systematically identify and eliminate the inefficiencies that suppress portfolio performance, recapture hidden value through tax optimization, and implement tactical adjustments that generate measurable wealth acceleration. This isn't about chasing market trends or making speculative bets. It's about applying rigorous, data-driven frameworks that expose the 15-25% of potential returns most portfolios leave on the table through suboptimal rebalancing, inefficient tax strategies, and delayed tactical implementation.
Your PhD credentials and professional experience have equipped you with sophisticated theoretical knowledge, but implementation gaps often separate understanding from execution. You recognize that asset allocation theory, modern portfolio theory, and efficient market hypothesis provide foundational frameworks—yet translating these concepts into tactical, time-bound actions that generate immediate results remains challenging. This book bridges that gap. It provides the specific sequencing, measurement protocols, and decision frameworks that transform theoretical knowledge into measurable wealth acceleration. You'll discover how to conduct rapid portfolio audits, identify concentration risks, optimize rebalancing thresholds, and implement tax-loss harvesting strategies that collectively generate 2-4% additional risk-adjusted returns without increasing portfolio volatility or market exposure.
The thirty-day timeframe isn't arbitrary. Research demonstrates that focused implementation periods create accountability, reduce decision fatigue, and generate momentum that sustains long-term behavioral change. By concentrating optimization efforts into a structured month-long sprint, you eliminate the procrastination and analysis paralysis that typically delay portfolio improvements. Each week builds systematically on the previous one, creating a cascading series of improvements that compound over time. Week one focuses on assessment and quick wins—the low-hanging fruit that generates immediate results. Week two tackles optimization and rebalancing. Week three addresses tax efficiency and income maximization. Week four establishes monitoring systems and sustainability protocols. This structured approach ensures you make measurable progress while building repeatable processes you can apply quarterly to maintain momentum.
This introduction establishes the foundation for your thirty-day wealth acceleration journey. You'll understand why most portfolios systematically underperform, how the acceleration framework operates, what specific outcomes you can expect, and which quick wins you can capture in the first seven days. By the end of this chapter, you'll have a clear roadmap for implementation and the confidence that comes from understanding exactly how each component contributes to measurable wealth growth. The strategies you'll learn aren't theoretical concepts—they're battle-tested frameworks used by top-performing advisors to consistently outperform benchmarks and accelerate client wealth accumulation. Now it's time to apply them to your own portfolio and client relationships.
The Hidden Wealth Gap: Why Most Portfolios Underperform
The performance gap between average portfolios and optimized portfolios isn't primarily caused by poor asset selection or bad market timing. Instead, it stems from systematic inefficiencies that accumulate over time, creating a hidden tax on returns that most advisors never quantify. Research from Vanguard's Advisor's Alpha framework suggests that comprehensive wealth management practices can add approximately 3% in net returns annually compared to self-directed investing or basic advisory services[1]. However, even among professional advisors, significant variation exists in implementation quality. The difference between mediocre and excellent execution of the same strategies can represent 1.5-2.5% in annual performance—a gap that compounds to hundreds of thousands or millions of dollars over a career.
Consider the specific mechanisms that create this wealth gap. First, suboptimal rebalancing frequency allows portfolio drift to increase risk exposure beyond target allocations or miss opportunities to capture gains. Many advisors rebalance annually or semi-annually, but research indicates that threshold-based rebalancing—triggering adjustments when allocations drift beyond specific percentage bands—can improve risk-adjusted returns by 0.4-0.8% annually. Second, inefficient tax management erodes after-tax returns through poorly timed capital gains realizations, missed tax-loss harvesting opportunities, and suboptimal asset location across taxable and tax-advantaged accounts. Tax-loss harvesting alone can add 0.5-1.2% in annual after-tax returns for high-net-worth clients in taxable accounts. Third, excessive fees and expense ratios create a permanent drag on performance that compounds negatively over time. Reducing total portfolio costs from 1.2% to 0.4% annually generates an additional 0.8% in returns—every single year.
Beyond these quantifiable factors, behavioral inefficiencies create additional performance drag. Recency bias causes advisors and clients to overweight recent market performance when making allocation decisions, leading to pro-cyclical positioning that buys high and sells low. Loss aversion triggers premature selling during market corrections, locking in losses and missing subsequent recoveries. Anchoring to purchase prices or historical highs prevents rational evaluation of current valuations and future prospects. These cognitive biases aren't character flaws—they're hardwired neurological responses that affect even sophisticated professionals. The solution isn't trying to eliminate these biases through willpower; it's implementing systematic processes that override emotional decision-making through rules-based frameworks and predetermined action triggers.
The wealth gap also emerges from opportunity costs—the returns you don't capture because capital remains deployed in suboptimal positions. When a portfolio holds underperforming assets due to inertia, tax concerns, or emotional attachment, it sacrifices the returns those dollars could generate in better-positioned investments. A 10% portfolio allocation earning 3% annually when it could earn 8% in a more appropriate position costs 0.5% in total portfolio returns. Multiply this across multiple positions and years, and the cumulative opportunity cost becomes substantial. Identifying and addressing these opportunity costs within thirty days can immediately improve portfolio efficiency without requiring additional capital or increased risk exposure.
Cash drag represents another hidden source of underperformance. Many portfolios maintain excessive cash positions—often 5-10% or more—that earn minimal returns while waiting for "the right opportunity" or serving as an emotional security blanket. While maintaining appropriate liquidity reserves is prudent, excess cash beyond 2-3% for rebalancing and near-term needs creates unnecessary performance drag. In a market returning 8% annually, a 7% cash position earning 0.5% costs approximately 0.5% in total portfolio returns. Strategic cash management that maintains adequate liquidity while minimizing excess holdings can recapture this lost performance.
Finally, inadequate diversification or false diversification creates concentration risks that increase volatility without improving returns. Many portfolios appear diversified across multiple holdings but exhibit high correlation during market stress, providing less downside protection than expected. Other portfolios maintain concentrated positions in employer stock, regional equities, or specific sectors that create idiosyncratic risks uncompensated by additional returns. Proper correlation analysis and diversification strengthening can reduce portfolio volatility by 15-30% without sacrificing expected returns, improving risk-adjusted performance and enabling more consistent wealth accumulation.
Understanding these specific mechanisms is crucial because it transforms portfolio optimization from a vague aspiration into a concrete action plan. You're not trying to "do better" in some undefined way—you're systematically addressing quantifiable inefficiencies with proven solutions. The thirty-day framework provides the structure to identify which of these gaps exist in your portfolio, prioritize interventions based on potential impact, and implement solutions in a logical sequence that generates measurable results. This diagnostic clarity is what separates effective optimization from random activity that consumes time without producing proportional value.
How the 30-Day System Works: Framework Overview
The thirty-day wealth acceleration system operates on three core principles: systematic assessment, prioritized implementation, and measurable tracking. Unlike open-ended improvement initiatives that lack clear endpoints or success criteria, this framework establishes specific milestones, quantifiable metrics, and time-bound deliverables that create accountability and momentum. The system recognizes that you're a busy professional managing multiple client relationships and complex portfolios—you need efficient processes that generate maximum impact with minimum time investment. Each component is designed to be completed within defined time windows, typically 2-4 hours per week, making the system sustainable alongside your existing responsibilities.
The framework begins with baseline assessment—establishing your current position across key performance dimensions. This isn't a comprehensive financial plan review; it's a focused audit targeting specific optimization opportunities. You'll calculate your current wealth velocity metrics, benchmark your portfolio against appropriate indices, identify concentration risks, quantify tax inefficiencies, and measure cash flow characteristics. This assessment typically requires 3-4 hours but provides the diagnostic foundation for all subsequent actions. Without accurate baseline measurements, you can't determine which interventions will generate the highest returns or track whether your optimization efforts are producing intended results. The assessment phase answers three critical questions: Where are you now? Where are the biggest gaps? Which improvements will generate the highest impact?
Following assessment, the system moves into tactical implementation across four parallel tracks:
- Portfolio optimization: Rebalancing to target allocations, reducing concentration risks, improving diversification quality, and adjusting tactical positions based on market cycle analysis
- Tax efficiency enhancement: Implementing tax-loss harvesting, optimizing asset location, planning capital gains realizations, and structuring withdrawals for tax efficiency
- Cash flow acceleration: Minimizing expense ratios, optimizing debt paydown sequencing, enhancing savings rates, and diversifying income streams
- Risk management strengthening: Conducting stress tests, forecasting volatility, measuring systematic risk exposure, and implementing downside protection strategies
The system employs threshold-based decision rules that eliminate subjective judgment and emotional interference. Rather than deciding whether to rebalance based on market sentiment or intuition, you'll establish predetermined triggers—for example, rebalancing when any asset class drifts more than 5% from target allocation. Rather than evaluating tax-loss harvesting opportunities sporadically, you'll implement systematic screening protocols that identify candidates whenever positions decline more than 10% from cost basis. These rules-based approaches ensure consistent execution regardless of market conditions or emotional state, which is crucial for maintaining discipline during volatile periods when behavioral biases are strongest.
A critical component of the framework is layered implementation—sequencing actions to capture quick wins early while building toward more complex optimizations. Week one focuses on high-impact, low-complexity interventions: reducing expense ratios by switching to lower-cost fund alternatives, harvesting obvious tax losses, eliminating cash drag, and correcting significant allocation drifts. These actions generate immediate measurable results that build confidence and momentum. Weeks two and three tackle more sophisticated optimizations: correlation analysis, sector rotation, dividend reinvestment strategy refinement, and debt paydown acceleration. Week four establishes monitoring systems and sustainability protocols that ensure gains persist beyond the initial thirty-day period.
The framework incorporates feedback loops and course correction through weekly review checkpoints. Every seven days, you'll assess progress against milestones, quantify results achieved, identify obstacles or unexpected challenges, and adjust subsequent week priorities accordingly. This adaptive approach prevents the system from becoming a rigid checklist that ignores changing circumstances. If market volatility spikes during week two, you might accelerate risk management actions and defer some tax optimization work. If you discover larger-than-expected concentration risks during assessment, you might allocate additional time to diversification strengthening. The weekly reviews ensure the system remains responsive to your specific situation while maintaining overall momentum toward completion.
Technology and automation play supporting roles in the framework. You'll leverage portfolio analysis software, tax-loss harvesting tools, rebalancing calculators, and performance tracking systems to reduce manual effort and improve accuracy. However, the system doesn't require expensive proprietary platforms—most actions can be executed using standard advisor tools, spreadsheets, and publicly available calculators. The emphasis is on systematic process and disciplined execution rather than technological sophistication. A simple spreadsheet tracking rebalancing thresholds and tax-loss harvesting candidates, reviewed weekly, will outperform sophisticated software that's used sporadically or inconsistently.
Finally, the framework recognizes that sustainable systems beat perfect execution. You're not trying to achieve theoretical perfection or implement every possible optimization simultaneously. You're building repeatable processes that generate consistent incremental improvements over time. A rebalancing system that captures 70% of potential benefit but gets executed quarterly will outperform a theoretically optimal approach that's too complex to maintain. The thirty-day period establishes the foundation; the real wealth acceleration comes from repeating the cycle quarterly, continuously refining your processes, and allowing improvements to compound over years. This long-term perspective prevents burnout and ensures the system enhances rather than overwhelms your practice.
Your Implementation Roadmap: What to Expect
The thirty-day implementation follows a structured weekly progression designed to build systematically from assessment through optimization to sustainability. Understanding this roadmap helps you allocate time appropriately, set realistic expectations, and maintain momentum when challenges emerge. Each week has distinct objectives, specific deliverables, and measurable outcomes that mark progress toward your wealth acceleration goals. The roadmap isn't rigid—you'll adapt timing and emphasis based on your specific situation—but it provides the essential structure that prevents the initiative from devolving into unfocused activity.
Week One: Assessment and Quick Wins establishes your baseline and captures immediate optimization opportunities. You'll begin by conducting a comprehensive portfolio audit that quantifies current performance, identifies obvious inefficiencies, and establishes benchmark comparisons. This audit examines asset allocation drift, expense ratios, cash positions, concentration risks, and tax efficiency. Simultaneously, you'll implement quick wins that generate immediate results: switching high-cost funds to low-cost alternatives, harvesting tax losses in positions with unrealized losses exceeding 10%, eliminating excess cash drag by deploying idle funds, and correcting allocation drifts exceeding 5% from targets. These actions typically require 4-6 hours total across the week but can generate 0.3-0.8% in immediate performance improvement through fee reduction and tax capture alone.
Week Two: Optimization and Rebalancing focuses on portfolio structure and risk management. You'll conduct correlation analysis to identify false diversification—holdings that appear different but move together during market stress. You'll implement threshold-based rebalancing protocols that establish specific triggers for future adjustments, eliminating subjective decision-making. You'll analyze concentration risks in detail, developing plans to reduce overexposure to specific securities, sectors, or asset classes. You'll also conduct initial stress testing to understand how your portfolio would perform under various adverse scenarios: market corrections, interest rate spikes, inflation surges, or recession conditions. This week requires deeper analytical work—approximately 5-7 hours—but produces the strategic framework that guides ongoing portfolio management.
Week Three: Tax Efficiency and Income Maximization addresses after-tax returns and cash flow generation. You'll implement systematic tax-loss harvesting protocols that identify opportunities automatically rather than sporadically. You'll optimize asset location, ensuring tax-inefficient holdings reside in tax-advantaged accounts while tax-efficient investments occupy taxable accounts. You'll review dividend reinvestment strategies to ensure they align with overall allocation targets rather than creating unintended drifts. You'll analyze income streams—dividends, interest, distributions—and develop strategies to enhance yield without increasing risk inappropriately. You'll also evaluate debt paydown sequencing to ensure you're targeting highest-cost obligations first while maintaining adequate liquidity. This week typically requires 4-5 hours and can generate 0.5-1.2% in additional after-tax returns annually.
Week Four: Monitoring, Adjustment, and Sustainability establishes systems that ensure gains persist beyond the initial thirty days. You'll create portfolio monitoring dashboards that track key metrics: allocation drift, performance versus benchmarks, tax efficiency indicators, cash flow metrics, and risk measures. You'll establish quarterly review protocols that repeat core assessment and optimization activities on an ongoing basis. You'll document decision rules and thresholds so future actions follow consistent criteria rather than ad hoc judgment. You'll also conduct a retrospective analysis of the thirty-day period: What worked well? What proved more difficult than expected? Which optimizations generated the largest impact? This reflection informs refinements for your next quarterly cycle. Week four requires 3-4 hours and transforms one-time improvements into sustainable competitive advantages.
Throughout the thirty days, you'll encounter predictable challenges that the roadmap helps you navigate:
- Analysis paralysis: The temptation to conduct additional research rather than implementing decisions based on sufficient information
- Scope creep: Expanding the initiative to include tangential improvements that dilute focus and delay completion
- Perfect timing fallacy: Waiting for "better market conditions" to implement optimizations rather than executing systematically
- Complexity overwhelm: Feeling intimidated by the number of moving parts rather than focusing on one week at a time
- Measurement obsession: Checking portfolio performance daily rather than maintaining appropriate evaluation timeframes
You should expect measurable results across multiple dimensions by day thirty. Portfolio expense ratios should decrease by 0.2-0.6% through fund substitutions and fee negotiations. Tax efficiency should improve through captured losses and optimized asset location, generating 0.3-0.8% in additional after-tax returns. Allocation drift should be corrected, reducing unintended risk exposure. Cash drag should be minimized, improving capital efficiency. Diversification quality should strengthen through correlation analysis and concentration risk reduction. Collectively, these improvements typically generate 1.5-3.0% in additional risk-adjusted returns annually—a substantial enhancement that compounds significantly over time.
Beyond quantitative results, you'll develop qualitative capabilities that enhance long-term performance. You'll build systematic decision-making processes that reduce emotional interference and improve consistency. You'll establish monitoring frameworks that identify emerging issues before they become significant problems. You'll create documentation that enables efficient quarterly reviews rather than starting from scratch each time. You'll develop confidence in your optimization processes, which translates to better client communication and stronger advisory relationships. These qualitative benefits often prove as valuable as the quantitative performance improvements because they create sustainable competitive advantages in your practice.
The roadmap also prepares you for post-thirty-day continuation. Wealth acceleration isn't a one-time event—it's an ongoing process of continuous improvement. After completing the initial thirty-day cycle, you'll shift to quarterly maintenance mode: conducting abbreviated assessments, implementing tactical adjustments, capturing new tax-loss harvesting opportunities, and refining your processes based on accumulated experience. This quarterly rhythm—approximately 3-4 hours per quarter—maintains momentum without requiring the intensive focus of the initial implementation period. Over time, these repeated cycles compound into substantial performance advantages that separate your practice from competitors who lack systematic optimization frameworks.
Quick Wins Available in Week One
Week one delivers immediate, measurable improvements that generate momentum and demonstrate the system's effectiveness. These quick wins require minimal analysis, involve low implementation complexity, and produce quantifiable results within days. By capturing these opportunities first, you build confidence in the framework while generating tangible value that justifies the time investment. Quick wins also create psychological momentum—early successes increase commitment to the full thirty-day process and reduce the temptation to abandon the initiative when more complex challenges emerge in later weeks.
Expense ratio reduction represents the most accessible quick win. Review your current holdings and identify funds with expense ratios exceeding 0.50% for equity funds or 0.30% for fixed income funds. For each high-cost holding, identify a comparable low-cost alternative—typically index funds or ETFs from providers like Vanguard, Fidelity, or Schwab. Calculate the annual savings: a $500,000 portfolio with an average expense ratio of 0.80% pays $4,000 annually in fees; reducing the average to 0.20% cuts fees to $1,000, saving $3,000 per year. That's a 0.60% immediate performance improvement that recurs annually. Implementation requires 1-2 hours to research alternatives, verify comparability, and execute exchanges. This single action often generates the largest immediate impact of any week-one intervention.
Consider a specific example: You hold a large-cap growth mutual fund with a 0.95% expense ratio. You identify a comparable large-cap growth index fund with a 0.04% expense ratio. The 0.91% difference on a $200,000 position saves $1,820 annually. Over twenty years, assuming 8% gross returns, this fee difference compounds to approximately $89,000 in additional wealth—from a two-hour action. This isn't theoretical; it's mathematical certainty. Lower fees mean more money remains invested and compounds over time. Week one should target all holdings with expense ratios in the top quartile of their category, prioritizing the largest positions for maximum impact.
Tax-loss harvesting provides another immediate opportunity, particularly in volatile markets or for portfolios that haven't been systematically managed for tax efficiency. Review all taxable account positions and identify holdings with unrealized losses exceeding 10% from cost basis. For each candidate, verify that the loss is substantial enough to justify the transaction (typically $1,000 minimum) and that you haven't violated wash-sale rules by purchasing substantially identical securities within the past thirty days. Execute the sale, capture the loss for tax purposes, and immediately reinvest proceeds in a similar but not substantially identical security to maintain market exposure. A $10,000 realized loss generates $2,000-$3,700 in tax savings depending on your marginal rate, providing immediate value while maintaining your investment strategy.
For example, suppose you hold a technology sector ETF with a $50,000 cost basis now worth $42,000—an $8,000 unrealized loss. You sell the position, capturing the loss, and immediately purchase a different technology ETF that tracks a similar but not identical index. You've maintained technology sector exposure while generating an $8,000 tax loss. At a 32% marginal rate (federal plus state), this produces $2,560 in tax savings—a 5.1% return on the current position value, achieved immediately. Week one should systematically screen all taxable positions for harvesting opportunities, prioritizing the largest losses first.
Cash drag elimination offers a third quick win. Calculate your total portfolio cash position and compare it to your liquidity needs: upcoming expenses, rebalancing reserves, and emergency funds. Any cash exceeding these requirements by more than 2-3% represents drag on performance. Deploy excess cash according to your target asset allocation, typically into your most underweighted asset classes. If you hold 8% cash ($80,000 in a $1,000,000 portfolio) but only need 3% for liquidity ($30,000), you can deploy $50,000 immediately. Assuming that cash earns 0.5% while deployed capital earns 7%, you've improved returns by $3,250 annually—a 0.33% portfolio-wide enhancement from a single action requiring thirty minutes to execute.
Allocation drift correction provides a fourth immediate opportunity. Compare your current asset allocation to your target allocation and identify any asset class that has drifted more than 5% from target. This drift typically occurs through differential performance—strong equity returns push stock allocations above target while bond allocations fall below target. Rebalancing captures gains from outperforming assets and redeploys them to underperforming assets, maintaining your intended risk profile while systematically buying low and selling high. Research suggests that maintaining allocation discipline through systematic rebalancing can add 0.4-0.8% annually to risk-adjusted returns[2].
For instance, your target allocation is 60% stocks / 40% bonds, but strong equity performance has pushed your actual allocation to 68% stocks / 32% bonds. You're now taking more risk than intended without additional expected return compensation. Rebalancing to 60/40 requires selling 8% of portfolio value from stocks ($80,000 in a $1,000,000 portfolio) and purchasing bonds. This action restores your risk profile, captures equity gains, and positions you to benefit when bonds outperform in the next market cycle. Week one should correct any drift exceeding 5%, with larger drifts taking priority.
These four quick wins—expense reduction, tax-loss harvesting, cash deployment, and drift correction—can collectively generate 1.0-2.0% in immediate performance improvement while requiring only 4-6 hours of implementation time. This represents an extraordinary return on time invested: 4 hours generating $10,000-$20,000 in annual value for a $1,000,000 portfolio equals $2,500-$5,000 per hour of work. Few professional activities generate comparable value density. Moreover, these aren't one-time benefits—expense savings recur annually, tax losses provide ongoing value through carryforwards, and rebalancing discipline compounds over decades.
Beyond financial returns, week-one quick wins generate psychological momentum that sustains commitment through more challenging later phases. When you can point to specific, measurable improvements within seven days—"I reduced fees by $3,200 annually, captured $6,500 in tax losses, and corrected a 7% allocation drift"—the system's value becomes concrete rather than theoretical. This tangible progress increases the likelihood you'll complete the full thirty-day cycle and establish quarterly repetition. Quick wins transform abstract optimization concepts into lived experience, which is crucial for building the confidence and discipline required for sustained wealth acceleration.
Week one also establishes baseline metrics that enable progress tracking throughout the thirty days and beyond. By documenting your starting expense ratio, tax efficiency, cash position, and allocation drift, you create reference points for measuring improvement. Without these baselines, you can't definitively demonstrate that your optimization efforts produced results—you're left with subjective impressions rather than objective evidence. The combination of quick wins and baseline establishment makes week one the foundation for everything that follows, which is why the roadmap prioritizes these activities before moving to more complex optimizations in subsequent weeks.
This is the end of the free sample. The full book has 12 chapters.
Want this book written for you?
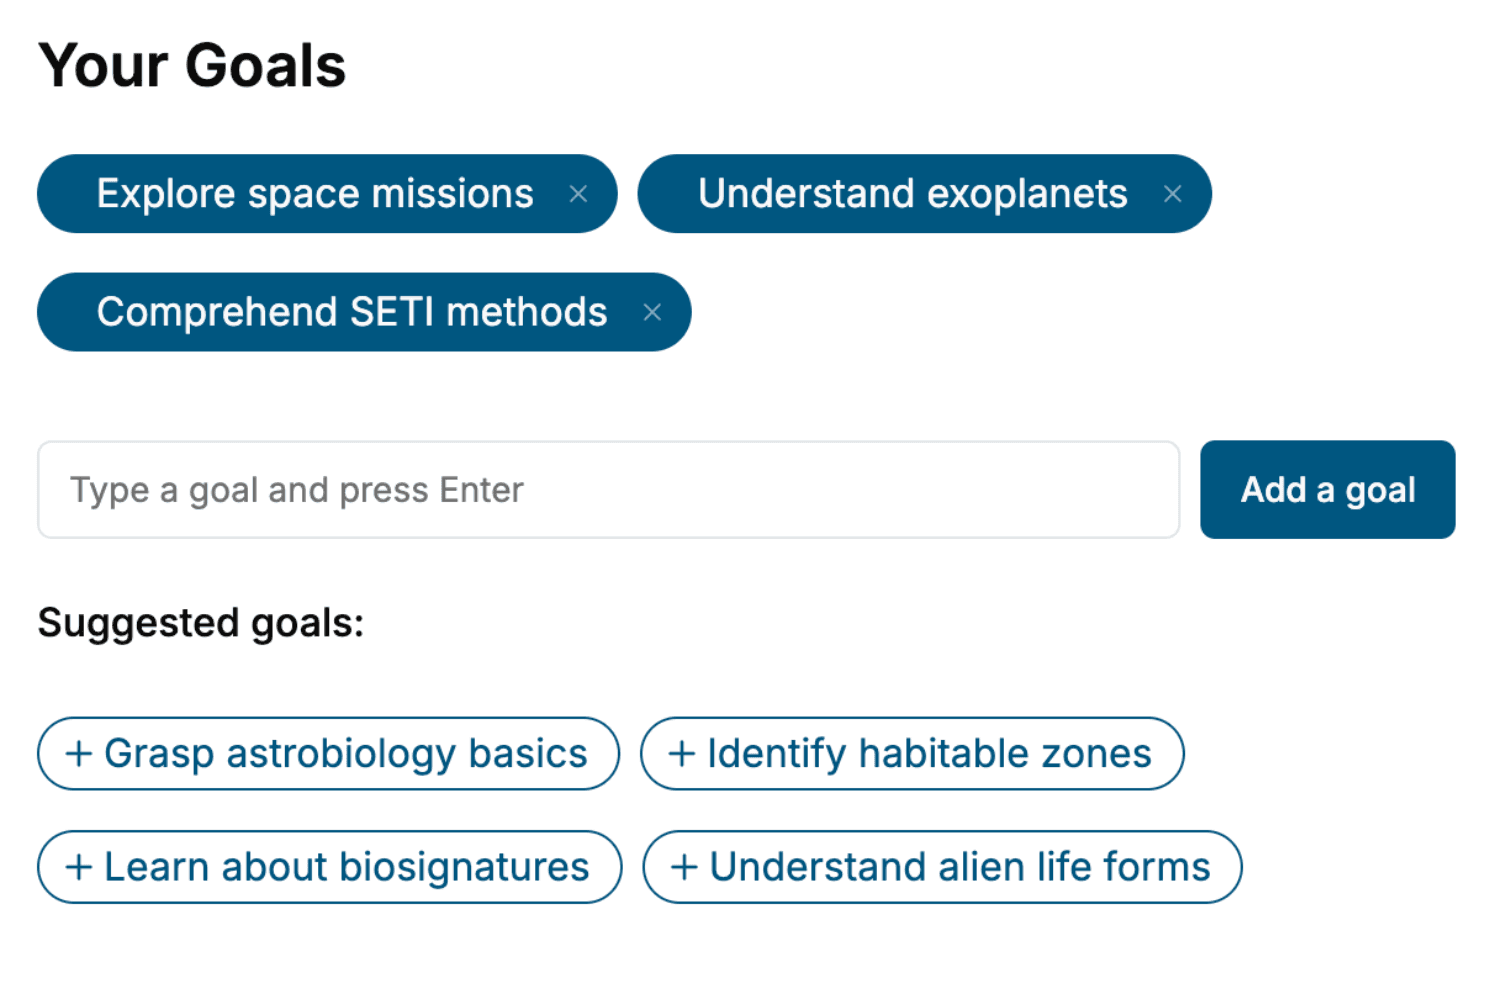
Tell us your goals and background, and get your own version of this book, tailored by AI to you.


Benefits of AI-tailored books
- Read one book, not ten:
- all the Investment Strategy knowledge you need, gathered into a single book.
- Save days of learning:
- tell us your goals, choose your topics, and the whole book is built around them.
- Learn effortlessly:
- Investment Strategy book written for your specific background and expertise.
- Understand at a glance:
- includes charts, tables, timelines, checklists, decision trees, and more.
- Stay current:
- written the day you order it, not years ago.
- Trust what you read:
- every book is checked for accuracy, with real research when your subject needs it.
Create your unique book in 3 steps
- 1. Select your focus
Select the focus of your Investment Strategy book and share your background
- 2. Personalize your book
Specify your goals and choose sub-topics to include
- 3. Get your tailored book
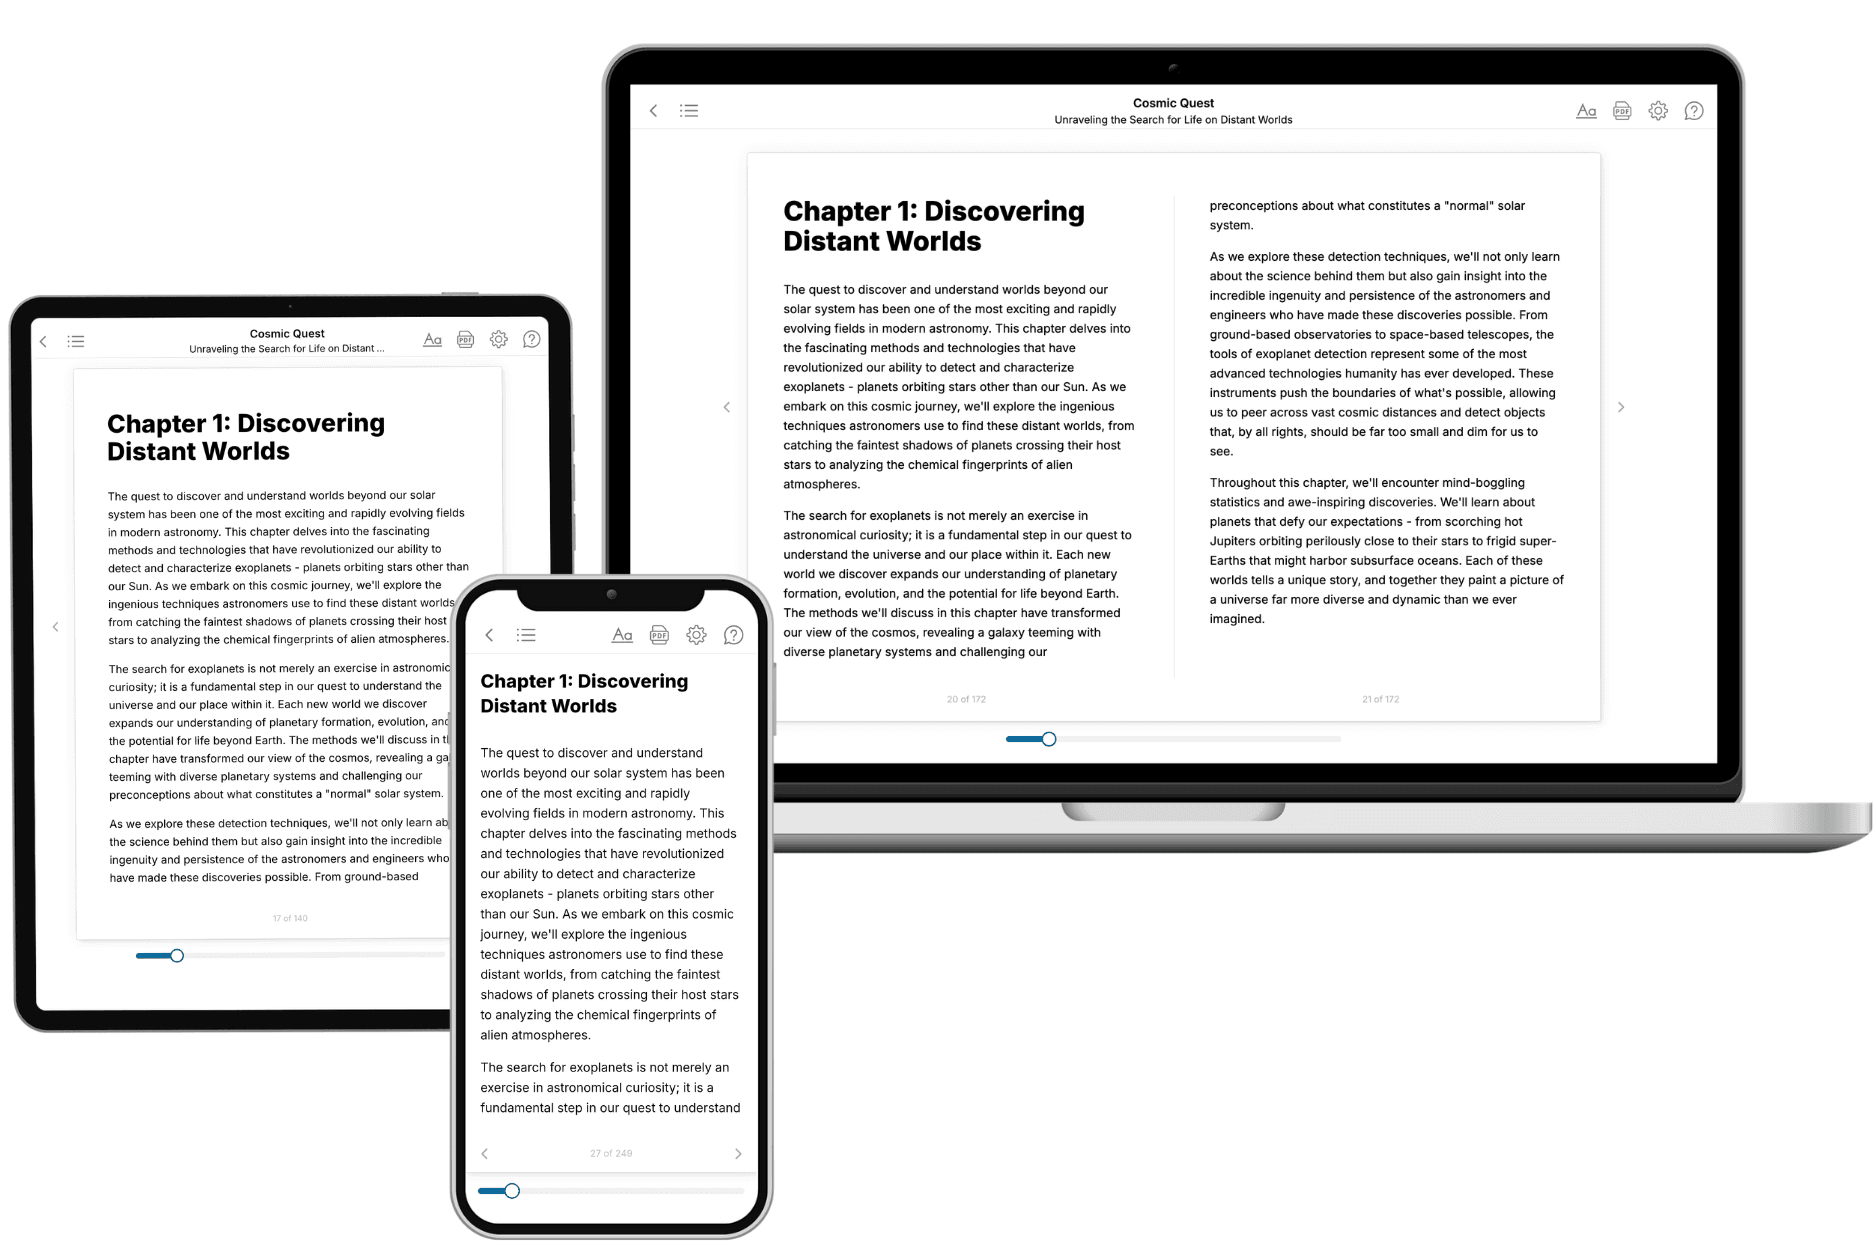
Your book is ready in 10 minutes. Read it online, download as EPUB or PDF, or send to Kindle.

Frequently asked questions
- What is TailoredRead?
TailoredRead creates complete, full-length nonfiction ebooks, written specifically for you. Tell us what you want to learn and why, and TailoredRead writes you a complete ebook on it, with charts, tables, and diagrams throughout. Read it online, on Kindle, or on any e-reader, or download it as a PDF or EPUB. Every book is written fresh the day you order it.
- How is the book tailored to me?
Before anything is written, you answer a few short questions about your goals, your background, and the topics you care about. Your book is then planned around your answers: written at your level, focused on your goals, and covering the topics you chose, instead of the one-size-fits-all book a store sells everyone.
- Will it read like generic AI content?
No. Your book isn't a chat transcript: it's planned chapter by chapter before a single word is written, told in a clear book voice, and explains ideas visually with charts, tables, and diagrams. After writing, every book goes through an editorial pass that polishes chapters so the book reads consistent from start to finish. Judge for yourself: browse thousands of sample books on our Explore Books page.
- How accurate is the content?
Our AI first checks whether your subject needs live research. Niche and fast-moving subjects are researched before writing, and the book plan and chapters are grounded in what it finds. After writing, every book goes through a quality pass that checks its facts and consistency, and researched books list their sources in a Notes section at the back.
- How long is the book?
You choose the length: Comprehensive (250-300 pages), Detailed (150-200 pages), Essential (70-100 pages), or Short (30-50 pages).
- Does the book include visuals?
Yes. Every book includes charts, tables, and diagrams: timelines, checklists, step-by-step guides, decision trees, comparison tables, matrices, and bar charts. A typical book includes dozens of these visual elements.
- Can I read it on Kindle? What formats can I download?
Yes. Every book can be read in our online reader or downloaded as a PDF or EPUB. The EPUB can be opened with Kindle, Apple Books, Kobo, and any e-reader. The Commercial and Author licenses also include an editable Word (DOCX) and Markdown download.
- How much does it cost?
About the price of a regular ebook. The exact price depends on your book's length and complexity, from $2 for the shortest books to $35 for the most comprehensive, and it's shown when you review your book, before you commit to anything. Each book is a one-time purchase, yours to keep, no subscription. Licenses that let you share, teach, or publish your book range from $35.99 to $49.99.
- Can I preview the book before purchasing?
Before you pay, you'll see what your book will cover: the title, a detailed description, the estimated length, and the complete chapter-by-chapter table of contents, so you know what you're getting before you decide. The full text itself is written after you purchase.
- How long does it take to create a book?
About 10 minutes. You can start reading the opening chapters while the rest is still being written.