ANOVA Essentials
Master Statistical Significance Testing and Algorithmic Decision-Making
Many professionals struggle to determine whether differences in their data are meaningful or merely coincidental.
222 pages10 chaptersDec 24, 2025Statistics
About this book
ANOVA (Analysis of Variance) is the statistical tool that answers this critical question, yet its mathematical foundations and practical applications often remain unclear. This book demystifies ANOVA by connecting statistical theory to real-world scenarios in computer science, algorithm validation, and data analysis. You'll learn how ANOVA tests work, when to use each variant, how to verify assumptions, and how to interpret results with confidence. Whether you're comparing algorithm performance, validating experimental designs, or making evidence-based decisions, this guide provides the conceptual understanding and practical skills you need. With clear explanations, worked examples, and guidance on common pitfalls, you'll move from confusion to competence in statistical significance testing.
Table of contents
- IntroductionWhy ANOVA Matters in Modern Analysis, What You'll Learn in This Book, How to Use This GuideRead below
- Chapter 1: Foundations of Statistical SignificanceHypothesis Testing Basics, Type I and Type II Errors, Understanding P-Values, Significance Levels and Alpha
- Chapter 2: The Logic Behind ANOVADecomposing Variance: Between and Within Groups, The F-Statistic: Ratio of Variances, Null and Alternative Hypotheses in ANOVA
- Chapter 3: One-Way ANOVA: Comparing Multiple GroupsUnderstanding One-Way ANOVA Design, Calculations Step-by-Step, Interpreting ANOVA Tables and Results, Practical Example: Algorithm Performance Comparison
- Chapter 4: Verifying ANOVA AssumptionsTesting for Normality, Homogeneity of Variance, Independence of Observations, What to Do When Assumptions Are Violated
- Chapter 5: Post-Hoc Tests and Effect SizesThe Multiple Comparisons Problem, Tukey, Bonferroni, and Other Post-Hoc Tests, Measuring Effect Size: Eta-Squared and Omega-Squared, Statistical vs. Practical Significance
- Chapter 6: Two-Way ANOVA: Analyzing Multiple FactorsTwo-Way ANOVA Design and Interactions, Main Effects and Interaction Effects, Calculations and Interpretation, Example: Testing Algorithm Performance Across Conditions
- Chapter 7: Repeated Measures ANOVAWhen and Why to Use Repeated Measures ANOVA, Sphericity and Mauchly's Test, Conducting and Interpreting Repeated Measures ANOVA
- Chapter 8: ANOVA in Computer Science and Algorithm ValidationUsing ANOVA to Compare Algorithm Performance, A/B Testing and Experimental Design, ANOVA in Machine Learning Model Evaluation, Computational Considerations and Scalability
- Chapter 9: Software Implementation and ToolsANOVA in R: Functions and Packages, ANOVA in Python: SciPy and Statsmodels, Interpreting Software Output and Reporting Results
- Chapter 10: Common Pitfalls and Best PracticesCommon Misinterpretations of ANOVA Results, Sample Size, Statistical Power, and Planning, Best Practices for Robust Analysis
- ConclusionKey Takeaways, Next Steps in Your Statistical Journey
- Glossary of Terms
- Further Reading and Resources
Introduction
Every day, professionals across industries face a fundamental question: are the differences I'm observing in my data real, or just random noise? When you test three algorithms and find that one runs faster, when you compare user engagement across multiple website designs, or when you measure performance variations across different system configurations, you need a reliable way to determine whether those differences matter. This is where Analysis of Variance—ANOVA—becomes indispensable. ANOVA provides a rigorous statistical framework for comparing means across multiple groups simultaneously, answering whether observed variations reflect genuine effects or merely chance fluctuations. Unlike simpler tests that compare only two groups, ANOVA handles complex scenarios with multiple conditions while controlling for the increased risk of false positives that comes with multiple comparisons.
The challenge many face isn't recognizing the need for statistical validation—it's understanding how to apply the right tools correctly. ANOVA sits at the intersection of statistical theory and practical application, requiring both conceptual understanding and technical skill. You might know that ANOVA tests for differences between groups, but do you understand why it analyzes variance rather than means directly? Can you explain when to use one-way versus two-way ANOVA, or how to verify that your data meets the necessary assumptions? Do you know how to interpret an F-statistic, conduct appropriate follow-up tests, or distinguish between statistical and practical significance? These questions represent the gap between awareness and competence—a gap this book is designed to bridge systematically and thoroughly.
This book takes a pragmatic approach to ANOVA, emphasizing both the underlying logic and the practical implementation. You won't find dense mathematical proofs or abstract theory disconnected from application. Instead, you'll discover clear explanations of how ANOVA works, why it's structured the way it is, and how to apply it confidently to real-world problems. Each concept builds on the previous one, creating a coherent path from basic hypothesis testing through advanced ANOVA variants. Whether you're validating algorithms, designing experiments, analyzing performance data, or making evidence-based decisions, you'll gain the knowledge and skills to use ANOVA effectively. The focus throughout is on understanding—not just following procedures, but grasping the reasoning behind them so you can adapt your approach to different situations and interpret results with confidence.
The structure of this book reflects a deliberate progression from foundations to applications. Early chapters establish the statistical groundwork you need, covering hypothesis testing, p-values, and the logic of variance decomposition. Middle chapters explore different ANOVA variants—one-way, two-way, and repeated measures—with detailed explanations of when and how to use each. Later chapters address practical concerns like assumption verification, post-hoc testing, and software implementation. Throughout, you'll find concrete examples drawn from computer science, algorithm validation, and data analysis contexts that demonstrate how ANOVA solves real problems. By the end, you'll have both the conceptual framework and the practical toolkit to apply ANOVA appropriately and interpret results accurately in your own work.
Why ANOVA Matters in Modern Analysis
In an era of big data and computational power, you might wonder why a statistical technique developed in the early 20th century remains relevant. The answer lies in a fundamental challenge that no amount of computing power can eliminate: distinguishing signal from noise. When you collect data from multiple groups or conditions, variation appears everywhere. Some variation reflects genuine differences between groups—the signal you're trying to detect. Other variation represents random fluctuations inherent in any measurement process—the noise that obscures your signal. ANOVA provides a principled mathematical framework for separating these two sources of variation, quantifying the evidence for real differences, and making defensible conclusions about what your data reveals. This capability remains as essential today as when Ronald Fisher first developed ANOVA for agricultural experiments in the 1920s.
The modern relevance of ANOVA extends far beyond its historical origins in agriculture. In computer science and software engineering, ANOVA validates algorithm performance comparisons, ensuring that observed speed or accuracy differences aren't merely artifacts of random variation in test conditions. In machine learning, ANOVA helps evaluate whether different models, hyperparameters, or training approaches produce genuinely different results across validation sets. In A/B testing and user experience research, ANOVA determines whether interface variations actually affect user behavior or engagement metrics. In systems performance analysis, ANOVA identifies whether configuration changes meaningfully impact throughput, latency, or resource utilization. Each application shares the same core need: rigorous statistical evidence that observed differences represent real effects worth acting upon.
Consider a concrete scenario that illustrates ANOVA's value. Suppose you're comparing the execution time of four different sorting algorithms across various input sizes. You run each algorithm multiple times and collect timing data. Algorithm A appears fastest on average, but the times vary considerably across runs. Does Algorithm A genuinely outperform the others, or could the apparent advantage result from random variation in system load, memory allocation, or other factors? A simple comparison of means doesn't answer this question reliably. ANOVA, however, quantifies how much of the total variation in execution times comes from differences between algorithms versus variation within each algorithm's repeated runs. It produces an F-statistic and p-value that tell you whether the between-algorithm differences are large enough, relative to random variation, to conclude with confidence that real performance differences exist.
ANOVA's power comes from its ability to handle multiple groups simultaneously while controlling the overall error rate. If you compared four algorithms using pairwise t-tests—Algorithm A versus B, A versus C, A versus D, B versus C, and so on—you'd conduct six separate tests. Each test carries a risk of false positives (Type I errors), and these risks accumulate across multiple tests. With a standard significance level of 0.05, your overall chance of at least one false positive across six tests exceeds 25%[1]. ANOVA solves this problem by testing all groups together in a single analysis, maintaining the desired error rate. This makes ANOVA not just convenient but statistically necessary when comparing more than two groups—a common situation in algorithm validation, experimental design, and performance analysis.
Beyond its statistical rigor, ANOVA matters because it connects to broader analytical thinking. Understanding ANOVA deepens your grasp of variance, effect sizes, experimental design, and the relationship between statistical and practical significance. These concepts transfer to other statistical methods and strengthen your overall analytical capabilities. ANOVA also teaches you to think critically about data quality, assumptions, and the conditions under which conclusions remain valid. This critical thinking proves valuable even when you're not explicitly conducting ANOVA—it shapes how you design studies, collect data, and interpret results across all analytical work. In this sense, learning ANOVA isn't just about mastering one technique; it's about developing a more sophisticated understanding of statistical inference and evidence-based decision-making.
The practical applications of ANOVA in modern contexts continue to expand. In cloud computing, ANOVA compares performance across different instance types, regions, or configurations to optimize cost and efficiency. In cybersecurity, ANOVA evaluates whether different security measures produce measurably different outcomes in threat detection or response times. In data science, ANOVA validates feature engineering approaches by testing whether different transformations produce significantly different model performance. In quality assurance, ANOVA determines whether software versions, hardware platforms, or environmental conditions affect reliability metrics. Each application demonstrates that ANOVA isn't an academic exercise—it's a practical tool for making better decisions based on empirical evidence rather than intuition or guesswork.
Understanding ANOVA also provides a foundation for more advanced statistical methods. Many sophisticated techniques—including mixed models, multivariate analysis, and machine learning evaluation frameworks—build on ANOVA's core concepts. The F-statistic appears in regression analysis for testing overall model significance. The logic of variance decomposition underlies hierarchical models and random effects analysis. The principles of hypothesis testing and significance levels extend to virtually all inferential statistics. By mastering ANOVA, you're not just learning one isolated technique; you're building conceptual scaffolding that supports continued growth in statistical knowledge and analytical sophistication. This makes ANOVA an essential stepping stone in your development as a data-driven professional, regardless of your specific field or application domain.
What You'll Learn in This Book
This book provides a comprehensive journey through ANOVA, from foundational concepts to practical implementation. You'll begin by establishing the statistical groundwork necessary for understanding ANOVA's logic and interpretation. Chapter 1 covers hypothesis testing fundamentals, including null and alternative hypotheses, Type I and Type II errors, p-values, and significance levels. These concepts form the bedrock of all inferential statistics, and understanding them thoroughly ensures you can interpret ANOVA results correctly. You'll learn not just what a p-value is, but what it actually tells you and—equally important—what it doesn't tell you. This foundation prevents common misinterpretations that lead to flawed conclusions and poor decisions based on statistical analyses.
Chapter 2 delves into the specific logic behind ANOVA, explaining why this method analyzes variance to test differences in means. You'll discover how ANOVA decomposes total variation in your data into between-group and within-group components, and why the ratio of these components (the F-statistic) reveals whether group differences are statistically significant. This chapter demystifies the mathematical reasoning without requiring advanced calculus or probability theory. Instead, you'll develop an intuitive understanding of variance decomposition through clear explanations and visual analogies. By the end of this chapter, you'll grasp why ANOVA is structured the way it is, making subsequent chapters' technical details more accessible and meaningful.
Chapters 3 through 7 systematically cover different ANOVA variants, each suited to specific research designs and data structures:
- One-way ANOVA (Chapter 3) for comparing means across multiple independent groups with a single factor
- Assumption verification (Chapter 4) for testing normality, homogeneity of variance, and independence—and what to do when assumptions fail
- Post-hoc tests and effect sizes (Chapter 5) for determining which specific groups differ and how meaningful those differences are
- Two-way ANOVA (Chapter 6) for analyzing two factors simultaneously and detecting interaction effects
- Repeated measures ANOVA (Chapter 7) for within-subjects designs where the same units are measured multiple times
You'll learn not just how to conduct ANOVA, but when to use each variant and why. One-way ANOVA suits scenarios where you're comparing multiple groups on a single factor—like testing four algorithms on execution time. Two-way ANOVA becomes necessary when you want to examine two factors simultaneously—like testing those same algorithms across different input sizes, allowing you to detect whether algorithm performance depends on input size (an interaction effect). Repeated measures ANOVA applies when you measure the same subjects or systems multiple times—like testing algorithm performance on the same hardware under different conditions. Understanding these distinctions ensures you select the appropriate analysis for your research design, avoiding the invalid conclusions that result from misapplied statistical methods.
Chapter 8 bridges statistical theory and practical application by focusing specifically on ANOVA's role in computer science and algorithm validation. You'll see detailed examples of using ANOVA to compare algorithm performance, validate machine learning models, design and analyze A/B tests, and evaluate system configurations. This chapter addresses computational considerations like scalability, automation, and integration with existing workflows. You'll learn how to structure experiments to maximize statistical power while minimizing computational cost, how to handle large datasets efficiently, and how to communicate results effectively to technical and non-technical audiences. These practical insights transform ANOVA from an abstract statistical concept into a concrete tool you can apply immediately in your work.
Chapter 9 provides hands-on guidance for implementing ANOVA using popular statistical software. You'll learn how to conduct ANOVA in both R and Python, including:
- Essential functions and packages for each platform (R's
aov()andlm()functions; Python'sscipy.statsandstatsmodelslibraries) - Data preparation and formatting requirements for different ANOVA variants
- Interpreting software output, including ANOVA tables, diagnostic plots, and summary statistics
- Conducting assumption checks and post-hoc tests programmatically
- Generating publication-quality visualizations and reports
Chapter 10 addresses common pitfalls and best practices, helping you avoid mistakes that compromise analytical validity. You'll learn about frequent misinterpretations of ANOVA results, such as confusing statistical significance with practical importance or assuming that a non-significant result proves groups are equivalent. You'll discover how sample size affects statistical power—the probability of detecting real effects when they exist—and how to plan studies that balance statistical rigor with practical constraints. This chapter also covers best practices for robust analysis, including data quality checks, sensitivity analyses, and transparent reporting. These insights help you conduct ANOVA not just correctly, but excellently, producing analyses that withstand scrutiny and support confident decision-making.
Throughout the book, you'll encounter concrete examples that illustrate concepts in action. Rather than abstract datasets with generic variables, you'll see ANOVA applied to realistic scenarios: comparing sorting algorithm efficiency, evaluating machine learning model performance across different hyperparameters, testing user interface variations in A/B experiments, and analyzing system performance under various configurations. Each example includes the complete analytical process—from formulating hypotheses and checking assumptions through conducting the analysis and interpreting results. This approach ensures you understand not just isolated techniques, but the complete workflow of applying ANOVA to solve real problems. By the end, you'll have both the conceptual understanding and the practical skills to use ANOVA confidently in your own work.
How to Use This Guide
This book is designed for intermediate learners who already have foundational statistics knowledge. You should be comfortable with basic concepts like mean, variance, standard deviation, and probability distributions. Familiarity with hypothesis testing—even at a basic level—will help, though Chapter 1 reviews these concepts thoroughly. You don't need advanced mathematical training; the book emphasizes conceptual understanding and practical application over mathematical proofs. If you've taken an introductory statistics course or worked with data analysis in any capacity, you have sufficient background to benefit from this material. The goal isn't to make you a theoretical statistician, but to give you the practical competence to apply ANOVA correctly and interpret results accurately in real-world contexts.
The book follows a deliberate progression, with each chapter building on previous material. For most readers, working through chapters sequentially provides the clearest learning path. Chapters 1 and 2 establish essential foundations that subsequent chapters assume you understand. Skipping these early chapters may leave you confused about terminology, concepts, or reasoning in later sections. However, if you already have solid grounding in hypothesis testing and understand the basic logic of ANOVA, you might skim Chapters 1-2 and focus more attention on Chapters 3-7, which cover specific ANOVA variants in detail. Chapter 8 on applications and Chapter 9 on software implementation can be read in either order depending on whether you prefer to see applications before or after learning implementation mechanics.
Each chapter includes multiple elements designed to support learning and retention:
- Conceptual explanations that clarify the reasoning behind techniques, not just the procedures
- Step-by-step examples that walk through complete analyses from start to finish
- Practical guidance on when to use each technique and how to avoid common mistakes
- Code examples in R and Python that you can adapt to your own analyses
- Visual aids including tables, formulas, and conceptual diagrams that clarify complex ideas
Active engagement dramatically improves learning outcomes. Rather than passively reading, pause regularly to test your understanding. After learning about one-way ANOVA in Chapter 3, try applying it to a dataset before moving to Chapter 4. When you encounter a new concept, ask yourself how it connects to what you already know and how you might use it in your work. If something seems unclear, revisit earlier sections or work through additional examples until the concept clicks. The book provides explanations and examples, but genuine understanding comes from wrestling with ideas yourself, making mistakes, and figuring out why certain approaches work while others don't. This active learning process takes more time initially but produces deeper, more durable understanding.
The code examples in Chapter 9 deserve special attention. Don't just read the code—run it yourself. Install the necessary packages, load the example datasets, and execute the analyses. Experiment by changing parameters, trying different options, or applying the code to your own data. This hands-on practice builds the practical skills that reading alone cannot develop. You'll encounter error messages, unexpected results, and formatting issues—all valuable learning opportunities that teach you how to troubleshoot problems and refine your analyses. The goal isn't to memorize code syntax, but to develop fluency with the tools so you can implement ANOVA efficiently when you need it. This practical competence comes only through direct experience, not passive observation.
Consider creating a personal reference document as you progress through the book. Summarize key concepts in your own words, note which ANOVA variant applies to which research design, record common pitfalls to avoid, and collect code snippets you'll want to reuse. This personalized reference serves two purposes: the act of creating it reinforces learning, and the finished document becomes a practical resource you can consult when applying ANOVA in your work. Include examples from your own domain or context, making the material more relevant and memorable. This investment of time pays dividends later when you need to recall specific details or apply ANOVA to a new problem without rereading entire chapters.
The book includes a glossary of terms and a further reading section at the end. Use these resources actively rather than treating them as mere appendices. When you encounter an unfamiliar term, check the glossary for a concise definition. When you want to explore a topic more deeply, consult the further reading section for recommended resources. The glossary is particularly useful for reviewing terminology before applying ANOVA to your own work, ensuring you use terms correctly when communicating results to colleagues or stakeholders. The further reading section points you toward more advanced treatments of topics introduced here, supporting continued learning beyond this book's scope.
Finally, remember that learning statistics is inherently iterative. You won't master ANOVA by reading this book once. Concepts that seem confusing initially often become clear when you encounter them again in different contexts or apply them to real problems. Don't be discouraged if certain sections require multiple readings or if you need to revisit earlier chapters as you progress. This is normal and expected. Statistical thinking develops gradually through repeated exposure, practice, and application. The goal isn't to memorize every detail, but to build a solid conceptual framework and practical toolkit that you can refine and expand through continued use. This book provides the foundation; your ongoing work with ANOVA will build the expertise that comes only with experience and practice over time.
Notes
Introduction
- 1. Calculated as 1 - (1 - 0.05)^6 ≈ 0.265, assuming independent tests
This is the end of the free sample. The full book has 10 chapters.
Want this book written for you?
Tell us your goals and background, and get your own version of this book, tailored by AI to you.


Benefits of AI-tailored books
- Read one book, not ten:
- all the Statistics knowledge you need, gathered into a single book.
- Save days of learning:
- tell us your goals, choose your topics, and the whole book is built around them.
- Learn effortlessly:
- Statistics book written for your specific background and expertise.
- Understand at a glance:
- includes charts, tables, timelines, checklists, decision trees, and more.
- Stay current:
- written the day you order it, not years ago.
- Trust what you read:
- every book is checked for accuracy, with real research when your subject needs it.
Create your unique book in 3 steps
- 1. Select your focus
Select the focus of your Statistics book and share your background
- 2. Personalize your book
Specify your goals and choose sub-topics to include
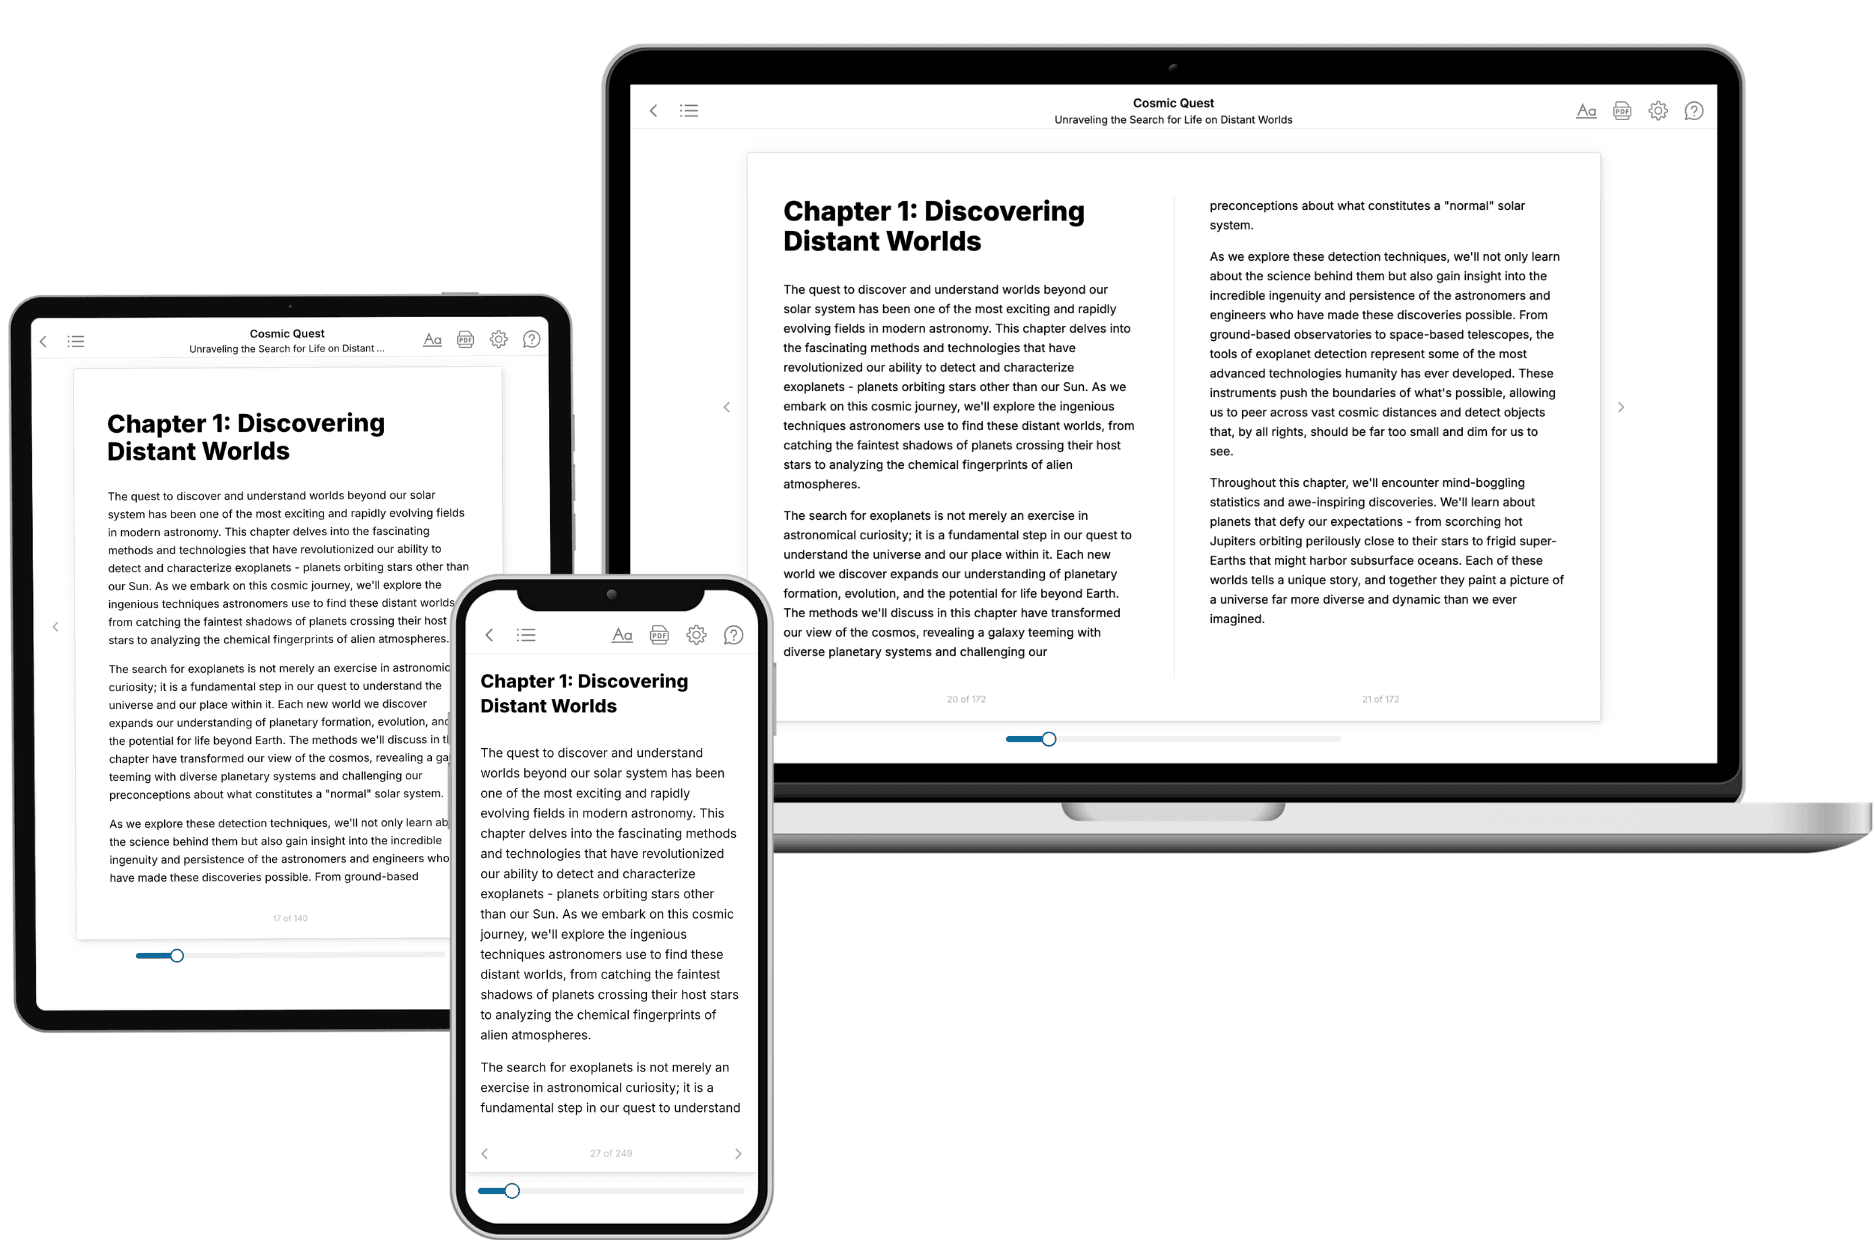
- 3. Get your tailored book
Your book is ready in 10 minutes. Read it online, download as EPUB or PDF, or send to Kindle.
Frequently asked questions
- What is TailoredRead?
TailoredRead creates complete, full-length nonfiction ebooks, written specifically for you. Tell us what you want to learn and why, and TailoredRead writes you a complete ebook on it, with charts, tables, and diagrams throughout. Read it online, on Kindle, or on any e-reader, or download it as a PDF or EPUB. Every book is written fresh the day you order it.
- How is the book tailored to me?
Before anything is written, you answer a few short questions about your goals, your background, and the topics you care about. Your book is then planned around your answers: written at your level, focused on your goals, and covering the topics you chose, instead of the one-size-fits-all book a store sells everyone.
- Will it read like generic AI content?
No. Your book isn't a chat transcript: it's planned chapter by chapter before a single word is written, told in a clear book voice, and explains ideas visually with charts, tables, and diagrams. After writing, every book goes through an editorial pass that polishes chapters so the book reads consistent from start to finish. Judge for yourself: browse thousands of sample books on our Explore Books page.
- How accurate is the content?
Our AI first checks whether your subject needs live research. Niche and fast-moving subjects are researched before writing, and the book plan and chapters are grounded in what it finds. After writing, every book goes through a quality pass that checks its facts and consistency, and researched books list their sources in a Notes section at the back.
- How long is the book?
You choose the length: Comprehensive (250-300 pages), Detailed (150-200 pages), Essential (70-100 pages), or Short (30-50 pages).
- Does the book include visuals?
Yes. Every book includes charts, tables, and diagrams: timelines, checklists, step-by-step guides, decision trees, comparison tables, matrices, and bar charts. A typical book includes dozens of these visual elements.
- Can I read it on Kindle? What formats can I download?
Yes. Every book can be read in our online reader or downloaded as a PDF or EPUB. The EPUB can be opened with Kindle, Apple Books, Kobo, and any e-reader. The Commercial and Author licenses also include an editable Word (DOCX) and Markdown download.
- How much does it cost?
About the price of a regular ebook. The exact price depends on your book's length and complexity, from $2 for the shortest books to $35 for the most comprehensive, and it's shown when you review your book, before you commit to anything. Each book is a one-time purchase, yours to keep, no subscription. Licenses that let you share, teach, or publish your book range from $35.99 to $49.99.
- Can I preview the book before purchasing?
Before you pay, you'll see what your book will cover: the title, a detailed description, the estimated length, and the complete chapter-by-chapter table of contents, so you know what you're getting before you decide. The full text itself is written after you purchase.
- How long does it take to create a book?
About 10 minutes. You can start reading the opening chapters while the rest is still being written.