Beyond Chance
Master Statistical Significance Testing to Make Smarter Decisions
You'll transform how you evaluate evidence and make decisions by mastering the principles of statistical significance testing.
207 pages9 chaptersJun 22, 2026Statistics
About this book
This book cuts through the confusion and jargon to show you exactly how statistical tests work, why they matter, and—most importantly—how to use them wisely without falling into common traps. You'll learn to distinguish between findings that are statistically significant and those that actually matter in practice, understand what p-values really tell you, and design better experiments and analyses from the start. Whether you're evaluating business metrics, research findings, or strategic decisions, you'll gain the analytical confidence to question claims, spot flawed reasoning, and make choices backed by solid evidence rather than wishful thinking.
Table of contents
- IntroductionWhy Statistical Thinking Matters in Your Decisions, What You'll Learn in This Book, How to Use This Book for Maximum BenefitRead below
- Chapter 1: The Foundation: What Statistical Significance Really MeansSignal Versus Noise: Separating Real Patterns from Random Variation, The Null Hypothesis: Your Starting Point, Defining Statistical Significance in Plain Language
- Chapter 2: Understanding P-Values: What They Really Tell YouThe True Meaning of P-Values, Five Critical Mistakes People Make When Interpreting P-Values, Why 0.05 Is Arbitrary and What It Actually Means
- Chapter 3: Beyond P-Values: Effect Size and Practical SignificanceWhy Effect Size Matters More Than You Think, The Critical Difference Between Statistical and Practical Significance, How Sample Size Affects Your Results and Conclusions
- Chapter 4: Confidence Intervals: A Better Way to Think About UncertaintyWhat Confidence Intervals Actually Represent, Why Confidence Intervals Often Tell You More Than P-Values, Reading and Using Confidence Intervals in Decision-Making
- Chapter 5: Common Pitfalls: How Good Intentions Lead to Bad ConclusionsP-Hacking and Data Dredging: The Temptation to Find Significance, The Multiple Comparisons Problem: When Testing Many Hypotheses Backfires, Publication Bias and the File Drawer Problem, Other Common Mistakes: Stopping Rules, Selective Reporting, and Assumptions
- Chapter 6: Designing Better Tests: Setting Yourself Up for SuccessFormulating Clear, Testable Hypotheses Before You Analyze, Planning Your Sample Size: Power Analysis and Practical Constraints, Preregistration and Analysis Plans: Committing to Your Methods in Advance
- Chapter 7: Choosing the Right Test: A Practical GuideA Framework for Selecting the Appropriate Statistical Test, Common Tests and When to Use Them: T-Tests, ANOVA, Chi-Square, and More, Why Checking Assumptions Prevents Misleading Results
- Chapter 8: Real-World Applications: Statistical Thinking in ActionEvaluating Business Metrics and A/B Test Results, Critically Assessing Research Claims and Published Studies, Applying Statistical Thinking to Personal and Professional Choices
- Chapter 9: Building Your Statistical Intuition: From Theory to PracticeDeveloping Healthy Skepticism About Statistical Claims, The Right Questions to Ask When You See Statistical Evidence, Deepening Your Understanding: Resources and Next Steps
- ConclusionKey Takeaways: Your Statistical Significance Toolkit, Moving Forward with Confidence
- Glossary
- Further Reading and Resources
Introduction
Every day, decisions get made based on data that may or may not mean what people think it means. A marketing team celebrates a campaign that "significantly outperformed" the previous one. A product manager ships a new feature because an A/B test showed a positive result. A researcher publishes a finding because the p-value came in under 0.05. These moments feel like victories grounded in evidence. But in many cases, the numbers are being misread, misused, or misunderstood in ways that lead to real consequences down the line.
Statistical significance testing is one of the most powerful tools available for making sense of data. It gives you a structured, systematic way to ask whether what you're seeing in your data reflects a genuine pattern or just the random noise that shows up in any dataset. Used well, it can sharpen your thinking, protect you from costly mistakes, and give you genuine confidence in your conclusions. Used poorly, it can create an illusion of certainty where none exists, and that illusion can be more dangerous than having no data at all.
This book exists because the gap between how statistical significance testing is taught and how it's actually used in the real world is enormous. Most people who work with data have picked up just enough statistical vocabulary to sound credible in a meeting, but not enough to catch the subtle errors that quietly undermine their conclusions. The goal here is not to turn you into a statistician. The goal is to give you a clear, honest, and practical understanding of what these tools actually do, what they can't do, and how to use them in ways that genuinely improve your decisions.
Whether you work in business, research, healthcare, policy, or any other field where data plays a role, the ideas in this book apply directly to your work. You don't need a mathematics degree to follow along. What you do need is a willingness to think carefully and to question assumptions, including the ones you've already formed about what statistics can tell you. That kind of thinking is exactly what this book is designed to build.
Why Statistical Thinking Matters in Your Decisions
Consider a scenario that plays out constantly in organizations of every size. A company runs an experiment: they show two versions of a webpage to different groups of visitors and measure which version generates more sign-ups. Version B gets a 12% higher conversion rate than Version A. The team runs a statistical test, gets a p-value of 0.04, and declares the result significant. They roll out Version B to all users. Six months later, the improvement has vanished. What went wrong? The answer almost always involves a misunderstanding of what the statistical test was actually measuring and what it was not.
This kind of story is not rare. It's the norm. A landmark analysis published in PLOS ONE found that a substantial proportion of published scientific studies with statistically significant results fail to replicate when other researchers attempt to reproduce them.[1] The same problem exists in business analytics, clinical research, and policy evaluation. The tools are being used, but they're often being used incorrectly, and the cost is real: wasted resources, missed opportunities, and decisions built on shaky foundations.
Statistical thinking is not just about running tests. It's a mindset that helps you ask better questions before you collect data, interpret results more honestly when you have them, and communicate findings in ways that don't mislead your audience or yourself. It means understanding that data always contains uncertainty, and that the job of statistical analysis is to quantify that uncertainty rather than eliminate it. When you develop this mindset, you become a more effective analyst, a more critical consumer of research, and a more reliable decision-maker.
The stakes are higher than most people realize. In healthcare, misinterpreted clinical trial results can influence treatment decisions that affect patient outcomes. In business, acting on false positives from poorly designed A/B tests wastes engineering and marketing resources while potentially degrading the user experience. In public policy, programs get funded or defunded based on studies that may not hold up under scrutiny. Statistical literacy is not a niche technical skill. It is a core competency for anyone who wants to make good decisions in a data-rich world.
The encouraging news is that the core concepts are not as complicated as they might seem. The confusion around statistics often comes not from the mathematics itself but from the language used to describe it. Terms like "significance," "confidence," and "probability" have precise technical meanings that differ from their everyday usage, and that gap in meaning is where most misunderstandings take root. Once you understand what these terms actually mean, a lot of the mystery dissolves and the logic becomes surprisingly intuitive.
You don't need to master every statistical technique to benefit from statistical thinking. What matters most is understanding the principles: how uncertainty works, what a hypothesis test is actually doing, why sample size matters, and how to tell the difference between a finding that's statistically significant and one that's actually meaningful. These principles apply across virtually every domain where data is used to inform decisions, and they are exactly what this book is built around.
A useful way to think about it: Statistical significance testing is not a machine that produces truth. It's a tool that helps you evaluate how surprised you should be by your data, given a specific assumption about the world. Understanding that distinction changes everything about how you use and interpret the results.
One of the most important shifts this book will help you make is moving from a binary view of results to a more nuanced one. The habit of labeling findings as simply "significant" or "not significant" is deeply ingrained, but it's also deeply misleading. Real-world decisions require you to think about the size of an effect, the quality of the data, the plausibility of the hypothesis, and the costs of being wrong in either direction. Statistical testing is one input into that judgment, not the final word.
What You'll Learn in This Book
This book is organized to build your understanding progressively, starting with the foundational concepts and moving toward practical application. Each chapter addresses a specific aspect of statistical significance testing, and together they form a complete picture of how to use these tools wisely. Here's a clear map of what each part of the book covers and why it matters.
Chapters 1 and 2 lay the groundwork. Chapter 1 explains what statistical significance actually means, starting with the fundamental challenge of separating real patterns from random variation. You'll learn what a null hypothesis is, why it's the starting point for any statistical test, and how the concept of significance is defined in precise terms. Chapter 2 digs into p-values, which are probably the most misunderstood concept in all of applied statistics. You'll learn what a p-value actually measures, what it does not measure, and the five most common mistakes people make when they interpret one.
Chapters 3 and 4 expand the picture beyond p-values. Chapter 3 introduces effect size, which is the measure of how large or meaningful a difference actually is, and explains why a statistically significant result can still be practically useless. You'll also learn how sample size interacts with significance in ways that can make tiny, irrelevant differences look impressive. Chapter 4 covers confidence intervals, which are a more informative way to express uncertainty than a single p-value. You'll learn how to read them, how to use them in decision-making, and why many statisticians prefer them over p-values alone.
Chapter 5 is one of the most practically important chapters in the book. It covers the common pitfalls that lead smart, well-intentioned people to draw false conclusions from their data. These include:
- P-hacking: Running multiple analyses until a significant result appears
- The multiple comparisons problem: Testing many hypotheses simultaneously without adjusting for the increased risk of false positives
- Publication bias: The tendency for positive results to get published while negative results disappear into file drawers
- Stopping rules and selective reporting: Ending a study early or reporting only favorable outcomes
Chapters 6 and 7 shift from diagnosis to design. Chapter 6 covers how to set up a statistical test correctly from the beginning, including how to formulate a clear hypothesis, how to plan your sample size using power analysis, and why preregistering your analysis plan before you collect data is one of the most effective ways to protect the integrity of your results. Chapter 7 provides a practical guide to choosing the right statistical test for your situation, covering the most commonly used tests and the assumptions that need to be met for each one to produce valid results.
Chapters 8 and 9 bring everything together in real-world contexts. Chapter 8 walks through specific applications in business analytics, research evaluation, and personal decision-making, showing how the principles from earlier chapters play out in practice. Chapter 9 focuses on building the kind of statistical intuition that lets you quickly assess claims, ask the right questions, and develop a healthy skepticism about data-driven arguments. It also points you toward resources for continuing to deepen your understanding after you finish this book.
By the time you reach the conclusion, you will have a solid, practical grasp of statistical significance testing that goes well beyond the surface-level understanding most people carry around. More importantly, you'll have a framework for thinking about evidence and uncertainty that will serve you in virtually every analytical situation you encounter. The specific techniques matter, but the thinking habits matter even more.
A few things this book deliberately does not do. It does not try to cover every statistical method in existence. It does not assume you have a background in mathematics beyond basic arithmetic and some familiarity with percentages and averages. And it does not pretend that statistics is a simple subject that can be reduced to a few rules of thumb. What it does is give you the conceptual foundation and practical tools to engage with statistical evidence seriously and confidently.
How to Use This Book for Maximum Benefit
This book is designed to be read from beginning to end, at least the first time through. The chapters build on each other in a deliberate sequence. Concepts introduced early reappear in later chapters with added depth, and the pitfalls covered in Chapter 5 will make much more sense once you've worked through the foundational material in Chapters 1 through 4. Jumping ahead is possible, but you'll get more out of each chapter if you've read the ones before it.
That said, once you've read the book once, it works well as a reference. Each chapter is self-contained enough that you can return to a specific section when you need a refresher. If you're about to run an A/B test, revisit Chapter 6 on experimental design. If you're evaluating a published study, Chapter 8 on research evaluation will be directly useful. The glossary at the back of the book provides quick definitions of all the key terms, which is handy when you encounter a concept in the wild and want to check your understanding.
The most important thing you can do to get value from this book is to connect the concepts to your own work as you read. Every chapter includes concrete examples and scenarios, but the real learning happens when you start applying the ideas to situations you actually face. As you read about p-values, think about the last time you saw a p-value in a report or presentation. As you read about effect size, think about a decision you made based on a percentage improvement. That kind of active engagement accelerates understanding far more than passive reading.
Here are some specific practices that will help you get the most out of each chapter:
- Pause at examples: When a concrete example appears, take a moment to make sure you understand it before moving on. If something doesn't click, re-read the preceding explanation rather than pushing forward.
- Apply the questions: Each chapter raises questions you can ask about data and evidence. Write them down and bring them to your next meeting, report review, or data analysis session.
- Challenge your assumptions: If a concept contradicts something you thought you knew about statistics, sit with that discomfort. Those moments of friction are often where the most valuable learning happens.
- Discuss with colleagues: Statistical thinking improves dramatically when you talk through ideas with others. If you work with a team that uses data, share what you're learning and invite pushback.
You don't need any special software or tools to follow along with this book. The concepts are explained in plain language with numerical examples that you can follow using nothing more than a calculator or a spreadsheet. For readers who want to go further and actually run statistical tests, the Further Reading section at the end of the book points to resources for learning statistical software like R and Python, as well as more advanced texts on specific methods.
It's also worth being honest about what this book will and won't do for your confidence level. After reading it, you will understand statistical significance testing well enough to use it thoughtfully, evaluate others' use of it critically, and avoid the most common and costly mistakes. You will not be an expert statistician. For complex analyses in high-stakes situations, consulting with a trained statistician is still the right call. But you will be a much more informed collaborator and a much sharper evaluator of the results they produce.
One mindset shift that will serve you throughout the book: try to approach statistics as a tool for managing uncertainty rather than eliminating it. Many people come to statistical testing hoping it will give them definitive answers. It won't, and that's not a flaw. The world is genuinely uncertain, and the honest job of statistics is to help you make better decisions in the face of that uncertainty, not to pretend it doesn't exist. The sooner you embrace that framing, the more useful everything in this book will become.
A practical starting point: Before you begin Chapter 1, think of one recent decision you made or observed that was influenced by data or a statistical claim. Keep that example in mind as you read. By the time you finish the book, you'll likely see that decision very differently, and that shift in perspective is exactly the point.
Statistics has a reputation for being dry, intimidating, and inaccessible. That reputation is not entirely undeserved, but it's also not inevitable. The ideas at the heart of statistical significance testing are genuinely interesting once you see them clearly. They connect to deep questions about how we know what we know, how we distinguish signal from noise in a complex world, and how we make good decisions when certainty is out of reach. Those are questions worth taking seriously, and this book is your guide to doing exactly that.
Notes
Introduction
- 1. Open Science Collaboration, "Estimating the reproducibility of psychological science," Scienceaac4716, 2015
This is the end of the free sample. The full book has 9 chapters.
Want this book written for you?
Tell us your goals and background, and get your own version of this book, tailored by AI to you.


Benefits of AI-tailored books
- Read one book, not ten:
- all the Statistics knowledge you need, gathered into a single book.
- Save days of learning:
- tell us your goals, choose your topics, and the whole book is built around them.
- Learn effortlessly:
- Statistics book written for your specific background and expertise.
- Understand at a glance:
- includes charts, tables, timelines, checklists, decision trees, and more.
- Stay current:
- written the day you order it, not years ago.
- Trust what you read:
- every book is checked for accuracy, with real research when your subject needs it.
Create your unique book in 3 steps
- 1. Select your focus
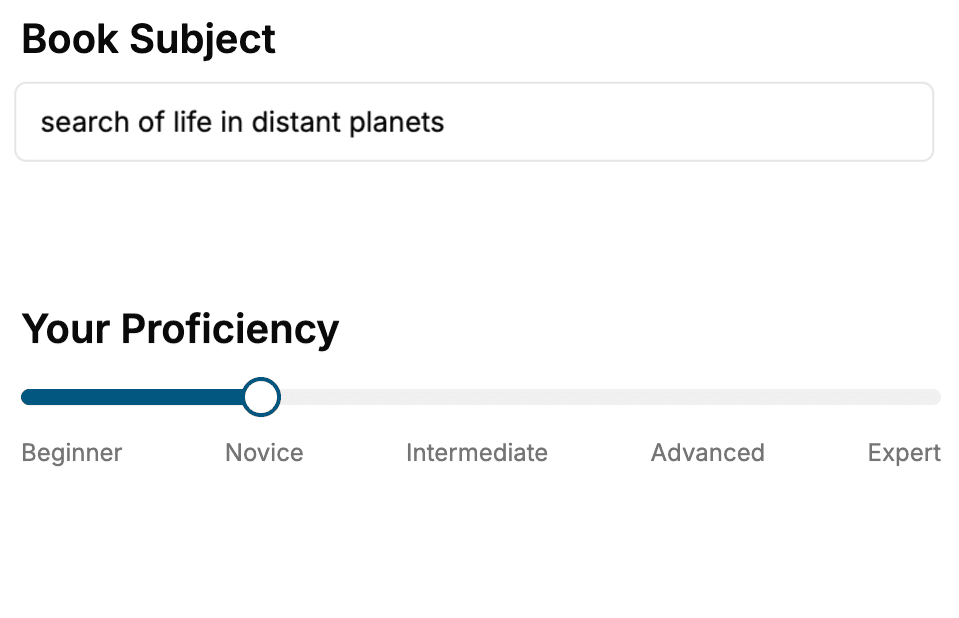
Select the focus of your Statistics book and share your background
- 2. Personalize your book
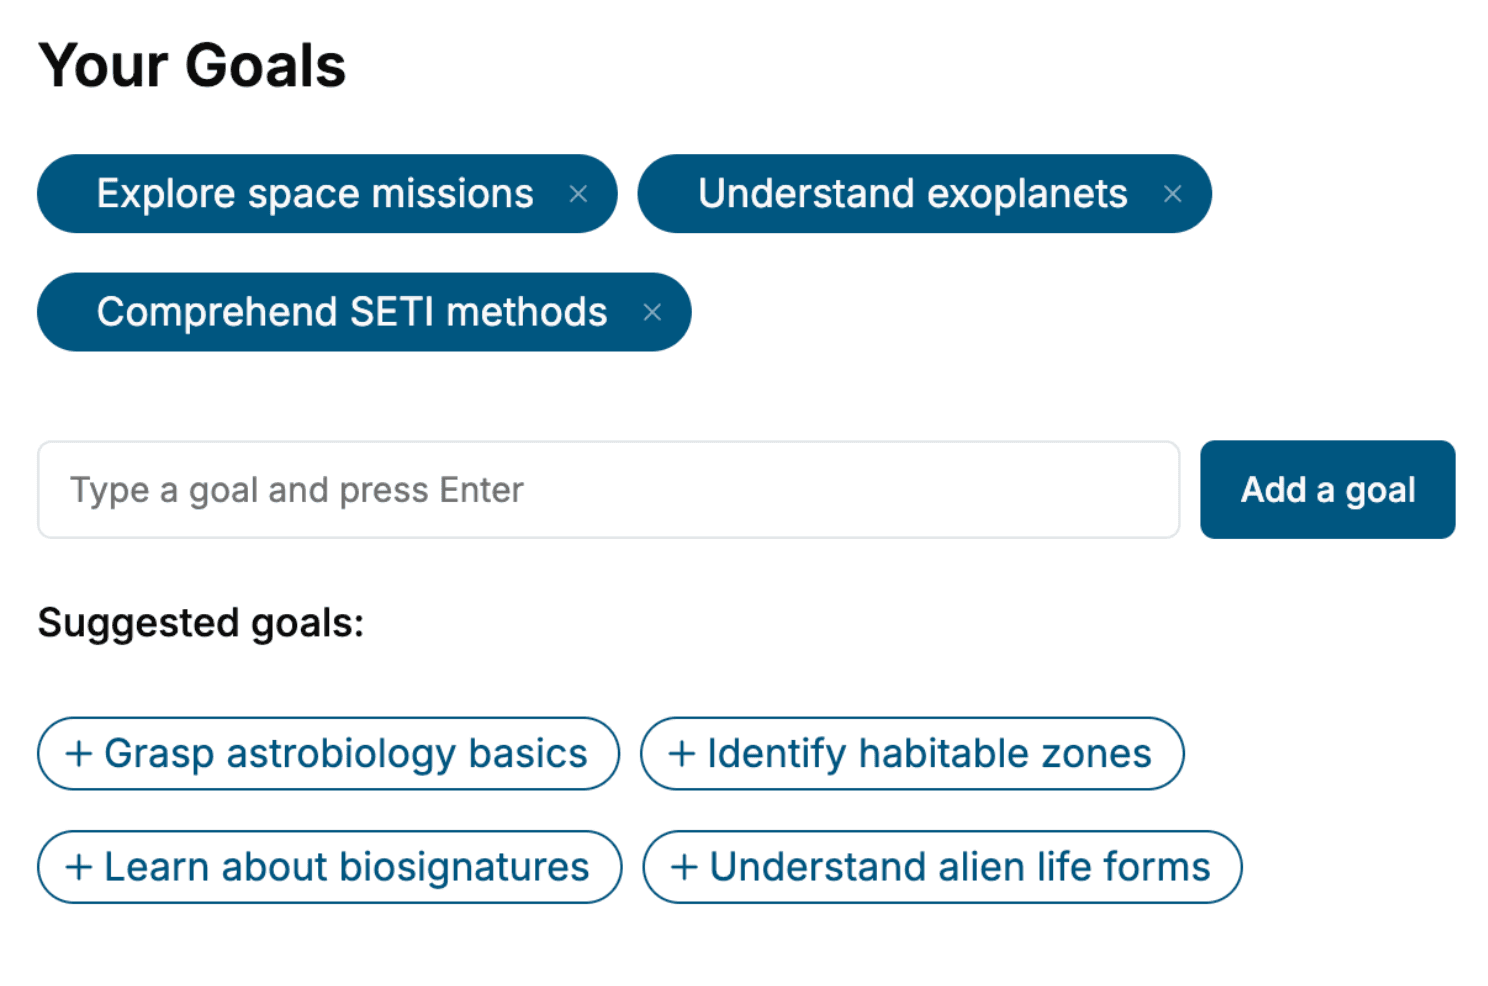
Specify your goals and choose sub-topics to include
- 3. Get your tailored book
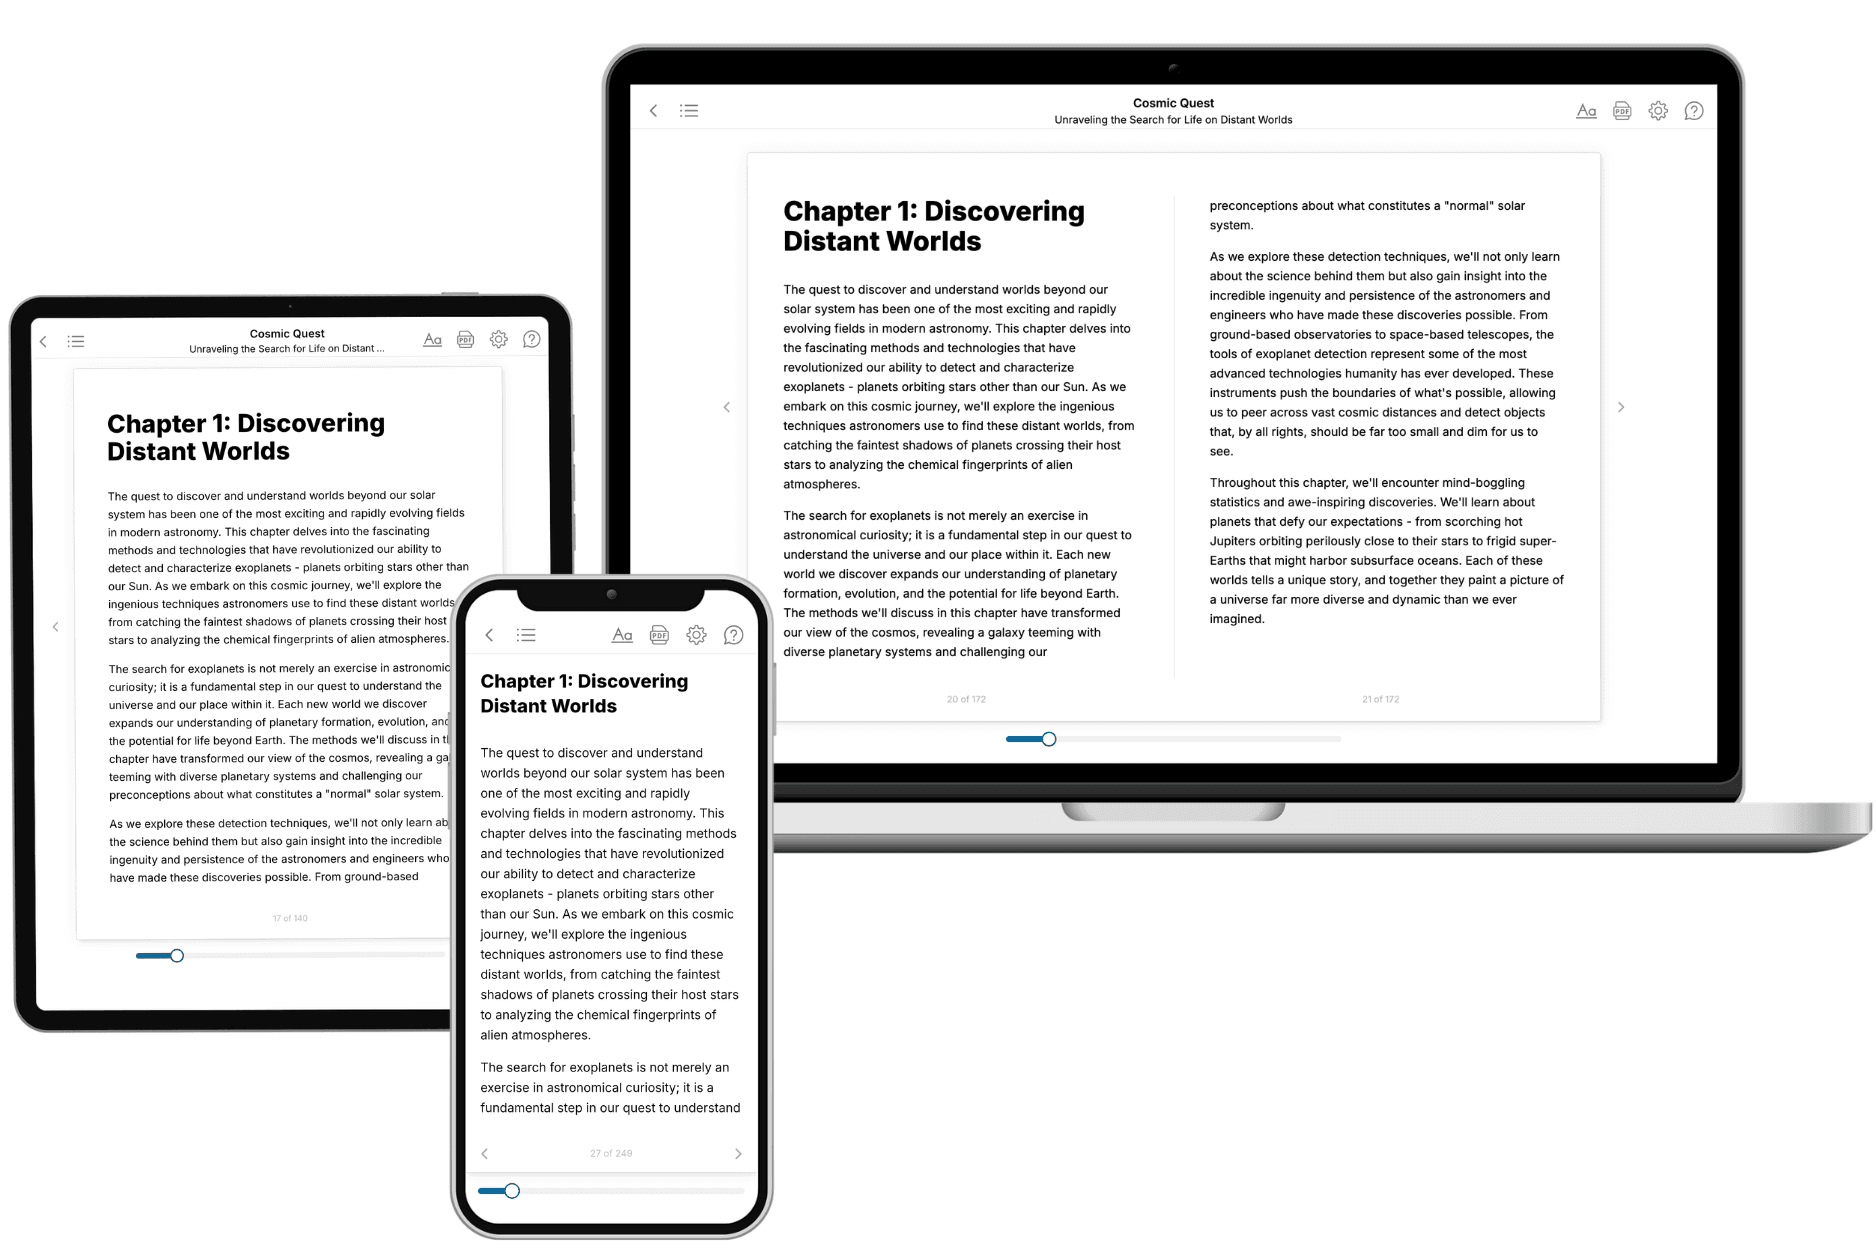
Your book is ready in 10 minutes. Read it online, download as EPUB or PDF, or send to Kindle.
Frequently asked questions
- What is TailoredRead?
TailoredRead creates complete, full-length nonfiction ebooks, written specifically for you. Tell us what you want to learn and why, and TailoredRead writes you a complete ebook on it, with charts, tables, and diagrams throughout. Read it online, on Kindle, or on any e-reader, or download it as a PDF or EPUB. Every book is written fresh the day you order it.
- How is the book tailored to me?
Before anything is written, you answer a few short questions about your goals, your background, and the topics you care about. Your book is then planned around your answers: written at your level, focused on your goals, and covering the topics you chose, instead of the one-size-fits-all book a store sells everyone.
- Will it read like generic AI content?
No. Your book isn't a chat transcript: it's planned chapter by chapter before a single word is written, told in a clear book voice, and explains ideas visually with charts, tables, and diagrams. After writing, every book goes through an editorial pass that polishes chapters so the book reads consistent from start to finish. Judge for yourself: browse thousands of sample books on our Explore Books page.
- How accurate is the content?
Our AI first checks whether your subject needs live research. Niche and fast-moving subjects are researched before writing, and the book plan and chapters are grounded in what it finds. After writing, every book goes through a quality pass that checks its facts and consistency, and researched books list their sources in a Notes section at the back.
- How long is the book?
You choose the length: Comprehensive (250-300 pages), Detailed (150-200 pages), Essential (70-100 pages), or Short (30-50 pages).
- Does the book include visuals?
Yes. Every book includes charts, tables, and diagrams: timelines, checklists, step-by-step guides, decision trees, comparison tables, matrices, and bar charts. A typical book includes dozens of these visual elements.
- Can I read it on Kindle? What formats can I download?
Yes. Every book can be read in our online reader or downloaded as a PDF or EPUB. The EPUB can be opened with Kindle, Apple Books, Kobo, and any e-reader. The Commercial and Author licenses also include an editable Word (DOCX) and Markdown download.
- How much does it cost?
About the price of a regular ebook. The exact price depends on your book's length and complexity, from $2 for the shortest books to $35 for the most comprehensive, and it's shown when you review your book, before you commit to anything. Each book is a one-time purchase, yours to keep, no subscription. Licenses that let you share, teach, or publish your book range from $35.99 to $49.99.
- Can I preview the book before purchasing?
Before you pay, you'll see what your book will cover: the title, a detailed description, the estimated length, and the complete chapter-by-chapter table of contents, so you know what you're getting before you decide. The full text itself is written after you purchase.
- How long does it take to create a book?
About 10 minutes. You can start reading the opening chapters while the rest is still being written.