Beyond the Line
Mastering Linear and Multiple Regression Through Statistical Rigor and Algorithmic Thinking
You're about to move beyond surface-level understanding of regression analysis into the deeper mechanics that separate competent practitioners from true experts.
253 pages12 chaptersOct 29, 2025Statistics
About this book
This book bridges three critical domains: the statistical foundations that ensure your results are meaningful, the algorithmic implementations that make regression computationally feasible, and the practical considerations that determine success in real-world applications. You'll discover why certain regression assumptions matter more than others, how computers actually solve regression problems under the hood, and what statistical significance truly means in the context of your models. Through clear explanations and concrete examples, you'll learn to navigate the complexities of multiple regression—from handling correlated predictors to interpreting interaction effects—while understanding the computational trade-offs involved in different algorithmic approaches. Whether you're building predictive models, conducting research, or making data-driven decisions, this book provides the depth of understanding needed to apply regression techniques with confidence and rigor. You'll gain the analytical framework to diagnose problems, optimize implementations, and communicate results effectively.
Table of contents
- IntroductionWhy Regression Analysis Matters, The Statistical, Computational, and Practical Perspectives, How to Use This BookRead below
- Chapter 1: Foundations of Linear RegressionThe Simple Linear Model, The Least Squares Criterion, Geometric Interpretation of Regression, Fitting the Line: Deriving the Solution
- Chapter 2: Statistical Inference in RegressionProbability and Random Variables in Regression, Sampling Distributions of Estimators, Hypothesis Testing for Regression Coefficients, Confidence Intervals and Prediction Intervals
- Chapter 3: Understanding Statistical SignificanceWhat P-Values Really Tell You, Choosing Significance Levels and Type I/II Errors, Statistical Versus Practical Significance, The Multiple Testing Problem
- Chapter 4: Regression Assumptions and DiagnosticsThe Four Core Assumptions, Residual Analysis and Diagnostic Plots, Detecting and Addressing Assumption Violations, Outliers, Leverage, and Influential Points
- Chapter 5: Multiple Regression FundamentalsExtending to Multiple Predictors, Matrix Formulation of Multiple Regression, Interpreting Coefficients in Multiple Regression, Partial Relationships and Controlling for Variables
- Chapter 6: Multicollinearity and Variable InteractionsUnderstanding Multicollinearity, Detecting and Measuring Multicollinearity, Strategies for Handling Multicollinearity, Modeling Interaction Effects
- Chapter 7: Model Evaluation and SelectionMeasures of Goodness of Fit, Adjusted R-Squared and Information Criteria, Cross-Validation Techniques, Comparing and Selecting Models
- Chapter 8: Computational Algorithms for RegressionThe Normal Equations Approach, QR Decomposition and SVD Methods, Gradient Descent and Iterative Methods, Numerical Stability and Precision
- Chapter 9: Computational Complexity and ScalabilityTime Complexity of Regression Algorithms, Memory Requirements and Space Complexity, Approaches for Large-Scale Regression
- Chapter 10: Feature Engineering and Variable SelectionVariable Transformations and Scaling, Polynomial and Nonlinear Features, Variable Selection Methods, Regularization: Ridge and Lasso Regression
- Chapter 11: Advanced Topics and ExtensionsWeighted Least Squares, Robust Regression Methods, Handling Categorical Predictors, Dealing with Missing Data
- Chapter 12: Practical Implementation and Best PracticesA Complete Regression Analysis Workflow, Software Tools and Libraries, Reporting and Communicating Results, Common Pitfalls and How to Avoid Them
- ConclusionKey Takeaways, Continuing Your Journey
- Further Reading
- Glossary
Introduction
Regression analysis stands as one of the most widely applied statistical techniques across virtually every quantitative field, yet many practitioners operate with an incomplete understanding of its foundations. You might run regression models regularly, interpret coefficients, and check p-values, but do you truly understand what happens beneath the surface? Can you explain why certain algorithmic approaches are preferred for large datasets, or what statistical significance actually means in probabilistic terms? This book exists to fill that gap—to transform your working knowledge into deep, rigorous understanding that enables you to apply regression techniques with genuine confidence and expertise.
The challenge with regression analysis is that it sits at the intersection of three distinct domains: statistical theory, computational algorithms, and practical application. Most resources emphasize one perspective while neglecting the others. Statistics textbooks focus on hypothesis testing and inference but treat computation as a black box. Computer science resources explain algorithms without adequate attention to statistical validity. Practical guides offer recipes without explaining why certain approaches work or when they might fail. This fragmented landscape leaves you with partial understanding—enough to be dangerous, but not enough to be truly effective.
This book takes a different approach by deliberately integrating all three perspectives throughout. You'll learn not just how to fit a regression model, but why the least squares criterion makes mathematical sense, how computers actually solve the optimization problem, and what assumptions must hold for your results to be trustworthy. You'll discover that understanding the algorithmic implementation deepens your statistical intuition, and that grasping the statistical foundations helps you make better computational choices. This integrated perspective transforms regression from a collection of disconnected techniques into a coherent framework you can apply with genuine mastery.
The journey ahead requires some mathematical maturity, but not advanced expertise. You should be comfortable with basic algebra, understand fundamental probability concepts, and have some exposure to regression analysis already. This isn't an introductory text—it's designed for practitioners who want to move beyond surface-level application into deeper understanding. You'll encounter equations and derivations, but always with clear explanations of what they mean and why they matter. The goal isn't mathematical sophistication for its own sake, but rather the kind of rigorous understanding that makes you a more effective practitioner.
Why Regression Analysis Matters
Regression analysis appears everywhere in modern quantitative work, often in places you might not immediately recognize. When economists forecast GDP growth based on employment figures and interest rates, they're using regression. When medical researchers determine whether a new drug reduces blood pressure while controlling for age and weight, they're using regression. When tech companies predict user engagement based on dozens of behavioral features, they're using regression—often as a baseline before trying more complex methods. The ubiquity of regression stems from its ability to quantify relationships between variables while accounting for uncertainty, making it indispensable for both prediction and causal inference.
Consider a concrete example from healthcare analytics. A hospital system wants to predict patient readmission risk within thirty days of discharge. They have data on thousands of patients including age, diagnosis codes, length of stay, number of previous admissions, and various lab results. A multiple regression model can quantify how each factor relates to readmission probability while controlling for the others. The model might reveal that previous admissions strongly predict readmission even after accounting for disease severity, suggesting that care coordination matters. This insight drives practical interventions—perhaps enhanced follow-up for high-risk patients. The regression model serves dual purposes: making predictions for individual patients and revealing patterns that inform systemic improvements.
The power of regression extends beyond simple prediction to understanding complex relationships in data. Unlike black-box machine learning methods, regression models offer interpretability—you can examine coefficients and understand how each predictor relates to the outcome. This interpretability makes regression invaluable when you need to explain your findings to stakeholders, satisfy regulatory requirements, or generate scientific insights. A data scientist might achieve slightly better predictive accuracy with a neural network, but if they can't explain why the model makes certain predictions, that accuracy becomes less valuable in many real-world contexts.
Regression also serves as the foundation for more advanced statistical and machine learning techniques. Logistic regression extends linear regression to binary outcomes. Generalized linear models adapt the framework to various outcome distributions. Regularized regression methods like ridge and lasso connect to modern machine learning. Time series models often incorporate regression components. Understanding regression deeply provides a conceptual foundation that makes these extensions more accessible. You're not just learning one technique—you're building a framework that supports a much broader toolkit.
The practical importance of regression analysis has only grown with increasing data availability. Organizations now collect vast amounts of data and need methods to extract actionable insights. Regression provides a principled approach that balances flexibility with interpretability, statistical rigor with computational efficiency. However, this widespread application also means that regression is frequently misapplied. Models are fit without checking assumptions, p-values are misinterpreted, and algorithmic choices are made without understanding their implications. The cost of these mistakes ranges from wasted resources to actively harmful decisions based on flawed analysis.
Mastering regression analysis means understanding not just how to fit models, but when regression is appropriate, what can go wrong, and how to diagnose and address problems. It means recognizing that statistical significance doesn't imply practical importance, that correlation doesn't establish causation, and that model assumptions aren't mere formalities but conditions that determine whether your results are trustworthy. This deeper understanding separates competent practitioners who can follow procedures from experts who can navigate complex analytical challenges and deliver reliable insights.
The investment in truly understanding regression pays dividends throughout your career. Whether you work in data science, research, business analytics, or any quantitative field, regression will remain relevant. Technologies change, specific tools come and go, but the fundamental principles of quantifying relationships while accounting for uncertainty remain constant. By building a solid foundation now, you equip yourself with knowledge that compounds over time rather than becoming obsolete. This book aims to provide that foundation—not just teaching you what to do, but helping you understand why it works and when it doesn't.
The Statistical, Computational, and Practical Perspectives
The statistical perspective on regression focuses on inference—drawing conclusions about populations from samples while quantifying uncertainty. When you fit a regression model to data, you're not just finding a line that fits those specific observations. You're estimating parameters of an underlying relationship that exists in a broader population, and you need to understand how much uncertainty surrounds those estimates. This perspective emphasizes probability distributions, sampling variability, hypothesis tests, and confidence intervals. It asks questions like: Could the observed relationship have occurred by chance? How confident can we be in our coefficient estimates? What assumptions must hold for our inference to be valid?
Understanding the statistical foundations means grasping that your data represents one possible sample from a larger population or data-generating process. If you collected different data, you'd get different coefficient estimates—this is sampling variability. The statistical framework provides tools to quantify this variability and make probabilistic statements about the true underlying relationships. For example, when you see a confidence interval of [0.3, 0.7] for a regression coefficient, you're seeing a range that would contain the true parameter value in 95% of repeated samples (assuming your model assumptions hold). This probabilistic thinking is essential for honest interpretation of results.
The computational perspective examines how regression problems are actually solved by computers. When you call a regression function in your favorite software, what happens behind the scenes? The computer must solve an optimization problem—finding coefficient values that minimize the sum of squared residuals. Several algorithmic approaches exist, each with different computational properties. The normal equations provide a direct solution through matrix inversion, but can be numerically unstable. QR decomposition offers better numerical properties. Gradient descent works iteratively and scales well to large datasets. Understanding these algorithms helps you make informed choices about which methods to use in different situations.
Computational considerations become critical when working with large datasets or high-dimensional problems. The standard approach to regression has computational complexity of O(n·p²) where n is the number of observations and p is the number of predictors. This means that doubling the number of predictors roughly quadruples the computation time. For problems with thousands of predictors, this becomes prohibitive. Alternative approaches like stochastic gradient descent or specialized algorithms for sparse problems become necessary. Understanding computational complexity helps you anticipate when standard methods will struggle and what alternatives exist.
Numerical stability represents another crucial computational consideration. Computers represent numbers with finite precision, which can lead to rounding errors that accumulate during calculations. Some algorithmic approaches are more susceptible to these errors than others. For example, computing the normal equations requires forming the matrix X'X, which can amplify numerical errors when predictors are highly correlated. QR decomposition avoids this problem by working directly with the original data matrix. These might seem like technical details, but they determine whether your software produces accurate results or numerical garbage.
The practical perspective focuses on the entire workflow of regression analysis in real-world contexts. This includes data preparation, exploratory analysis, model specification, assumption checking, interpretation, and communication of results. It addresses questions that statistical theory and computational algorithms don't answer: How do you handle missing data? What do you do when assumptions are violated? How do you choose which variables to include? How do you explain your findings to non-technical stakeholders? The practical perspective recognizes that technical correctness is necessary but not sufficient—your analysis must also be relevant, interpretable, and actionable.
Consider the practical challenge of multicollinearity—when predictor variables are highly correlated with each other. Statistically, multicollinearity doesn't bias coefficient estimates, but it inflates their standard errors, making individual coefficients unreliable even though predictions may be fine. Computationally, multicollinearity can cause numerical instability in matrix inversion. Practically, it makes interpretation difficult because you can't cleanly separate the effects of correlated predictors. Addressing multicollinearity requires understanding all three perspectives: recognizing the statistical implications, knowing which computational approaches are more robust, and making practical decisions about variable selection or regularization.
This book deliberately integrates these three perspectives because they reinforce each other. Understanding the statistical foundations helps you make better computational choices—for instance, knowing that coefficient estimates are normally distributed under certain assumptions explains why some algorithms focus on computing standard errors efficiently. Understanding computational algorithms deepens your statistical intuition—seeing how gradient descent iteratively minimizes the loss function provides geometric insight into what regression actually does. And practical experience reveals which theoretical concerns matter most in real applications and which are primarily academic. The synthesis of these perspectives creates understanding that's greater than the sum of its parts.
How to Use This Book
This book is structured to build understanding progressively, with each chapter laying groundwork for subsequent material. The early chapters establish foundations—what linear regression is, how the least squares criterion works, and how to interpret basic results. Middle chapters deepen your understanding of statistical inference, model assumptions, and multiple regression. Later chapters address computational algorithms, advanced topics, and practical implementation. While you could jump directly to topics of immediate interest, you'll gain more by working through the material sequentially, as later chapters assume familiarity with earlier concepts.
Each chapter balances theory with application, providing mathematical derivations where they illuminate understanding but always connecting abstract concepts to concrete examples. You'll encounter equations and formulas—these aren't obstacles to skip over but tools for precise thinking. Take time to work through the mathematical reasoning, even if you don't memorize every formula. The goal is conceptual understanding, not rote memorization. When you see a derivation, ask yourself what it reveals about the underlying relationships and why the result makes intuitive sense. This active engagement transforms equations from intimidating symbols into meaningful insights.
The book includes numerous examples drawn from various domains—healthcare, economics, technology, and social sciences. These examples serve multiple purposes: illustrating concepts, demonstrating common pitfalls, and showing how different considerations interact in practice. Pay attention to these examples even if they're outside your primary field. The analytical challenges they illustrate—dealing with outliers, interpreting interaction effects, choosing between competing models—transcend specific domains. The example about predicting hospital readmissions teaches lessons applicable to predicting customer churn, equipment failure, or student performance.
You'll notice that the book emphasizes understanding over memorization of procedures. Rather than providing step-by-step recipes, it develops your ability to think through analytical problems. This approach requires more effort initially but pays larger dividends. When you encounter a new regression problem, you won't just follow a checklist—you'll understand what you're trying to accomplish, what could go wrong, and how to adapt your approach to the specific context. This deeper understanding makes you more effective and more adaptable as methods and tools evolve.
The computational sections include algorithmic descriptions and complexity analysis, but not implementation code in specific programming languages. This choice is deliberate—programming languages and libraries change, but algorithmic principles remain constant. Understanding how gradient descent works conceptually enables you to use it effectively in Python, R, Julia, or whatever language you prefer. The book focuses on the level of understanding that transfers across tools rather than the syntax details that don't. If you want to implement these algorithms yourself as a learning exercise, the conceptual descriptions provide sufficient foundation.
As you progress through the book, you'll encounter recurring themes that connect different chapters. The importance of assumptions appears in statistical inference, model diagnostics, and algorithm selection. The bias-variance tradeoff emerges in model evaluation, regularization, and variable selection. Computational efficiency matters for algorithm choice, large-scale applications, and practical implementation. These recurring themes aren't repetitive—each appearance adds new dimensions to your understanding. By the end, you'll see regression analysis as an integrated whole rather than a collection of disconnected techniques.
To get maximum value from this book, engage actively with the material. When you encounter a new concept, pause to consider how it relates to your existing knowledge. When you see an example, think about analogous situations in your own work. When a chapter describes a diagnostic technique, consider how you might apply it to a current project. This active processing transforms passive reading into genuine learning. You might also benefit from working through the concepts with actual data—applying techniques as you learn them reinforces understanding in ways that reading alone cannot achieve.
The book assumes you have some prior exposure to regression analysis and basic statistical concepts. You should be familiar with terms like coefficient, residual, and p-value, even if your understanding isn't deep. You should be comfortable with basic algebra and willing to engage with mathematical notation. You don't need advanced mathematics—calculus appears occasionally but isn't central, and linear algebra concepts are explained when needed. If you find certain sections challenging, that's normal and expected. The material requires thought and sometimes rereading. The investment of effort yields understanding that will serve you throughout your career.
Finally, remember that mastery comes through application, not just reading. This book provides the conceptual foundation and analytical framework, but you'll develop true expertise by applying these ideas to real problems. As you work through your own analyses, you'll encounter situations not explicitly covered in any book. Your deep understanding of principles will enable you to reason through these situations, make informed decisions, and continue learning. That's the ultimate goal—not just teaching you what's in these pages, but equipping you to go beyond them and handle whatever analytical challenges you encounter.
This is the end of the free sample. The full book has 12 chapters.
Want this book written for you?
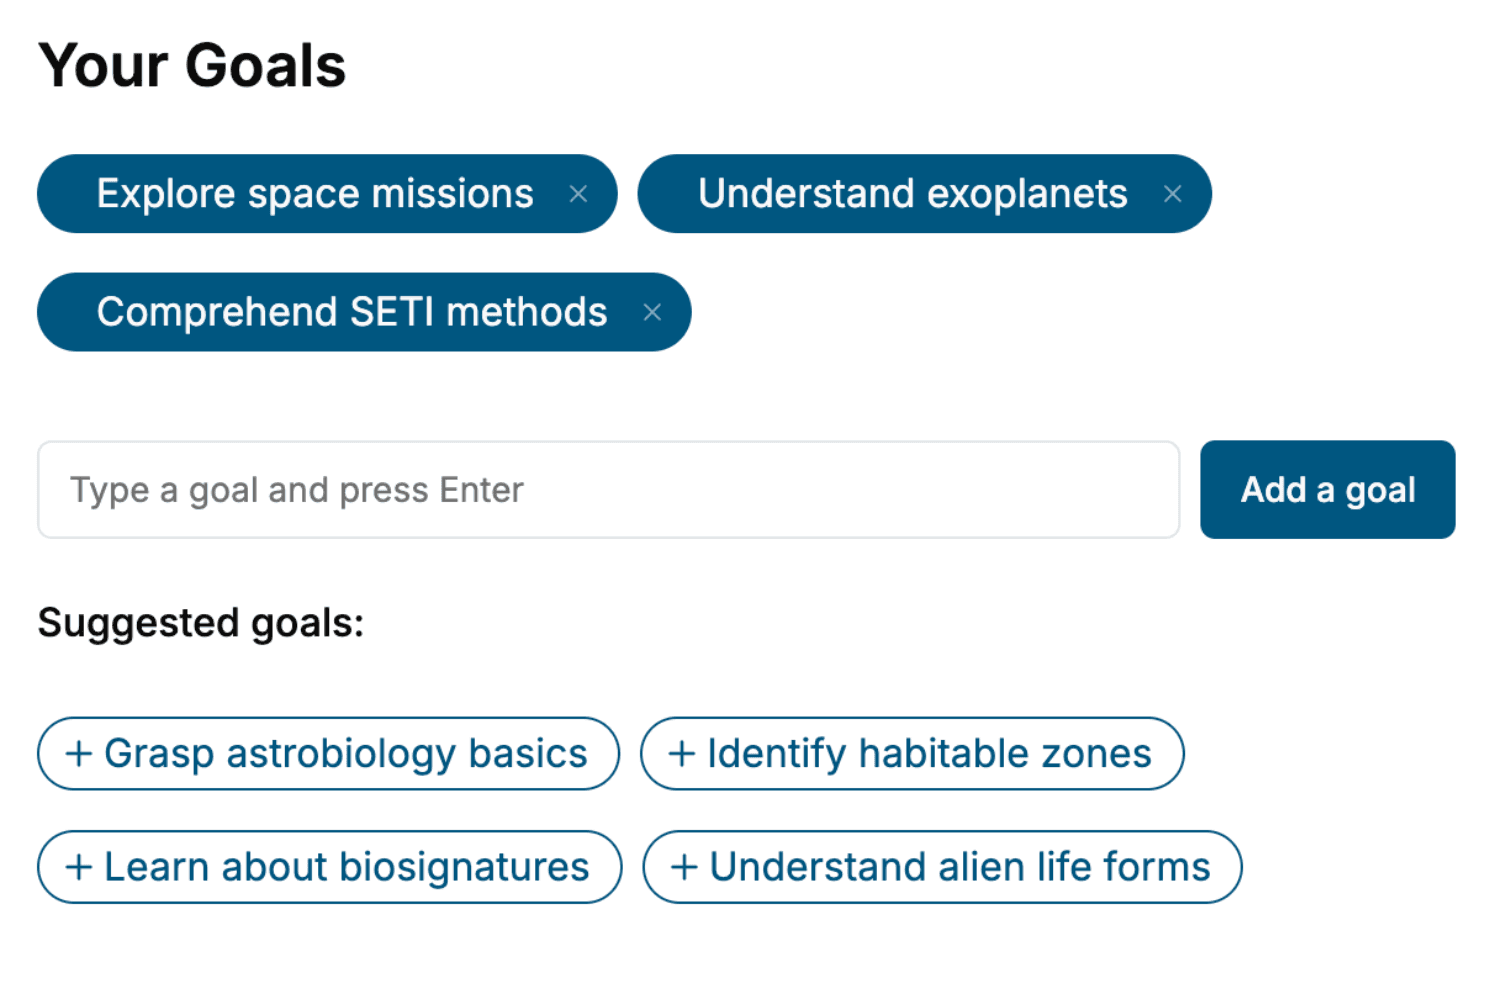
Tell us your goals and background, and get your own version of this book, tailored by AI to you.


Benefits of AI-tailored books
- Read one book, not ten:
- all the Statistics knowledge you need, gathered into a single book.
- Save days of learning:
- tell us your goals, choose your topics, and the whole book is built around them.
- Learn effortlessly:
- Statistics book written for your specific background and expertise.
- Understand at a glance:
- includes charts, tables, timelines, checklists, decision trees, and more.
- Stay current:
- written the day you order it, not years ago.
- Trust what you read:
- every book is checked for accuracy, with real research when your subject needs it.
Create your unique book in 3 steps
- 1. Select your focus
Select the focus of your Statistics book and share your background
- 2. Personalize your book
Specify your goals and choose sub-topics to include
- 3. Get your tailored book
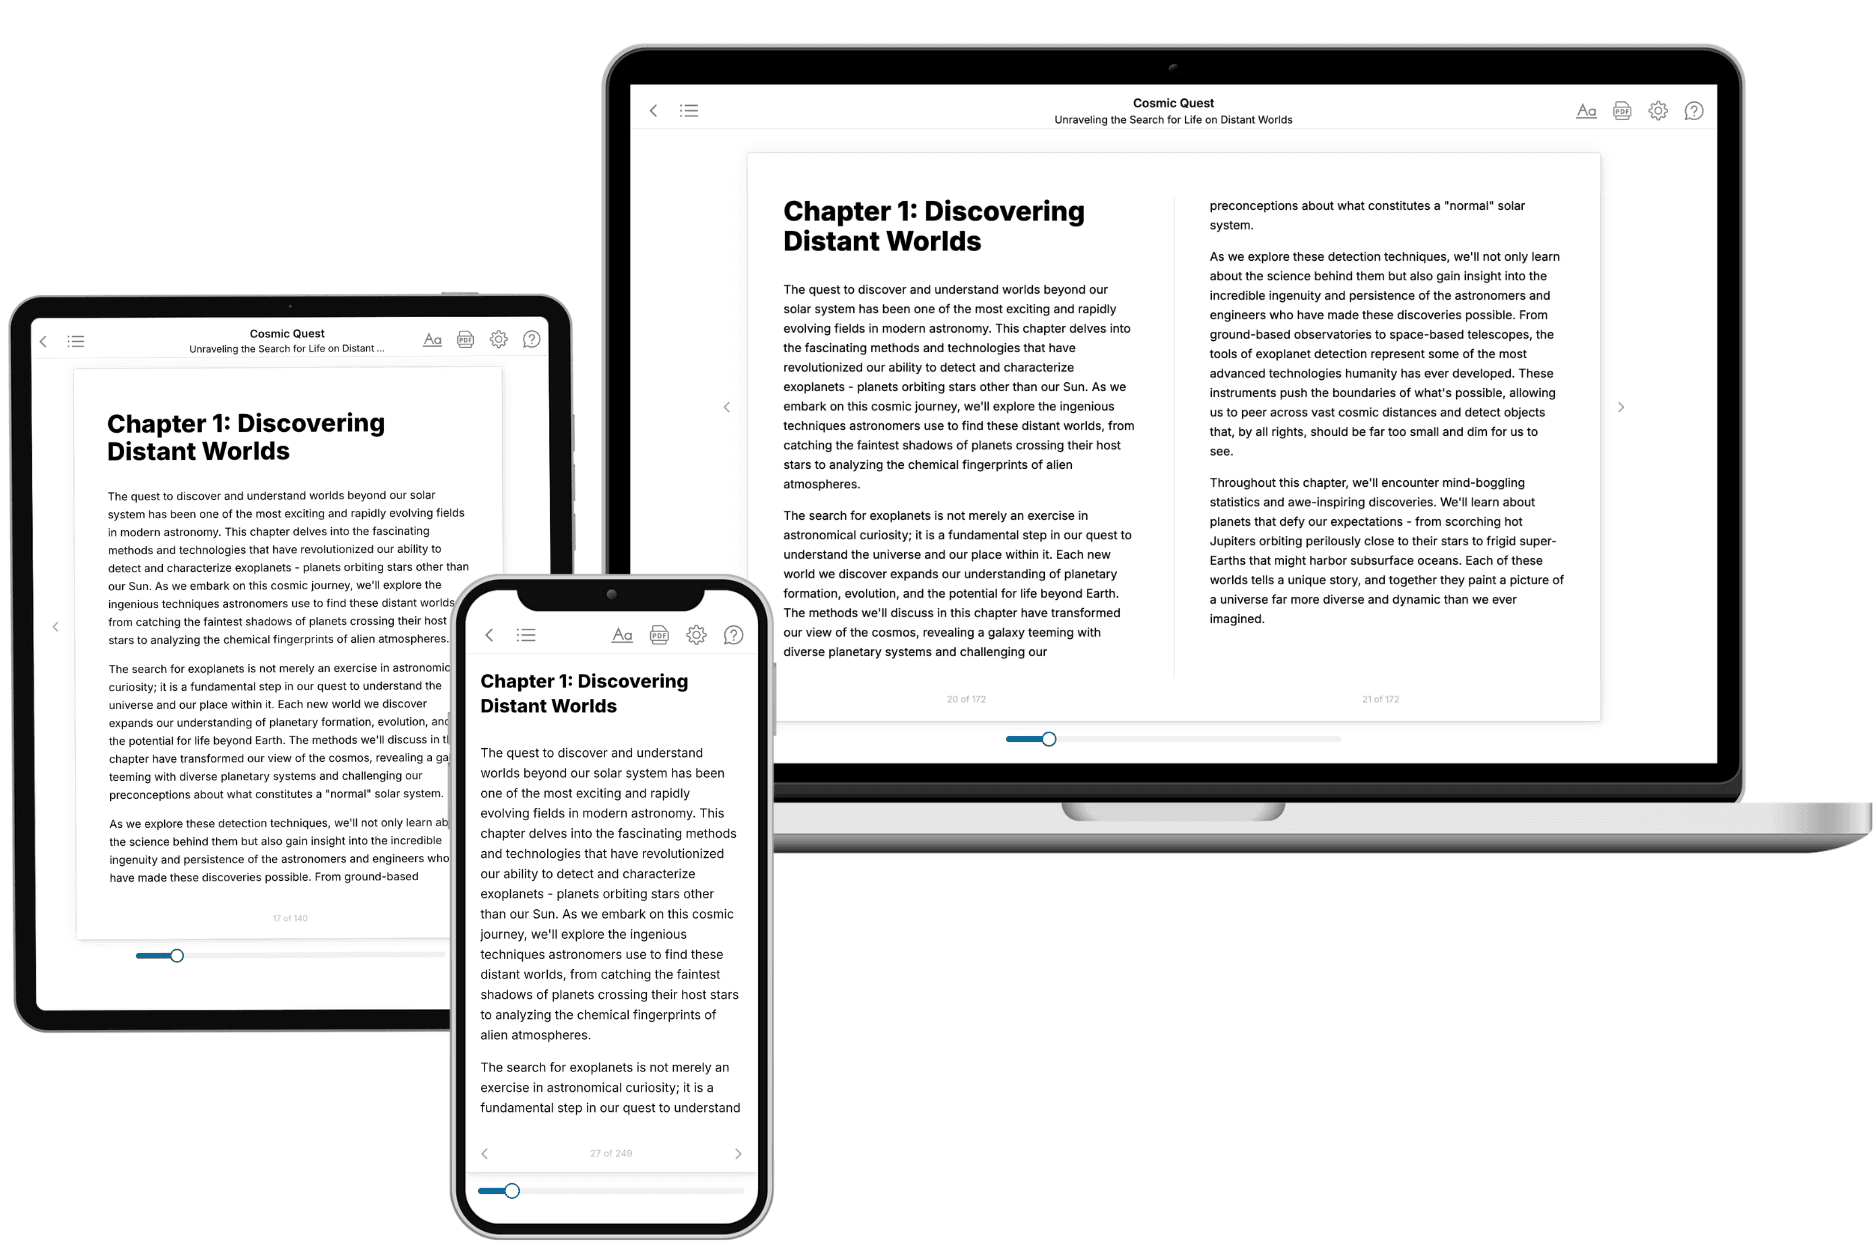
Your book is ready in 10 minutes. Read it online, download as EPUB or PDF, or send to Kindle.

Frequently asked questions
- What is TailoredRead?
TailoredRead creates complete, full-length nonfiction ebooks, written specifically for you. Tell us what you want to learn and why, and TailoredRead writes you a complete ebook on it, with charts, tables, and diagrams throughout. Read it online, on Kindle, or on any e-reader, or download it as a PDF or EPUB. Every book is written fresh the day you order it.
- How is the book tailored to me?
Before anything is written, you answer a few short questions about your goals, your background, and the topics you care about. Your book is then planned around your answers: written at your level, focused on your goals, and covering the topics you chose, instead of the one-size-fits-all book a store sells everyone.
- Will it read like generic AI content?
No. Your book isn't a chat transcript: it's planned chapter by chapter before a single word is written, told in a clear book voice, and explains ideas visually with charts, tables, and diagrams. After writing, every book goes through an editorial pass that polishes chapters so the book reads consistent from start to finish. Judge for yourself: browse thousands of sample books on our Explore Books page.
- How accurate is the content?
Our AI first checks whether your subject needs live research. Niche and fast-moving subjects are researched before writing, and the book plan and chapters are grounded in what it finds. After writing, every book goes through a quality pass that checks its facts and consistency, and researched books list their sources in a Notes section at the back.
- How long is the book?
You choose the length: Comprehensive (250-300 pages), Detailed (150-200 pages), Essential (70-100 pages), or Short (30-50 pages).
- Does the book include visuals?
Yes. Every book includes charts, tables, and diagrams: timelines, checklists, step-by-step guides, decision trees, comparison tables, matrices, and bar charts. A typical book includes dozens of these visual elements.
- Can I read it on Kindle? What formats can I download?
Yes. Every book can be read in our online reader or downloaded as a PDF or EPUB. The EPUB can be opened with Kindle, Apple Books, Kobo, and any e-reader. The Commercial and Author licenses also include an editable Word (DOCX) and Markdown download.
- How much does it cost?
About the price of a regular ebook. The exact price depends on your book's length and complexity, from $2 for the shortest books to $35 for the most comprehensive, and it's shown when you review your book, before you commit to anything. Each book is a one-time purchase, yours to keep, no subscription. Licenses that let you share, teach, or publish your book range from $35.99 to $49.99.
- Can I preview the book before purchasing?
Before you pay, you'll see what your book will cover: the title, a detailed description, the estimated length, and the complete chapter-by-chapter table of contents, so you know what you're getting before you decide. The full text itself is written after you purchase.
- How long does it take to create a book?
About 10 minutes. You can start reading the opening chapters while the rest is still being written.