Beyond the P-Value
Making Smarter Decisions Through Statistical Thinking
You've seen the phrase "statistically significant" countless times, but do you really understand what it means?
222 pages10 chaptersJun 8, 2026Statistics
About this book
Most people don't—and that's costing organizations millions in poor decisions, failed initiatives, and misallocated resources. The problem isn't that p-values are inherently flawed; it's that they're widely misunderstood and misused. This book cuts through the confusion and teaches you what p-values actually measure, why they're so often misinterpreted, and how to use them as part of a smarter decision-making framework. You'll discover how statistical significance differs from practical significance, learn to spot common analytical traps, and develop the critical thinking skills needed to evaluate evidence in your field. Whether you're in business, research, healthcare, or policy, this guide equips you with the knowledge to ask better questions, challenge questionable findings, and make decisions grounded in genuine statistical understanding rather than statistical theater.
Table of contents
- IntroductionWhy P-Value Literacy Matters Now, What You'll Learn in This Book, How to Use This GuideRead below
- Chapter 1: The Foundation: What P-Values Actually AreUnderstanding the Null Hypothesis, Probability, Not Proof: The Core Concept, How P-Values Are Calculated
- Chapter 2: The Great Misunderstanding: Common P-Value MythsMyth #1: P-Values Tell You the Probability Your Hypothesis Is True, Myth #2: A Significant P-Value Means Your Results Will Replicate, Myth #3: Statistical Significance Equals Real-World Importance, Myth #4: The 0.05 Threshold Is a Universal Truth
- Chapter 3: Statistical vs. Practical Significance: The Critical DistinctionDefining Practical Significance in Your Context, Why Effect Size Matters More Than You Think, Real-World Examples: When Significant Isn't Meaningful
- Chapter 4: The Replication Crisis: How P-Values Led Us AstrayP-Hacking and Data Dredging, Publication Bias and the File Drawer Problem, Understanding False Discovery Rates
- Chapter 5: Beyond P-Values: Confidence Intervals and Effect SizesWhat Confidence Intervals Actually Tell You, Interpreting and Reporting Effect Sizes, Sample Size, Statistical Power, and What They Mean
- Chapter 6: Context Is Everything: Sample Size, Study Design, and AssumptionsHow Sample Size Shapes P-Value Interpretation, Study Design and Its Impact on Validity, The Hidden Assumptions Behind Statistical Tests
- Chapter 7: Bayesian Thinking: An Alternative FrameworkBayesian Basics: Prior Beliefs and Posterior Updates, Frequentist vs. Bayesian: When to Use Each Approach, Applying Bayesian Thinking to Your Decisions
- Chapter 8: Analytical Decision-Making: Integrating Statistical EvidenceBuilding an Evidence Hierarchy for Your Field, Weighing Multiple Evidence Sources, Decision Frameworks That Incorporate Statistical Thinking
- Chapter 9: Spotting Red Flags: Recognizing Questionable Statistical ClaimsRed Flags in Research and Reports, How Media and Marketing Distort Statistical Findings, Critical Questions to Ask About Any Statistical Claim
- Chapter 10: Improving Your Organization: Pre-Registration, Transparency, and ReproducibilityPre-Registration and Pre-Specification of Analyses, Building Transparency Into Your Analytical Processes, Creating a Culture of Reproducibility
- Conclusion: Becoming a Statistical ThinkerKey Takeaways for Better Decision-Making, Your Next Steps
- Glossary of Statistical Terms
- Further Reading and Resources
Introduction
Picture this: a pharmaceutical company announces that its new drug produces a "statistically significant" improvement in patient outcomes. A tech startup reports that its redesigned homepage led to a "significant" increase in conversions. A policy researcher publishes findings showing a "significant" link between a social program and reduced poverty rates. In each case, the word "significant" carries enormous weight. Decisions get made, budgets get allocated, and headlines get written. But here's the uncomfortable truth: in many of these situations, the people making those decisions don't fully understand what "statistically significant" actually means, and neither do the people reporting the findings.
The p-value is one of the most widely used and most widely misunderstood tools in all of science and data analysis. It appears in medical journals, business reports, government policy documents, and news articles every single day. Yet study after study has shown that even trained researchers, experienced analysts, and seasoned professionals routinely misinterpret what a p-value tells them.[1] The consequences of this misunderstanding are not abstract. They show up as failed drug trials, wasted marketing budgets, ineffective public policies, and a scientific literature riddled with findings that cannot be reproduced.
This book is not an attack on p-values. They are legitimate, useful tools when applied correctly and interpreted honestly. The problem is not the tool itself but the gap between what p-values actually measure and what most people believe they measure. Closing that gap is what this book is about. Whether you work in business analytics, academic research, healthcare, public policy, or any field where data drives decisions, developing a clear and accurate understanding of statistical significance will make you a sharper thinker and a better decision-maker. That is a practical skill with real consequences, and it starts here.
The chapters ahead will take you from the foundational mechanics of p-values all the way through to advanced frameworks for integrating statistical evidence into real-world decisions. Along the way, you will encounter concrete examples, common traps to avoid, and actionable strategies you can apply immediately. The goal is not to turn you into a statistician. The goal is to give you the statistical literacy needed to ask better questions, challenge questionable claims, and make decisions grounded in genuine understanding rather than statistical theater.
Why P-Value Literacy Matters Now
We are living in an era of data abundance. Organizations collect more information than ever before, analytical tools have become cheaper and more accessible, and the pressure to make "data-driven" decisions has never been higher. On the surface, this sounds like progress. More data should mean better decisions. But there is a catch: having access to data and knowing how to interpret it correctly are two very different things. The explosion of data has also produced an explosion of statistical claims, and not all of them deserve the confidence they receive.
The replication crisis in science offers the starkest illustration of what happens when p-value misuse becomes widespread. In 2015, a landmark project attempted to reproduce 100 published psychology studies. Only about 36 to 39 percent of those studies produced results consistent with the original findings.[2] Similar problems have been documented in medicine, economics, and neuroscience. These are not obscure academic failures. They represent years of research effort, millions of dollars in funding, and in some cases, clinical or policy decisions made on the basis of findings that turned out to be unreliable.
The business world faces its own version of this problem. A/B testing has become standard practice in product development and marketing, but many organizations run these tests without adequate sample sizes, stop them early when results look promising, or test so many variations simultaneously that false positives become almost inevitable. The result is a steady stream of "winning" experiments that fail to deliver real improvements when implemented at scale. Teams celebrate statistical significance without ever asking whether the effect they found is large enough to matter in practice.
Healthcare decisions carry even higher stakes. Patients and clinicians rely on published research to guide treatment choices. When a study reports that a medication is significantly more effective than a placebo, that finding shapes prescribing behavior, insurance coverage decisions, and patient expectations. If that finding is based on a misapplied or misinterpreted p-value, the downstream harm can be substantial. Understanding the difference between a statistically significant result and a clinically meaningful one is not just an academic exercise in medicine. It is a matter of patient welfare.
Policy decisions face similar challenges. Governments and organizations invest enormous resources in programs designed to improve education, reduce crime, promote public health, and address poverty. Evaluating whether those programs actually work requires careful statistical analysis. When evaluators misinterpret p-values, or when policymakers accept "significant" findings without understanding their limitations, resources get directed toward interventions that may not be effective while genuinely useful programs go unfunded. Statistical literacy at the policy level is not a luxury. It is a prerequisite for responsible governance.
The good news is that p-value literacy is a learnable skill. It does not require advanced mathematics or years of statistical training. What it requires is a clear understanding of a few core concepts, a willingness to ask critical questions, and the habit of looking beyond a single number to understand the full picture. That is exactly what this book will help you build. The stakes are real, the skills are accessible, and the time to develop them is now.
A telling example: In 2011, a widely cited study claimed that people could predict future events at rates above chance, producing p-values below 0.05 across multiple experiments. The study passed peer review and was published in a top psychology journal. Subsequent attempts to replicate the findings failed consistently. The original results were almost certainly a product of flexible data analysis and the misuse of significance thresholds, not evidence of genuine predictive ability.[3] This case became a catalyst for broader conversations about statistical reform in psychology.
This example is not meant to mock the researchers involved. It is meant to illustrate how even well-intentioned, trained scientists can produce misleading results when the tools they rely on are misunderstood or misapplied. The problem is systemic, and the solution begins with education. Every professional who works with data, reads research, or makes decisions based on statistical findings has a role to play in raising the standard of statistical reasoning in their field.
What You'll Learn in This Book
This book is organized to build your understanding progressively, starting with the fundamentals and moving toward more sophisticated frameworks for decision-making. Each chapter addresses a specific aspect of statistical thinking, and together they form a complete toolkit for interpreting and applying statistical evidence in the real world. Here is a brief map of what lies ahead.
Chapters 1 and 2 lay the groundwork. Chapter 1 explains what p-values actually are, how they are calculated, and what the null hypothesis really means. This is not a review of things you already know. Even professionals with years of experience often carry subtle misconceptions about these basics, and clearing them up makes everything else easier to understand. Chapter 2 then tackles the most common myths about p-values directly, including the widespread belief that a p-value tells you the probability that your hypothesis is true. Spoiler: it does not.
Chapter 3 introduces one of the most important distinctions in all of applied statistics: the difference between statistical significance and practical significance. A result can be statistically significant and completely meaningless in practice. Understanding why requires grasping the concept of effect size, which measures not just whether an effect exists but how large it is. This chapter provides concrete examples from business, medicine, and social science to make the distinction tangible.
Chapter 4 examines the replication crisis in depth. It explains the practices that contributed to it, including p-hacking, selective reporting, and publication bias, and shows how these behaviors emerge naturally from incentive structures in research and business. Understanding how the crisis happened is essential for recognizing similar patterns in the data you encounter every day.
Chapters 5 and 6 expand your statistical toolkit. Chapter 5 covers confidence intervals and effect sizes as essential companions to p-values. Chapter 6 addresses the role of sample size, study design, and statistical assumptions in shaping what a p-value can and cannot tell you. These chapters give you the context needed to evaluate any statistical claim critically, not just accept or reject it based on a single threshold.
Chapter 7 introduces Bayesian thinking as a complementary framework. You do not need to become a Bayesian statistician to benefit from this chapter. The goal is to show how thinking about prior probabilities and updating beliefs with evidence can make you a more rigorous and honest analyst, regardless of which statistical methods you use in practice.
Chapters 8 and 9 focus on application. Chapter 8 provides frameworks for integrating statistical evidence into real decisions, including how to weigh multiple sources of evidence and build a coherent picture from incomplete information. Chapter 9 teaches you to spot red flags in research reports, media coverage, and marketing claims, giving you a practical checklist of questions to ask whenever you encounter a statistical finding.
Chapter 10 looks at organizational practices. It covers pre-registration, transparency, and reproducibility as tools for improving the quality of statistical work at the team and institutional level. Whether you lead a research team, manage analysts, or simply want to advocate for better practices in your organization, this chapter provides concrete steps you can take.
By the end of this book, you will have a clear and accurate understanding of what p-values measure, a set of practical tools for evaluating statistical claims, and a framework for making better decisions under uncertainty. These are skills that compound over time. Every time you apply them, you get a little sharper, a little harder to mislead, and a little more effective at turning data into genuine insight.
How to Use This Guide
This book is designed to be read from beginning to end, but it is also structured so that individual chapters stand on their own if you need to focus on a specific topic. If you are already comfortable with the basics of hypothesis testing, you might move quickly through Chapter 1 and spend more time on Chapters 3 through 5, where the most practically valuable material lives. If you are primarily interested in organizational improvement, Chapter 10 can be read alongside Chapter 4 without losing much context.
Throughout the book, you will find several recurring features designed to make the content as useful as possible:
- Concrete examples: Every major concept is illustrated with a real-world scenario drawn from business, research, healthcare, or policy. These are not hypothetical toy problems. They reflect the kinds of situations you are likely to encounter in your own work.
- Common mistakes to avoid: Each chapter highlights the specific errors that professionals most often make when working with the concepts covered. Knowing what not to do is just as important as knowing what to do.
- Actionable steps: Where possible, concepts are translated into specific actions you can take immediately, whether that means asking a different question about a report you received, changing how you design an experiment, or advocating for a new practice in your organization.
- Key terms: Important statistical terms are introduced clearly when they first appear and are collected in the glossary at the back of the book for easy reference.
One important note about the level of mathematics in this book: it is intentionally kept to a minimum. There are formulas where they genuinely help clarify a concept, but the focus throughout is on intuition and interpretation rather than calculation. You do not need to be able to compute a p-value by hand to understand what it means and how to use it wisely. Statistical software handles the computation. Your job is to understand what the output means and what to do with it.
It is also worth being honest about what this book will not do. It will not make you an expert statistician. It will not replace a formal course in statistics or a textbook on research methods. What it will do is give you a solid, practical foundation for thinking statistically in the contexts where you actually work. Think of it as the bridge between knowing that statistics matter and knowing how to engage with them critically and confidently.
The most effective way to use this guide is actively. When you encounter an example, pause and think about how it maps to situations in your own field. When you read about a common mistake, ask yourself honestly whether you have made that mistake or seen it made around you. When you reach an actionable step, consider whether you can apply it to something you are currently working on. Statistical thinking is not a passive skill. It develops through practice, reflection, and the willingness to question assumptions, including your own.
You might also find it useful to keep a running list of statistical claims you encounter in your daily work or in the news as you read through the book. By the time you finish, you will have a much richer set of tools for evaluating those claims. Revisiting your list at the end can be a powerful way to see how much your thinking has shifted. Many readers find that the most immediate benefit of this kind of statistical education is not in the formal analyses they run but in the questions they start asking about the analyses others present to them.
Finally, approach this material with a spirit of intellectual humility. Statistical thinking is genuinely hard, not because the math is complicated but because it requires holding uncertainty in mind while still making decisions. It requires resisting the very human desire for clear, definitive answers when the evidence only supports tentative conclusions. That discomfort is not a sign that you are doing it wrong. It is a sign that you are doing it right. The goal is not certainty. The goal is better-calibrated judgment, and that is something every professional can develop with the right tools and the right mindset.
A practical starting point: Before moving to Chapter 1, think of one statistical claim you have encountered recently at work, in a news article, or in a report you read. Write it down. Keep it in mind as you work through the book. By Chapter 9, you will have a complete framework for evaluating it critically. That single exercise, applied consistently, is one of the most effective ways to turn the ideas in this book into lasting habits of thought.
Statistical literacy is not a destination. It is an ongoing practice. The professionals who make the best decisions are not necessarily those with the most advanced technical training. They are the ones who ask the right questions, understand the limits of their evidence, and resist the temptation to treat a number as a substitute for judgment. This book is your starting point for becoming one of those professionals. The concepts ahead are accessible, the examples are grounded in reality, and the skills you will build are ones you will use for the rest of your career. Let's get started.
Notes
Introduction
- 1. S. Greenland and others, "Statistical tests, P values, confidence intervals, and power," European Journal of Epidemiology, 2016
- 2. Open Science Collaboration, "Estimating the reproducibility of psychological science," Scienceaac4716, 2015
- 3. D. J. Bem, "Feeling the future," Journal of Personality and Social Psychology, 2011
This is the end of the free sample. The full book has 10 chapters.
Want this book written for you?
Tell us your goals and background, and get your own version of this book, tailored by AI to you.


Benefits of AI-tailored books
- Read one book, not ten:
- all the Statistics knowledge you need, gathered into a single book.
- Save days of learning:
- tell us your goals, choose your topics, and the whole book is built around them.
- Learn effortlessly:
- Statistics book written for your specific background and expertise.
- Understand at a glance:
- includes charts, tables, timelines, checklists, decision trees, and more.
- Stay current:
- written the day you order it, not years ago.
- Trust what you read:
- every book is checked for accuracy, with real research when your subject needs it.
Create your unique book in 3 steps
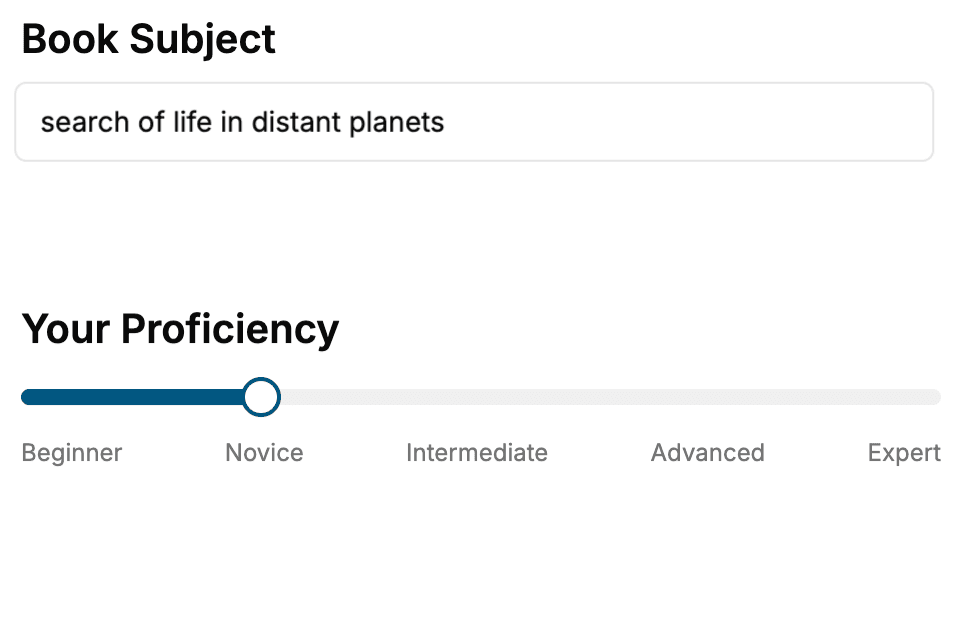
- 1. Select your focus
Select the focus of your Statistics book and share your background
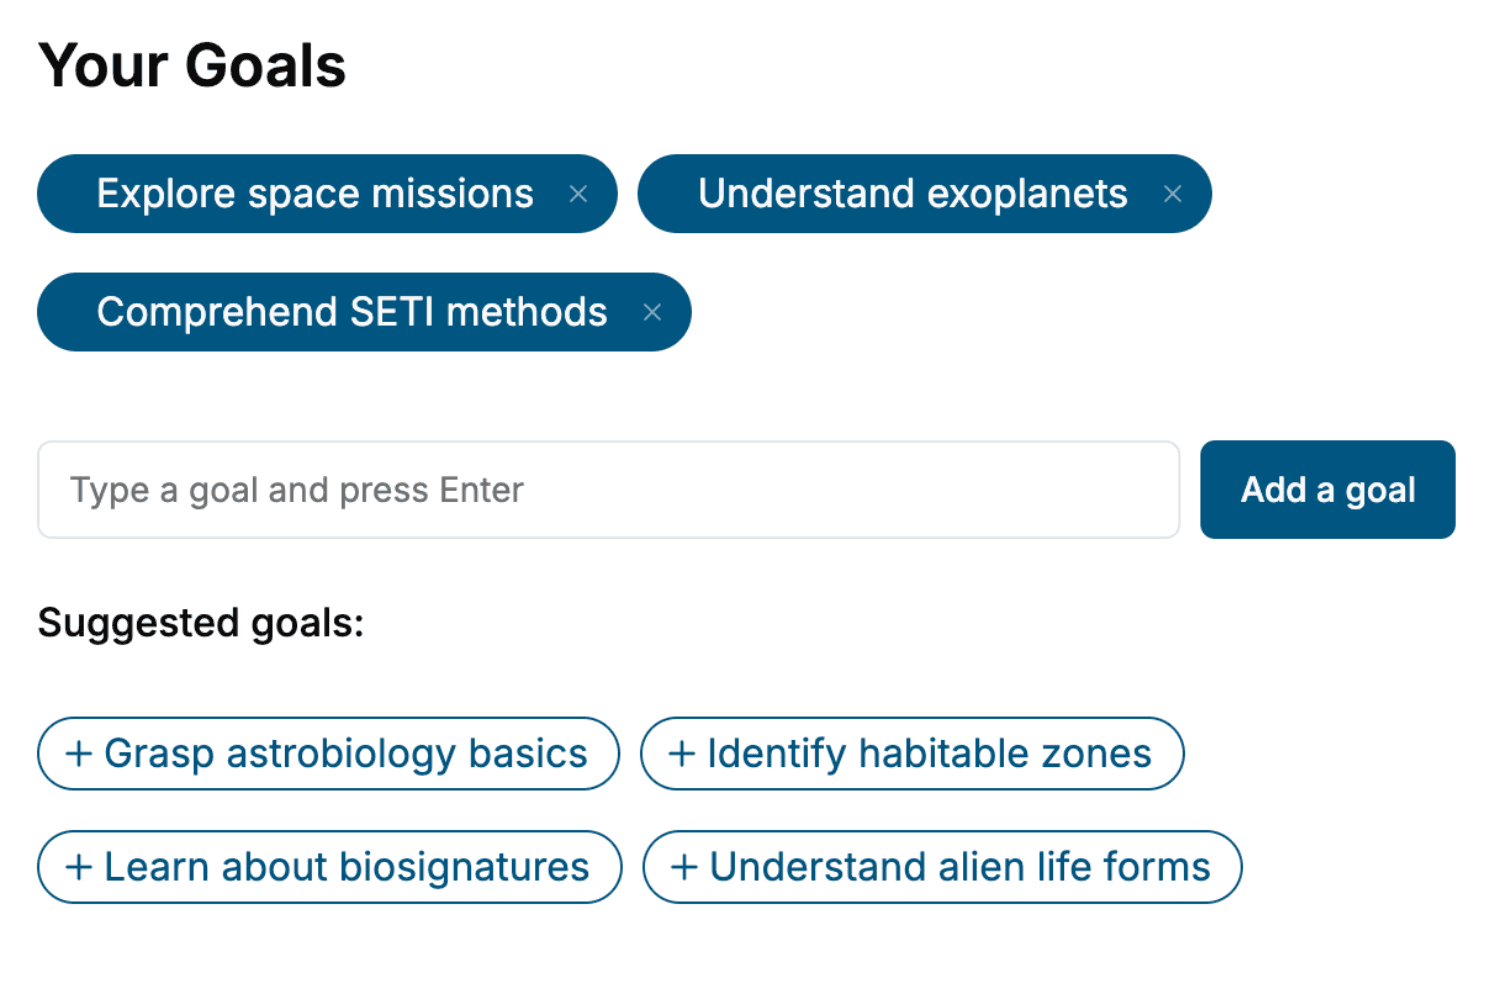
- 2. Personalize your book
Specify your goals and choose sub-topics to include
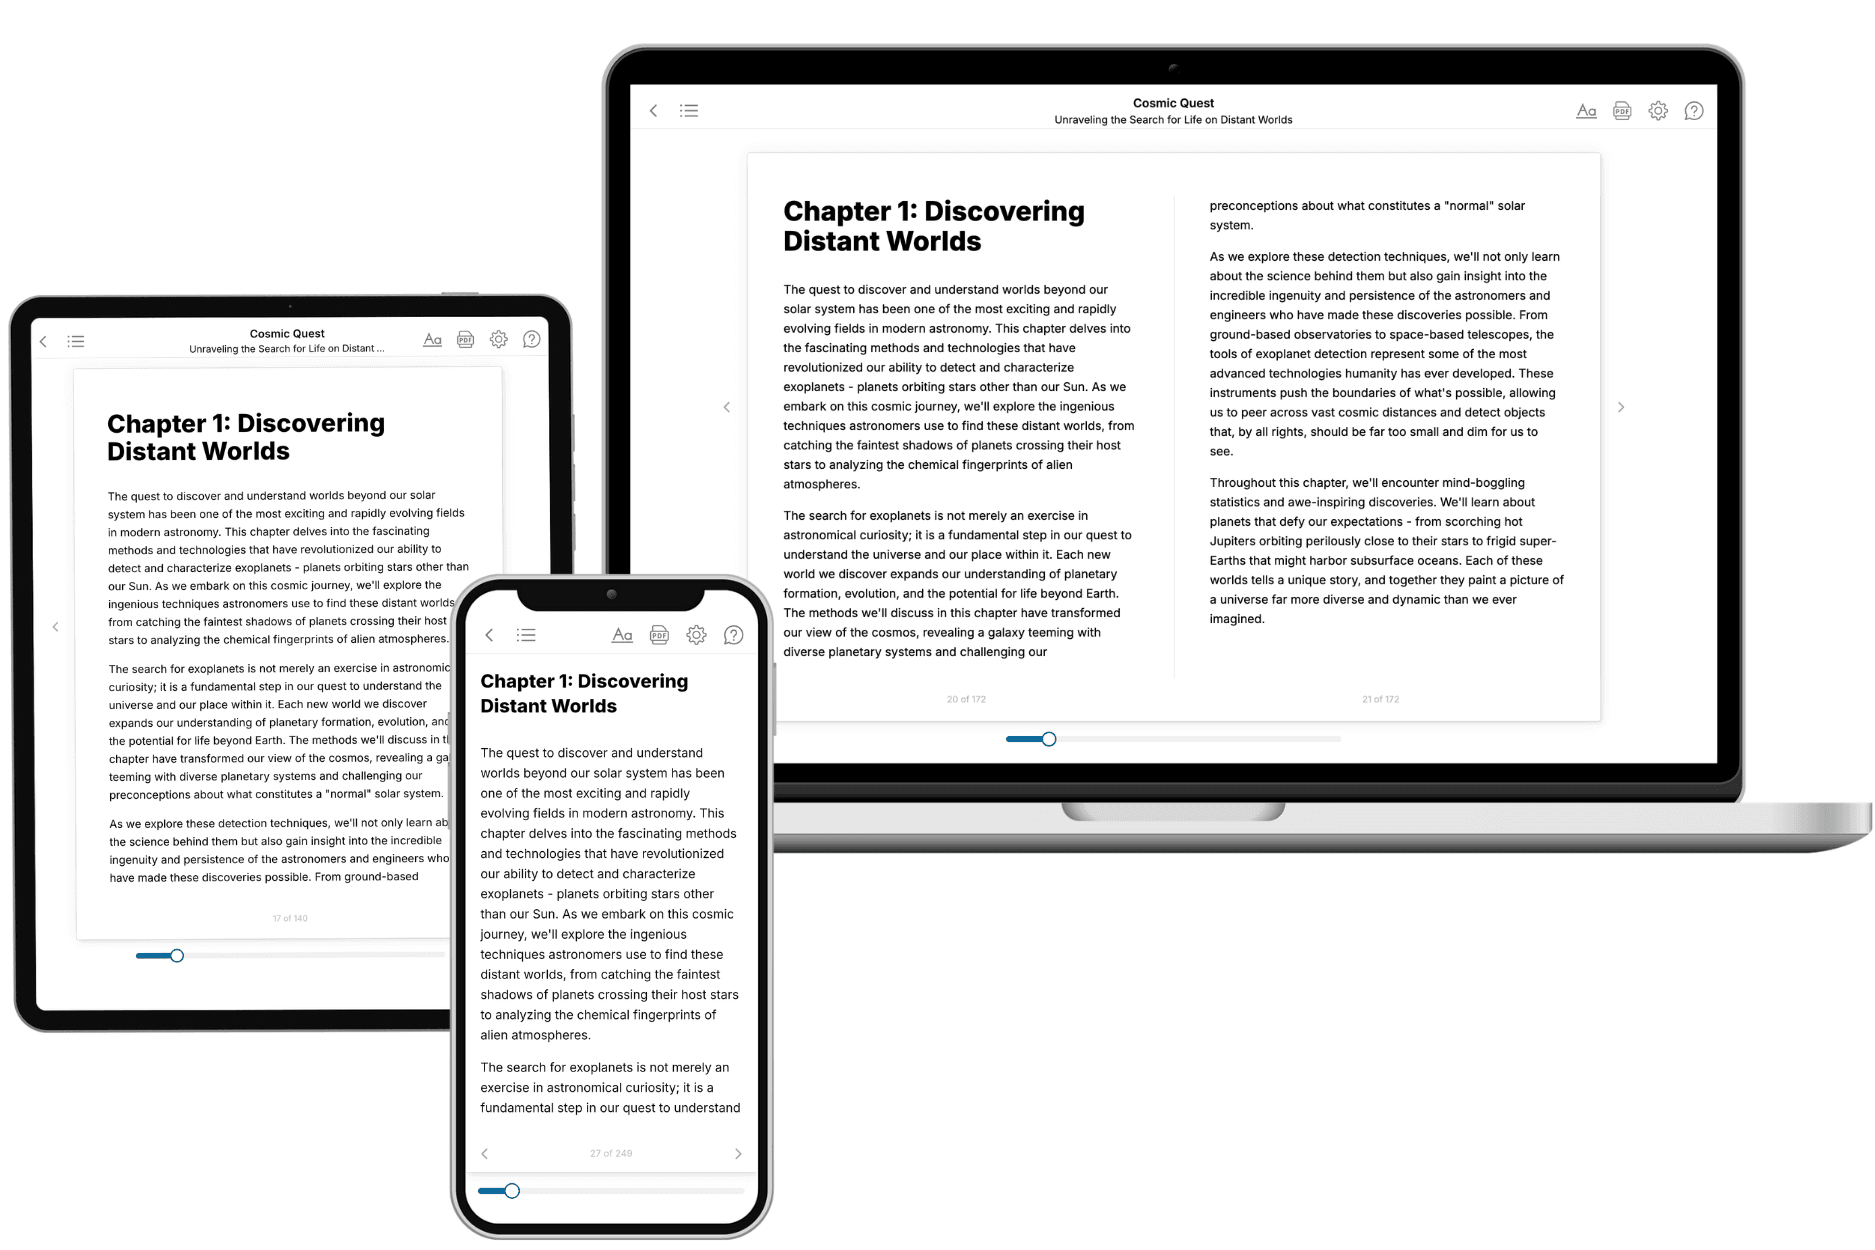
- 3. Get your tailored book
Your book is ready in 10 minutes. Read it online, download as EPUB or PDF, or send to Kindle.
Frequently asked questions
- What is TailoredRead?
TailoredRead creates complete, full-length nonfiction ebooks, written specifically for you. Tell us what you want to learn and why, and TailoredRead writes you a complete ebook on it, with charts, tables, and diagrams throughout. Read it online, on Kindle, or on any e-reader, or download it as a PDF or EPUB. Every book is written fresh the day you order it.
- How is the book tailored to me?
Before anything is written, you answer a few short questions about your goals, your background, and the topics you care about. Your book is then planned around your answers: written at your level, focused on your goals, and covering the topics you chose, instead of the one-size-fits-all book a store sells everyone.
- Will it read like generic AI content?
No. Your book isn't a chat transcript: it's planned chapter by chapter before a single word is written, told in a clear book voice, and explains ideas visually with charts, tables, and diagrams. After writing, every book goes through an editorial pass that polishes chapters so the book reads consistent from start to finish. Judge for yourself: browse thousands of sample books on our Explore Books page.
- How accurate is the content?
Our AI first checks whether your subject needs live research. Niche and fast-moving subjects are researched before writing, and the book plan and chapters are grounded in what it finds. After writing, every book goes through a quality pass that checks its facts and consistency, and researched books list their sources in a Notes section at the back.
- How long is the book?
You choose the length: Comprehensive (250-300 pages), Detailed (150-200 pages), Essential (70-100 pages), or Short (30-50 pages).
- Does the book include visuals?
Yes. Every book includes charts, tables, and diagrams: timelines, checklists, step-by-step guides, decision trees, comparison tables, matrices, and bar charts. A typical book includes dozens of these visual elements.
- Can I read it on Kindle? What formats can I download?
Yes. Every book can be read in our online reader or downloaded as a PDF or EPUB. The EPUB can be opened with Kindle, Apple Books, Kobo, and any e-reader. The Commercial and Author licenses also include an editable Word (DOCX) and Markdown download.
- How much does it cost?
About the price of a regular ebook. The exact price depends on your book's length and complexity, from $2 for the shortest books to $35 for the most comprehensive, and it's shown when you review your book, before you commit to anything. Each book is a one-time purchase, yours to keep, no subscription. Licenses that let you share, teach, or publish your book range from $35.99 to $49.99.
- Can I preview the book before purchasing?
Before you pay, you'll see what your book will cover: the title, a detailed description, the estimated length, and the complete chapter-by-chapter table of contents, so you know what you're getting before you decide. The full text itself is written after you purchase.
- How long does it take to create a book?
About 10 minutes. You can start reading the opening chapters while the rest is still being written.