Beyond the P-Value
Mastering Frequentist Statistics and Avoiding Common Pitfalls in Research
Imagine confidently evaluating research papers, immediately spotting statistical flaws that others miss, and understanding exactly what p-values actually tell you—and more importantly, what they don't.
207 pages11 chaptersJul 13, 2026StatisticsCreated by Dr
About this book
This comprehensive guide cuts through the confusion surrounding frequentist statistics and reveals the hidden pitfalls that plague modern research. You'll discover why p-values are routinely misinterpreted, how the multiple comparisons problem silently inflates false discoveries, and why statistical significance often masks practical irrelevance. Through clear explanations, real-world examples, and practical frameworks, you'll master the distinction between Type I and Type II errors, learn to recognize data dredging and selective reporting, and understand when Bayesian alternatives offer superior insights. Whether you're designing studies, reviewing manuscripts, or navigating the replication crisis, this book provides the critical knowledge to strengthen your statistical reasoning and contribute to more rigorous science. Build the analytical foundation to question assumptions, evaluate evidence rigorously, and help restore integrity to statistical practice.
Table of contents
- IntroductionWhy Statistical Literacy Matters Now, What This Book Covers and How to Use It, The Frequentist Framework: A Brief FoundationRead below
- Chapter 1: Understanding P-Values: Beyond the ThresholdWhat P-Values Actually Measure, The Seven Most Common P-Value Misinterpretations, P-Values in Context: Assumptions and Conditions
- Chapter 2: Type I and Type II Errors: The Foundation of Hypothesis TestingDefining Type I and Type II Errors, The Fundamental Tradeoff Between Error Types, Controlling Error Rates in Practice, Statistical Power and Sample Size Justification
- Chapter 3: The Multiple Comparisons Problem: When Testing Many HypothesesHow Multiple Tests Inflate Type I Error, Correction Methods: Bonferroni, Holm, and Beyond, Family-Wise Error Rate vs. False Discovery Rate
- Chapter 4: Statistical Significance vs. Practical ImportanceWhat Statistical Significance Really Means, Effect Sizes: The Missing Piece of the Puzzle, Determining Practical Significance in Your Field
- Chapter 5: Confidence Intervals: Interpretation and MisconceptionsWhat Confidence Intervals Actually Represent, Five Critical Misconceptions About Confidence Intervals, Proper Reporting and Interpretation Standards
- Chapter 6: Data Dredging, HARKing, and P-Hacking: The Hidden ThreatsDefining Data Dredging and HARKing, P-Hacking Techniques and How They Inflate False Positives, Detecting and Preventing Data Dredging in Your Research, Pre-Registration and Confirmatory Analysis as Safeguards
- Chapter 7: Publication Bias and Selective Reporting: Distorted EvidenceUnderstanding Publication Bias and Its Mechanisms, Selective Reporting and Outcome Switching, Detecting Publication Bias: Funnel Plots and Statistical Tests
- Chapter 8: The Replication Crisis: Why Studies Don't ReplicateThe Scope and Causes of the Replication Crisis, Designing and Interpreting Replication Studies, Methodological Solutions and Best Practices
- Chapter 9: Meta-Analysis and Cumulative Evidence: Synthesizing ResearchMeta-Analysis Fundamentals and Interpretation, Understanding Heterogeneity and Subgroup Analysis, Common Pitfalls in Meta-Analysis Interpretation
- Chapter 10: Bayesian Approaches: Complementary Perspectives and SolutionsThe Bayesian Framework and Prior Information, When and Why Bayesian Methods Offer Superior Insights, Practical Bayesian Applications for Frequentist Researchers
- Chapter 11: Critical Appraisal: Evaluating Published ResearchA Systematic Framework for Critical Appraisal, Red Flags and Warning Signs in Statistical Reporting, The Statistical Appraisal Checklist
- ConclusionKey Takeaways and Core Principles, Moving Forward: Building Better Statistical Practice
Introduction
Statistics has a credibility problem. Not because the mathematics is broken, but because the way researchers apply, interpret, and communicate statistical results has drifted far from what the methods were designed to do. Every week, journals publish findings built on shaky inferential foundations. News outlets trumpet discoveries that quietly disappear when other researchers try to reproduce them. Clinicians make treatment decisions based on effect sizes that were never reported, only p-values that crossed an arbitrary threshold. The tools are sound. The practice, far too often, is not.
If you have a master's degree in mathematics or statistics, you already know the formal definitions. You can derive the sampling distribution of a test statistic, explain the Neyman-Pearson framework, and describe what a confidence interval represents in technical terms. But knowing the definitions and consistently applying them correctly under real research pressure are two very different things. The gap between formal training and actual practice is where most statistical errors live, and that gap is wider than the field likes to admit.
This book exists to close that gap. It is not a textbook that re-derives theorems you already know. It is a critical guide to the places where frequentist reasoning breaks down in practice, where well-trained researchers make systematic errors, and where the incentive structures of modern science actively push against rigorous inference. The goal is to sharpen your ability to spot these problems in published work, in your own analyses, and in the broader research culture you operate within. By the end, you should be able to read a methods section with a genuinely critical eye and know exactly what questions to ask.
The chapters ahead move from foundational concepts to advanced pitfalls, building a layered understanding of how frequentist methods work, where they are commonly misused, and what better practice looks like. Along the way, you will encounter real examples from psychology, medicine, economics, and ecology, fields where statistical errors have had measurable consequences. The problems discussed here are not abstract. They affect which drugs get approved, which educational interventions get funded, and which scientific findings shape public policy.
Why Statistical Literacy Matters Now
The replication crisis changed everything. Beginning around 2011, a series of high-profile failures to reproduce landmark findings sent shockwaves through psychology, medicine, and the social sciences. The Open Science Collaboration's 2015 replication project attempted to reproduce 100 published psychology studies and found that only about 36 to 39 percent replicated with statistically significant results at the original effect size.[1] That number was alarming not because psychology is uniquely flawed, but because it revealed how widespread the underlying problems were across empirical disciplines.
The causes of the replication crisis are statistical at their core. Underpowered studies, p-hacking, selective outcome reporting, and the misuse of significance thresholds all contributed to a literature filled with inflated effect sizes and false positives. These are not exotic problems confined to bad actors. They emerge naturally from the incentive structures of academic publishing, where positive results get published and null results get filed away. Understanding the statistical mechanisms behind the crisis is the first step toward not contributing to it.
Beyond replication, the stakes of statistical literacy extend into public life. During the COVID-19 pandemic, statistical claims about vaccine efficacy, relative versus absolute risk reduction, and the interpretation of confidence intervals appeared daily in mainstream media. Many of those claims were misrepresented, sometimes by researchers themselves. A 2021 analysis found that several prominent papers reporting vaccine efficacy figures used relative risk reduction without clearly communicating the corresponding absolute risk reduction, creating a misleading impression of benefit magnitude.[2] The difference between those two numbers is not a technicality. It is the difference between an informed decision and a manipulated one.
Statistical errors also have direct financial consequences. In drug development, a Phase III trial that fails to replicate a Phase II finding costs hundreds of millions of dollars and years of research effort. In finance, models built on spurious correlations discovered through data mining have contributed to catastrophic losses. In education policy, interventions scaled nationally based on small, underpowered pilot studies have consumed enormous resources without producing the promised outcomes. The cost of poor statistical practice is not just academic. It is measured in money, time, and human welfare.
For statisticians specifically, this moment carries a professional responsibility. You are among the people best positioned to push back against sloppy practice, to educate collaborators, to review manuscripts with genuine rigor, and to design studies that produce trustworthy evidence. That responsibility requires more than knowing the formulas. It requires understanding the social and cognitive pressures that lead smart, well-intentioned researchers to make systematic errors, and knowing how to counteract those pressures in your own work and in the work you evaluate.
The good news is that the field is actively reforming. Pre-registration of study hypotheses and analysis plans has become standard in many journals. Effect size reporting requirements are increasingly common. The American Statistical Association issued a landmark statement in 2016 clarifying what p-values can and cannot tell us, followed by a 2019 special issue calling for a fundamental shift away from binary significance thinking.[3] These reforms need statisticians who understand them deeply enough to implement and advocate for them. That is exactly what this book prepares you to do.
Statistical literacy is not a fixed destination. It is a practice of continual critical engagement with methods, assumptions, and evidence. The chapters ahead are designed to build that practice systematically, starting from the most fundamental concepts and moving toward the most nuanced challenges in modern research design and appraisal.
What This Book Covers and How to Use It
This book is organized around the most consequential problems in frequentist statistical practice. Each chapter targets a specific area where misunderstanding or misuse is common, explains the underlying mechanism clearly, and provides concrete tools for doing better. The progression is deliberate: foundational concepts come first, followed by increasingly complex methodological challenges, and finally the broader ecosystem of research practice and evidence synthesis.
Here is a brief map of what each section covers:
- Chapters 1 through 3 address the core mechanics of hypothesis testing: what p-values actually measure, how Type I and Type II errors work and trade off against each other, and how multiple comparisons silently inflate false discovery rates.
- Chapters 4 and 5 tackle the distinction between statistical and practical significance, covering effect sizes and the proper interpretation of confidence intervals, two areas where even experienced researchers routinely go wrong.
- Chapters 6 and 7 examine the research practices that corrupt the statistical record: data dredging, HARKing (Hypothesizing After Results are Known), p-hacking, publication bias, and selective outcome reporting.
- Chapters 8 and 9 zoom out to the level of the scientific literature, covering the replication crisis and the methods used to synthesize evidence across studies through meta-analysis.
- Chapters 10 and 11 provide complementary perspectives: Bayesian approaches that address some of frequentism's inherent limitations, and a systematic framework for critically appraising published research.
You do not need to read this book cover to cover in sequence, though doing so will give you the most coherent understanding. If you are primarily interested in improving your manuscript review skills, Chapter 11 and its accompanying checklist can be used as a standalone reference. If you are designing a new study and want to avoid common pitfalls, Chapters 2, 3, and 6 are the most immediately relevant. If you are trying to understand why a colleague's analysis produced suspicious results, Chapters 1 and 4 will give you the diagnostic vocabulary you need.
Each chapter includes concrete examples drawn from real research contexts. These examples are chosen not to embarrass specific researchers but to illustrate how common and understandable these errors are. The goal is recognition, not judgment. When you see how a particular error arises naturally from the pressures of research practice, you are better equipped to avoid it yourself and to explain it clearly to others.
Throughout the book, you will find practical frameworks and checklists designed for immediate use. These include a pre-analysis planning template, a guide to selecting appropriate effect size measures by study design, a funnel plot interpretation guide, and a comprehensive statistical appraisal checklist for evaluating published papers. These tools are meant to be used, not just read. Consider bookmarking the sections most relevant to your current work and returning to them when you need a structured reference.
One important note about scope: this book focuses on frequentist methods because they remain the dominant framework in most empirical disciplines. Bayesian methods receive dedicated coverage in Chapter 10, but the treatment there is comparative and practical rather than exhaustive. If you want a deep dive into Bayesian computation or prior specification, excellent dedicated resources exist for that purpose. The goal here is to help you understand when and why Bayesian thinking offers something that frequentist methods cannot, and how to incorporate that perspective into your critical toolkit.
Finally, this book assumes you are comfortable with the mathematical foundations of statistics. Derivations are included where they illuminate a conceptual point, but the emphasis throughout is on understanding and application rather than proof. The aim is to build the kind of deep, flexible understanding that lets you reason clearly about statistical problems you have never seen before, not just recognize the ones you have.
The Frequentist Framework: A Brief Foundation
Before diving into the pitfalls, it is worth being precise about what the frequentist framework actually is and what it was designed to accomplish. Frequentist statistics is built on the idea that probability represents the long-run frequency of outcomes in repeated experiments. A probability of 0.05 means that if you repeated the same experiment under identical conditions an infinite number of times, the event in question would occur in 5 percent of those repetitions. This is a fundamentally different conception of probability from the Bayesian view, which treats probability as a degree of belief about uncertain quantities.
The modern frequentist framework for hypothesis testing emerged from the work of two distinct traditions that were later merged, sometimes uncomfortably. Ronald Fisher developed the concept of the p-value as a measure of evidence against a null hypothesis, intended as a continuous index of how surprising the data were under that hypothesis.[4] Jerzy Neyman and Egon Pearson developed a different framework focused on decision-making, in which you specify both a null and an alternative hypothesis, set acceptable error rates in advance, and use the test to make a binary accept-or-reject decision.[5]
These two frameworks have different goals and different interpretations of what a test result means. Fisher's p-value is a measure of evidence. Neyman and Pearson's rejection region is a decision rule with controlled long-run error rates. The hybrid that most researchers use today, in which a p-value below 0.05 is treated as a binary decision to reject the null hypothesis, combines elements of both frameworks in a way that neither Fisher nor Neyman and Pearson would have fully endorsed. Understanding this historical tension helps explain why so many conceptual confusions about p-values persist.
The key components of the frequentist hypothesis testing framework are worth stating clearly, because each one is a potential source of error when misunderstood:
- The null hypothesis (H₀): A specific, testable claim about a population parameter, typically representing no effect or no difference. The null hypothesis must be precisely specified before data collection.
- The alternative hypothesis (H₁): The claim that the null hypothesis is false. In Neyman-Pearson testing, this must also be specified in advance, including its direction (one-tailed vs. two-tailed) and the minimum effect size of interest.
- The significance level (α): The maximum acceptable probability of rejecting a true null hypothesis (Type I error rate), set before data collection. The conventional value of 0.05 is a historical convention, not a mathematical law.
- Statistical power (1 - β): The probability of correctly rejecting a false null hypothesis, which depends on sample size, effect size, and α. Adequate power requires explicit calculation before data collection.
- The p-value: The probability of observing a test statistic as extreme as or more extreme than the one obtained, assuming the null hypothesis is true. It is not the probability that the null hypothesis is true.
Each of these components carries assumptions that are frequently violated in practice. The null hypothesis is often vague or implicitly defined. The significance level is chosen after seeing the data. Power calculations are skipped or performed post-hoc. And the p-value is routinely interpreted as something it is not. The chapters that follow address each of these failure modes in detail, but it is useful to have the full framework in view from the start so you can see how the pieces connect.
One of the most important things to understand about the frequentist framework is that its guarantees are long-run guarantees. When you set α = 0.05, you are not saying that there is a 5 percent chance your specific result is a false positive. You are saying that if you applied this decision rule repeatedly across many studies, you would make a Type I error in at most 5 percent of cases where the null hypothesis is true. This distinction matters enormously. It means that a single p-value below 0.05 tells you very little about whether your specific result is a true effect. The validity of the inference depends on the entire procedure being followed correctly, including pre-specification of hypotheses, random sampling, and no peeking at the data before the planned stopping point.
Frequentist methods are powerful and well-suited to many research questions, particularly those involving large samples, well-defined populations, and clearly specified hypotheses. They are less well-suited to situations where prior information is relevant, where sample sizes are small, or where the research question involves estimating the probability that a specific hypothesis is true. Recognizing these boundaries is part of using the framework responsibly. The goal of this book is not to undermine frequentist statistics but to help you use it with the precision and awareness it demands.
The frequentist framework is not broken. But it is routinely used in ways that violate its own assumptions, producing results that look rigorous but are not. The first step toward better practice is understanding exactly what the framework promises and what it does not.
With that foundation in place, the chapters ahead can focus on the specific ways things go wrong and the specific steps you can take to prevent them. The journey starts with the most misunderstood number in all of science: the p-value.
Notes
Introduction
- 1. Open Science Collaboration, "Estimating the reproducibility of psychological science," Scienceaac4716, 2015
- 2. R. B. Brown, "Outcome Reporting Bias in COVID-19 mRNA Vaccine Clinical Trials," Medicina, 2021
- 3. R. L. Wasserstein and others, Moving to a World Beyond 'p < 0.05', The American Statistician, 73(sup1), 2019
- 4. R. A. Fisher, Statistical Methods for Research Workers, Oliver and Boyd, Edinburgh, 1925
- 5. J. Neyman and E. S. Pearson, "On the problem of the most efficient tests of statistical hypotheses," Philosophical Transactions of the Royal Society A, 1933
This is the end of the free sample. The full book has 11 chapters.
Want this book written for you?
Tell us your goals and background, and get your own version of this book, tailored by AI to you.


Benefits of AI-tailored books
- Read one book, not ten:
- all the Statistics knowledge you need, gathered into a single book.
- Save days of learning:
- tell us your goals, choose your topics, and the whole book is built around them.
- Learn effortlessly:
- Statistics book written for your specific background and expertise.
- Understand at a glance:
- includes charts, tables, timelines, checklists, decision trees, and more.
- Stay current:
- written the day you order it, not years ago.
- Trust what you read:
- every book is checked for accuracy, with real research when your subject needs it.
Create your unique book in 3 steps
- 1. Select your focus
Select the focus of your Statistics book and share your background
- 2. Personalize your book
Specify your goals and choose sub-topics to include
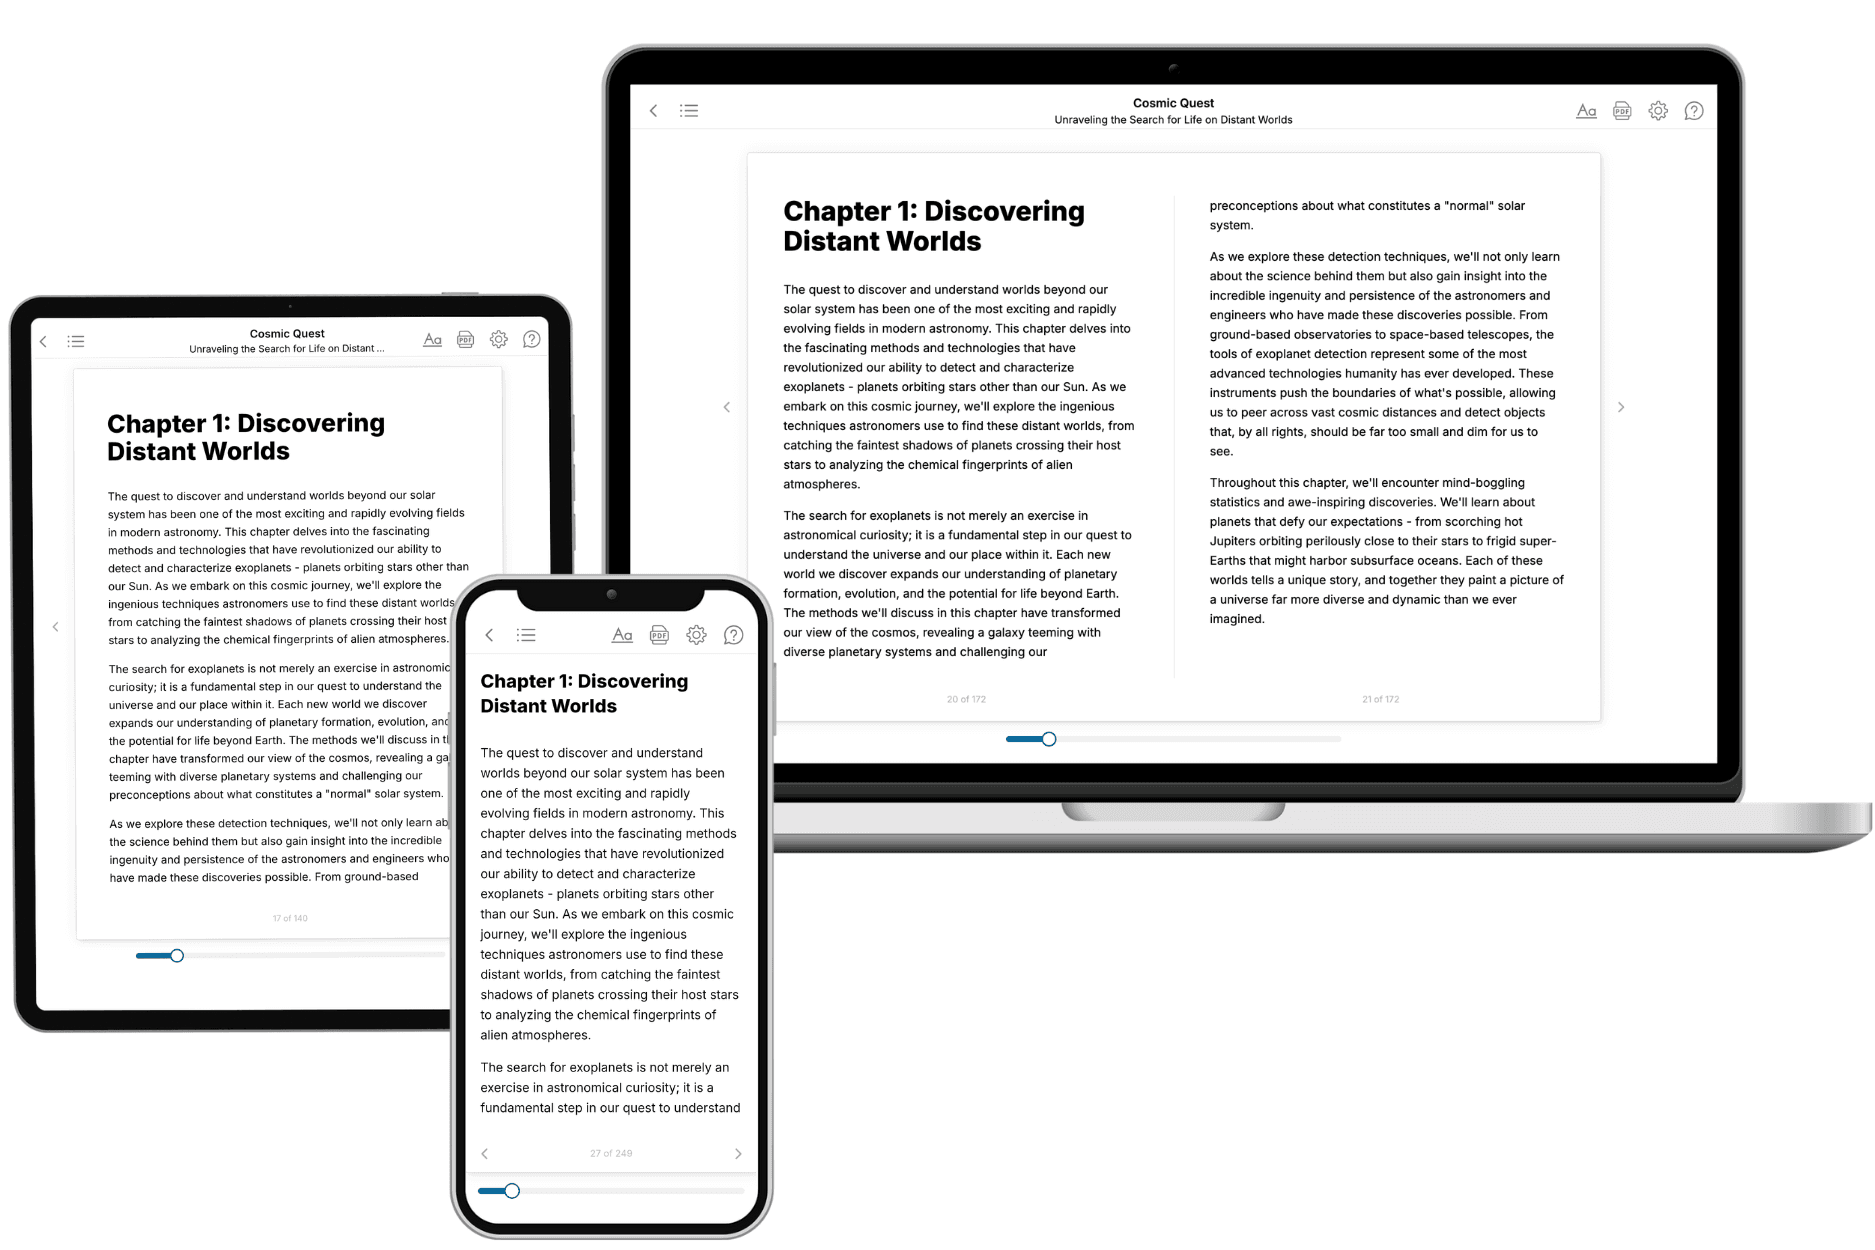
- 3. Get your tailored book
Your book is ready in 10 minutes. Read it online, download as EPUB or PDF, or send to Kindle.
Frequently asked questions
- What is TailoredRead?
TailoredRead creates complete, full-length nonfiction ebooks, written specifically for you. Tell us what you want to learn and why, and TailoredRead writes you a complete ebook on it, with charts, tables, and diagrams throughout. Read it online, on Kindle, or on any e-reader, or download it as a PDF or EPUB. Every book is written fresh the day you order it.
- How is the book tailored to me?
Before anything is written, you answer a few short questions about your goals, your background, and the topics you care about. Your book is then planned around your answers: written at your level, focused on your goals, and covering the topics you chose, instead of the one-size-fits-all book a store sells everyone.
- Will it read like generic AI content?
No. Your book isn't a chat transcript: it's planned chapter by chapter before a single word is written, told in a clear book voice, and explains ideas visually with charts, tables, and diagrams. After writing, every book goes through an editorial pass that polishes chapters so the book reads consistent from start to finish. Judge for yourself: browse thousands of sample books on our Explore Books page.
- How accurate is the content?
Our AI first checks whether your subject needs live research. Niche and fast-moving subjects are researched before writing, and the book plan and chapters are grounded in what it finds. After writing, every book goes through a quality pass that checks its facts and consistency, and researched books list their sources in a Notes section at the back.
- How long is the book?
You choose the length: Comprehensive (250-300 pages), Detailed (150-200 pages), Essential (70-100 pages), or Short (30-50 pages).
- Does the book include visuals?
Yes. Every book includes charts, tables, and diagrams: timelines, checklists, step-by-step guides, decision trees, comparison tables, matrices, and bar charts. A typical book includes dozens of these visual elements.
- Can I read it on Kindle? What formats can I download?
Yes. Every book can be read in our online reader or downloaded as a PDF or EPUB. The EPUB can be opened with Kindle, Apple Books, Kobo, and any e-reader. The Commercial and Author licenses also include an editable Word (DOCX) and Markdown download.
- How much does it cost?
About the price of a regular ebook. The exact price depends on your book's length and complexity, from $2 for the shortest books to $35 for the most comprehensive, and it's shown when you review your book, before you commit to anything. Each book is a one-time purchase, yours to keep, no subscription. Licenses that let you share, teach, or publish your book range from $35.99 to $49.99.
- Can I preview the book before purchasing?
Before you pay, you'll see what your book will cover: the title, a detailed description, the estimated length, and the complete chapter-by-chapter table of contents, so you know what you're getting before you decide. The full text itself is written after you purchase.
- How long does it take to create a book?
About 10 minutes. You can start reading the opening chapters while the rest is still being written.