The Chi-Square Test Demystified
Master Statistical Independence and Categorical Data Analysis
Many practitioners treat the chi-square test as a mechanical formula—plug in numbers, get a p-value, make a decision.
191 pages8 chaptersAug 28, 2026Statistics
About this book
But this approach misses the elegant logic underlying the test and often leads to misinterpretation of results. This book bridges the gap between statistical mechanics and philosophical understanding, showing you how chi-square testing actually works and why it matters. You'll explore the mathematical foundations that make the test possible, the methodological assumptions that determine when it's appropriate, and the philosophical questions about inference that shape how we interpret findings. Whether you're analyzing survey data, conducting quality control studies, or evaluating categorical relationships, this guide equips you with both the technical competence and conceptual clarity needed to apply chi-square testing with confidence and integrity. Discover how to avoid common pitfalls, understand effect sizes beyond p-values, and appreciate the deeper logic of statistical independence testing.
Table of contents
- IntroductionWhy Chi-Square Testing Matters, Common Misconceptions About the Test, What You'll Learn in This Book, How to Use This GuideRead below
- Chapter 1: Categorical Data and Statistical IndependenceUnderstanding Categorical Variables, The Concept of Statistical Independence, Building and Interpreting Contingency Tables
- Chapter 2: The Mathematical Foundation of Chi-SquareObserved Versus Expected Frequencies, Deriving the Chi-Square Formula, The Chi-Square Distribution Explained
- Chapter 3: Methodological Foundations and AssumptionsCore Assumptions for Valid Testing, Sample Size and Expected Frequency Requirements, Independence of Observations
- Chapter 4: Three Applications of Chi-Square TestingGoodness-of-Fit Testing, Testing for Homogeneity Across Groups, Testing for Independence Between Variables
- Chapter 5: Hypothesis Testing and Philosophical FrameworksConstructing and Understanding the Null Hypothesis, P-Values: What They Mean and Don't Mean, Frequentist Versus Bayesian Perspectives
- Chapter 6: Effect Size and Practical SignificanceMoving Beyond P-Values, Cramér's V and Other Effect Size Measures, Distinguishing Statistical from Practical Significance
- Chapter 7: Common Pitfalls and How to Avoid ThemDealing with Low Expected Frequencies, Multiple Testing and Correction Strategies, Avoiding Common Interpretation Errors
- Chapter 8: Modern Approaches and AlternativesSimulation-Based and Permutation Testing, Bayesian Approaches to Categorical Analysis, Leveraging Modern Computational Methods
- ConclusionSynthesizing Method and Philosophy, Continuing Your Statistical Journey
- Glossary of Key Terms
- Further Reading and Resources
Introduction
A hospital pharmacy tracks which of four medications trigger allergic reactions across three age groups. A marketing team wants to know whether customers who saw a new ad were more likely to click a certain product category than customers who did not. A geneticist studies whether a trait shows up in offspring at the ratios classical theory predicts. These three scenarios share nothing in subject matter, yet they share a mathematical skeleton. Each one asks whether counts sorted into categories line up with what would happen if nothing interesting were going on. That question, stripped of its many disguises, is what chi-square testing answers.
The test has survived more than a century of use because the question it answers keeps showing up everywhere data gets sorted into bins rather than measured on a scale. Surveys sort people into categories like age bracket, political affiliation, or product preference. Quality control sorts defects into categories like scratch, dent, or misalignment. Genetics sorts organisms into categories defined by which alleles they carry. Wherever counting replaces measuring, chi-square testing becomes a natural way to ask whether the pattern of counts could plausibly have arisen by chance, or whether something systematic is pulling the numbers away from a baseline expectation.
This introduction sets the stage before the technical material begins in earnest. It explains why the test deserves the attention this book gives it, clears away several misunderstandings that trip up even careful analysts, previews the material ahead chapter by chapter, and offers a short guide on how to move through the book depending on background and goals. None of this requires prior exposure to chi-square testing itself, though it assumes comfort with basic statistical vocabulary like variables, samples, and probability.
The chapters that follow build a single argument in stages: that chi-square testing is not a formula to memorize but a logical structure to understand, one that rewards a reader who grasps why it works and not merely how to run it. By the end of this introduction, the shape of that argument should be visible even before the mathematics arrives.
Why Chi-Square Testing Matters
Karl Pearson introduced the chi-square test in 1900 as a way to judge whether observed data matched a theoretical distribution, and the tool he built turned out to be far more general than his original application[1]. What makes the test durable is not its age but its scope. It applies just as well to a two-question survey as to a sprawling contingency table with a dozen categories on each side, and it does so without requiring the data to follow any particular numeric distribution, since categorical data has no mean or variance in the usual sense.
Consider a company testing whether customer satisfaction (categorized as low, medium, or high) differs across three store locations. A manager could eyeball the raw counts and guess that Store A looks worse than Store B, but guessing invites two failure modes. Sometimes real differences get dismissed as noise, and sometimes noise gets mistaken for a real pattern. Chi-square testing replaces the guess with a number, the chi-square statistic, that quantifies how far the observed pattern strays from what equal or proportional satisfaction across stores would predict. That number then gets compared against a known distribution to judge whether the deviation is bigger than chance alone would typically produce.
The test matters especially because categorical data is everywhere but statistical training often centers on continuous measurements like height, income, or test scores. Averages and standard deviations dominate introductory statistics, yet a huge share of real-world data consists of labels rather than numbers on a ruler. Someone's answer to a survey question, a product's defect type, a patient's diagnosis category, a voter's party registration. None of these can be summed and divided to get a mean. Chi-square testing fills the gap left by mean-based methods, giving analysts a principled way to compare category counts rather than forcing categorical answers into numeric tools that do not fit them.
Beyond its practical reach, the test carries a philosophical payload that many casual users never unpack. Running a chi-square test means implicitly asking a question about statistical independence, a concept borrowed from probability theory that describes when knowing one variable's value tells you nothing about another. That question is subtler than "are these numbers different," and grasping it changes how a person interprets every output the test produces. A p-value from a chi-square test is not a verdict on whether a relationship exists in some absolute sense. It is a statement about how surprising the observed pattern would be under a specific, well-defined assumption of independence.
The test also serves as a gateway into broader habits of statistical thinking that extend well past categorical data. Learning to separate observed frequency from expected frequency trains a mindset applicable to regression residuals, quality control charts, and Bayesian updating alike. This mindset, comparing what happened to what a model predicted should happen, sits at the center of empirical science generally. Chi-square testing offers one of the cleanest, most self-contained places to practice that mindset, because the arithmetic stays simple enough to trace by hand even as the logic scales up to genuinely difficult applied problems.
Fields ranging from epidemiology to political science to linguistics rely on chi-square methods as a first-line tool precisely because those fields generate categorical data by default. An epidemiologist categorizes exposure and disease status. A political scientist categorizes vote choice and demographic group. A linguist categorizes word type and dialect region. In each case, chi-square testing offers the fastest route from raw counts to a defensible statistical claim, which explains its persistent presence in introductory statistics courses across disciplines that otherwise have little in common.
None of this means the test is beyond criticism or free of limits, a point the book returns to repeatedly. But the criticisms only make sense once the underlying logic is clear, and the practical value only compounds once someone understands what the test can and cannot claim to show. Treating chi-square testing as a black box that spits out a p-value wastes most of what the method actually offers, and it invites the exact misinterpretations the next section addresses directly.
A useful way to frame the test's importance is through the lens of decision-making under uncertainty. Businesses, researchers, and policymakers constantly face categorical questions where the stakes are real: does a new drug's side-effect rate differ meaningfully across demographic groups, does a hiring process produce outcomes independent of applicant background, does a manufacturing change alter defect category proportions. Chi-square testing gives a disciplined, repeatable method for answering these questions rather than relying on impressions formed by staring at a table of numbers.
The test's mathematical elegance deserves mention alongside its practical utility. The way the chi-square distribution emerges naturally from squared, standardized deviations connects it to the normal distribution and to the broader machinery of statistical theory, a connection explored fully in later chapters. This elegance is not merely aesthetic. It means the test rests on solid theoretical ground rather than being an ad hoc invention, which is part of why it has remained a standard tool for over a century despite the rise of many newer, computationally intensive alternatives.
Finally, chi-square testing matters because it teaches restraint. A well-conducted chi-square analysis forces an analyst to specify assumptions in advance, check whether data meets minimum requirements, and interpret results within stated limits rather than overclaiming. That discipline transfers to every other statistical method a person eventually learns, making chi-square testing not just a useful technique in its own right but a training ground for statistical judgment more broadly.
Common Misconceptions About the Test
The most widespread misconception treats a small p-value from a chi-square test as proof that two categorical variables are causally related. A significant result only indicates that the observed frequencies deviate from what independence would predict by more than chance alone comfortably explains. It says nothing about why that deviation exists. A retailer might find a significant association between store location and customer complaints, but the cause could be staffing levels, local competition, or something the data never captured at all. Confusing statistical association with causal mechanism remains one of the most persistent errors across all of applied statistics, not just chi-square testing specifically.
A second misconception assumes that a nonsignificant result proves the variables are truly independent. Failing to reject a null hypothesis is not the same as confirming it. A study with a small sample size might simply lack the statistical power to detect a real but modest association, producing a large p-value that reflects insufficient data rather than genuine independence. This distinction connects directly to the difference between Type I error, wrongly rejecting a true null hypothesis, and Type II error, wrongly failing to reject a false one. A nonsignificant chi-square result could easily reflect the second kind of mistake rather than an accurate picture of reality.
Many practitioners also misunderstand what the p-value itself represents. A p-value of 0.03 does not mean there is a 3 percent chance the null hypothesis is true, nor does it mean there is a 97 percent chance a real effect exists. It means that, assuming the null hypothesis of independence holds exactly, a deviation as large as or larger than what was observed would occur about 3 percent of the time across repeated sampling. This is a statement about the behavior of a hypothetical repeated procedure, not a direct probability statement about the specific hypothesis at hand. The distinction sounds pedantic until it gets applied incorrectly in a report, at which point it can mislead an entire decision.
Another common error involves treating the chi-square test as appropriate for any dataset regardless of size or structure. The test relies on an approximation that works well when expected frequencies in each cell are reasonably large, typically discussed in terms of the minimum expected frequency rule. When categories contain very few expected observations, the sparse cell problem emerges, and the chi-square approximation to the true sampling distribution breaks down. Running the standard test on a table full of small counts without adjustment, without considering Fisher's exact test as an alternative, produces unreliable p-values that can mislead in either direction.
A related misconception involves conflating the three distinct chi-square applications: the goodness-of-fit test, the test for homogeneity, and the test for independence. These use the same core statistic and the same underlying distribution, but they answer different questions and arise from different sampling designs. Someone comparing a single sample's category proportions against a theoretical distribution is doing a goodness-of-fit test. Someone comparing category proportions across several independent samples is testing for homogeneity. Someone examining whether two variables measured on the same sample are related is testing for independence. Blurring these distinctions leads to muddled hypotheses and confused write-ups, even when the arithmetic comes out fine.
Some analysts also assume that a large chi-square statistic automatically implies a large, important effect. Because the chi-square statistic grows with sample size even when the underlying association stays constant, a massive dataset can produce a tiny p-value attached to an association too small to matter in practice. This is precisely why effect size measures like Cramér's V exist alongside the significance test, a topic developed fully in a later chapter. Reporting only a p-value from a study with hundreds of thousands of observations, without any accompanying effect size, routinely overstates the practical importance of a finding that a smaller study would have correctly flagged as trivial.
Another misconception treats degrees of freedom as a mechanical afterthought rather than a meaningful reflection of a table's structure. The degrees of freedom for a chi-square test derive from the number of categories or the dimensions of a contingency table, and this number directly shapes which chi-square distribution applies for comparison. Skipping past this step, or applying a memorized formula without understanding where it comes from, makes it hard to catch errors when a table gets restructured or when categories get merged.
People sometimes assume that if a chi-square test comes back significant, any post-hoc comparison between specific category pairs is automatically valid without further correction. In reality, testing many pairwise comparisons after an overall significant result raises the multiple testing problem, inflating the chance of false positives unless something like the Bonferroni correction gets applied. Skipping this step and simply eyeballing which cells "look different" after a significant omnibus test is a common way that analysts convince themselves of patterns that closer scrutiny would not support.
A final misconception, more philosophical than technical, treats the entire frequentist framework behind chi-square testing as the only legitimate way to reason about categorical data. Frequentist inference and Bayesian inference offer genuinely different ways of framing the same evidence, and a Bayes factor can sometimes tell a more nuanced story than a p-value alone, particularly when comparing the strength of evidence for competing hypotheses rather than simply rejecting or failing to reject one fixed null. Treating the classical chi-square approach as the single correct lens forecloses on alternative framings that later chapters introduce as legitimate complements rather than competitors.
Clearing away these misconceptions early matters because each one, left unchecked, compounds through an analysis. A person who misunderstands p-values will likely also misjudge effect size, and a person who ignores the sparse cell problem will likely also skip the correction methods that address it. The chapters ahead untangle these threads one at a time, building toward a coherent, defensible way of using chi-square testing rather than a collection of memorized rules applied without understanding.
What You'll Learn in This Book
The book moves in a deliberate sequence, starting from conceptual foundations before introducing any formula. The chapter on categorical data and statistical independence lays the groundwork by defining what a categorical variable actually is, distinguishing it from ordinal or continuous data, and explaining statistical independence as a formal probability concept rather than an intuitive notion of "unrelated." This chapter also introduces the contingency table, the structure that organizes observed frequency counts across combinations of categories and that underlies almost every chi-square application discussed later.
From there, the mathematical foundation chapter derives the chi-square formula step by step, showing exactly how observed frequency and expected frequency combine into a single statistic, and why squaring and dividing by expected frequency produces a measure with useful mathematical properties. This chapter also introduces the chi-square distribution itself, explaining how it arises from sums of squared standard normal variables and why degrees of freedom determine its exact shape. Understanding this derivation removes the sense that the formula is arbitrary and replaces it with an appreciation for why the test works mathematically.
A chapter on methodological foundations follows, covering the assumptions that must hold before trusting any chi-square result. This includes a careful treatment of the minimum expected frequency rule and what counts as a violation serious enough to require an alternative approach. It also covers independence of observations, a separate concept from the independence being tested between variables, referring instead to the requirement that each observation in a sample not influence another. Confusing these two senses of independence is a subtle but real source of errors, and this chapter draws the line clearly.
The three applications chapter distinguishes the goodness-of-fit test, the test for homogeneity, and the test for independence with worked examples for each, showing how the same underlying statistic answers three different practical questions depending on how the data was collected and what hypothesis is being tested. Readers leave this chapter able to identify, given a real dataset and research question, exactly which of the three tests applies and why the others would be inappropriate choices.
A chapter on hypothesis testing and philosophical frameworks digs into the logic of null hypothesis significance testing as it applies specifically to chi-square, unpacking what a p-value genuinely communicates and contrasting frequentist inference with Bayesian inference. This chapter does not advocate for one philosophy over the other but instead equips readers to recognize which framework underlies a given analysis and to interpret results accordingly, since the same data can support different but equally valid statistical narratives depending on the framework applied.
The effect size chapter shifts attention from whether an association exists to how large it is, introducing Cramér's V and the related phi coefficient as tools for quantifying association strength independent of sample size. Worked examples show how two datasets with identical p-values can have very different effect sizes, and how two datasets with wildly different p-values can share a similar underlying effect size once sample size differences are accounted for. This chapter draws a firm line between statistical significance and practical significance, a distinction that recurs throughout applied statistics generally.
A chapter dedicated to common pitfalls consolidates practical troubleshooting: what to do about the sparse cell problem beyond simply collapsing categories, how the multiple testing problem shows up specifically in chi-square work and how the Bonferroni correction addresses it, and a catalog of interpretation errors gathered from how the test tends to get misused in published research and everyday analysis. This chapter functions as a diagnostic checklist, useful to revisit before finalizing any chi-square analysis.
The modern approaches chapter closes the technical content by introducing simulation-based methods including the permutation test and Monte Carlo simulation, along with Bayesian alternatives built around the Bayes factor and computational techniques like bootstrap resampling. These methods do not replace classical chi-square testing so much as extend it, offering ways to get valid inference when classical assumptions fail or when a richer, more nuanced answer than a single p-value is needed.
Across all of this, certain threads recur deliberately. The distinction between statistical significance and practical significance appears in the effect size chapter but echoes back through the pitfalls chapter and the modern approaches chapter as well. The concept of degrees of freedom, introduced mathematically early on, resurfaces every time a new application of the test gets introduced, since each application computes degrees of freedom slightly differently depending on table structure. These recurring threads are intentional, designed to reinforce ideas through repetition in new contexts rather than through isolated one-time explanations.
By the final technical chapter, the goal is for chi-square testing to feel less like a fixed recipe and more like a flexible framework with clear boundaries. Someone who finishes the book should be able to look at a new categorical dataset, correctly identify which chi-square application fits, check whether assumptions hold, compute and interpret both significance and effect size, and know when to reach for a computational alternative instead. That combination of technical skill and conceptual judgment is the actual target of the chapters ahead, more so than fluency with any single formula.
How to Use This Guide
The chapters are ordered to build cumulatively, with each one assuming familiarity with terms and ideas introduced earlier. A reader working through the book for the first time should move through the chapters in order rather than skipping ahead, since later chapters, particularly the ones on effect size and pitfalls, use vocabulary like expected frequency and degrees of freedom without redefining them. Someone who already has a solid grip on categorical data and contingency tables from prior coursework might move quickly through the first chapter, but skipping it entirely risks missing the specific way this book defines statistical independence, which the philosophical discussions later depend on.
Readers who already run chi-square tests regularly in a statistical software package but want to firm up conceptual understanding might treat the book somewhat differently, using the mathematical foundation chapter and the hypothesis testing chapter as the priority reading, then dipping into the pitfalls chapter to audit past work for the specific errors it catalogs. This kind of targeted reading works because each chapter, while building on earlier ideas, still stands reasonably well as a self-contained reference once the foundational vocabulary from the first two chapters is in hand.
Every subchapter includes worked examples designed to be followed with pencil and paper, or replicated in whatever statistical software a reader prefers. Trying to absorb the formulas by reading alone, without working through at least one example by hand, tends to leave the material feeling more abstract than it needs to be. The chi-square statistic in particular becomes far more intuitive once someone has personally computed expected frequencies from marginal frequencies and watched how the statistic responds to changing one cell value while holding the rest constant.
A practical habit worth adopting while reading: keep a running dataset, even a small invented one, and apply each new concept to it as the chapters progress. Starting with a simple two-by-two contingency table (say, treatment received against outcome achieved) makes it possible to compute a goodness-of-fit comparison, then later a test for independence, then an effect size, then a permutation test, all on the same familiar numbers. Watching how each new technique treats the same data reveals connections between chapters that might otherwise stay hidden if every example uses a fresh, unrelated dataset.
The glossary near the end of the book serves as a quick-reference point for any term that feels unfamiliar partway through a chapter. Rather than flipping backward through earlier chapters to relocate a definition, checking the glossary first is usually faster and keeps momentum through the current chapter intact. Terms in the glossary match the canonical vocabulary used consistently across every chapter, so a definition found there will match how the term gets used everywhere else in the book.
For readers who plan to apply chi-square testing to their own data soon after reading, working through the pitfalls chapter a second time immediately before starting that real analysis is a reasonable strategy. Concepts like the sparse cell problem and the multiple testing problem are easy to nod along with in the abstract but easy to forget in the middle of an actual analysis under time pressure. A quick second pass through that chapter right before applying the test to real data can catch mistakes before they happen rather than after.
The further reading section at the end of the book points toward the original sources and deeper technical treatments for readers who want to go beyond what an introductory or intermediate treatment can cover. This is particularly relevant for the Bayesian material in the modern approaches chapter, which touches on ideas that have their own extensive literature well beyond what a single chapter can address. Treating that chapter as a starting point rather than a final word on Bayesian categorical analysis will serve readers who want to specialize further.
Instructors or study groups using this book as a course text might consider pairing each technical chapter with a small dataset assignment, asking learners to apply that chapter's specific technique before moving to the next chapter. Because the chapters build sequentially, this kind of paced, hands-on approach mirrors how the book itself is structured and tends to produce stronger retention than reading straight through without pausing to apply each idea.
Readers primarily interested in the philosophical material, particularly the frequentist versus Bayesian discussion, can read the hypothesis testing chapter and the modern approaches chapter somewhat independently of the more mechanical middle chapters, though understanding basic p-value logic first, covered early in the hypothesis testing chapter, remains a prerequisite for the Bayesian comparison to make sense. Approaching the book this way sacrifices some of the cumulative structure but can suit a reader who already computes chi-square tests routinely and wants primarily to deepen conceptual understanding rather than relearn mechanics already familiar from other sources.
Whatever path through the material a reader chooses, the chapters are written to reward a second pass. Concepts like degrees of freedom and expected frequency show up early in a fairly mechanical form and later carry philosophical weight once the hypothesis testing and effect size chapters reframe them. Returning to earlier chapters after finishing the book, with the fuller picture in mind, often clarifies details that felt like arbitrary rules on a first read but reveal themselves as necessary consequences of the test's underlying logic once that logic is fully in view.
Notes
Introduction
- 1. Karl Pearson, "On the Criterion that a Given System of Deviations from the Probable in the Case of a Correlated System of Variables is Such that it can be Reasonably Supposed to have Arisen from Random Sampling," Philosophical Magazine, 1900
This is the end of the free sample. The full book has 8 chapters.
Want this book written for you?
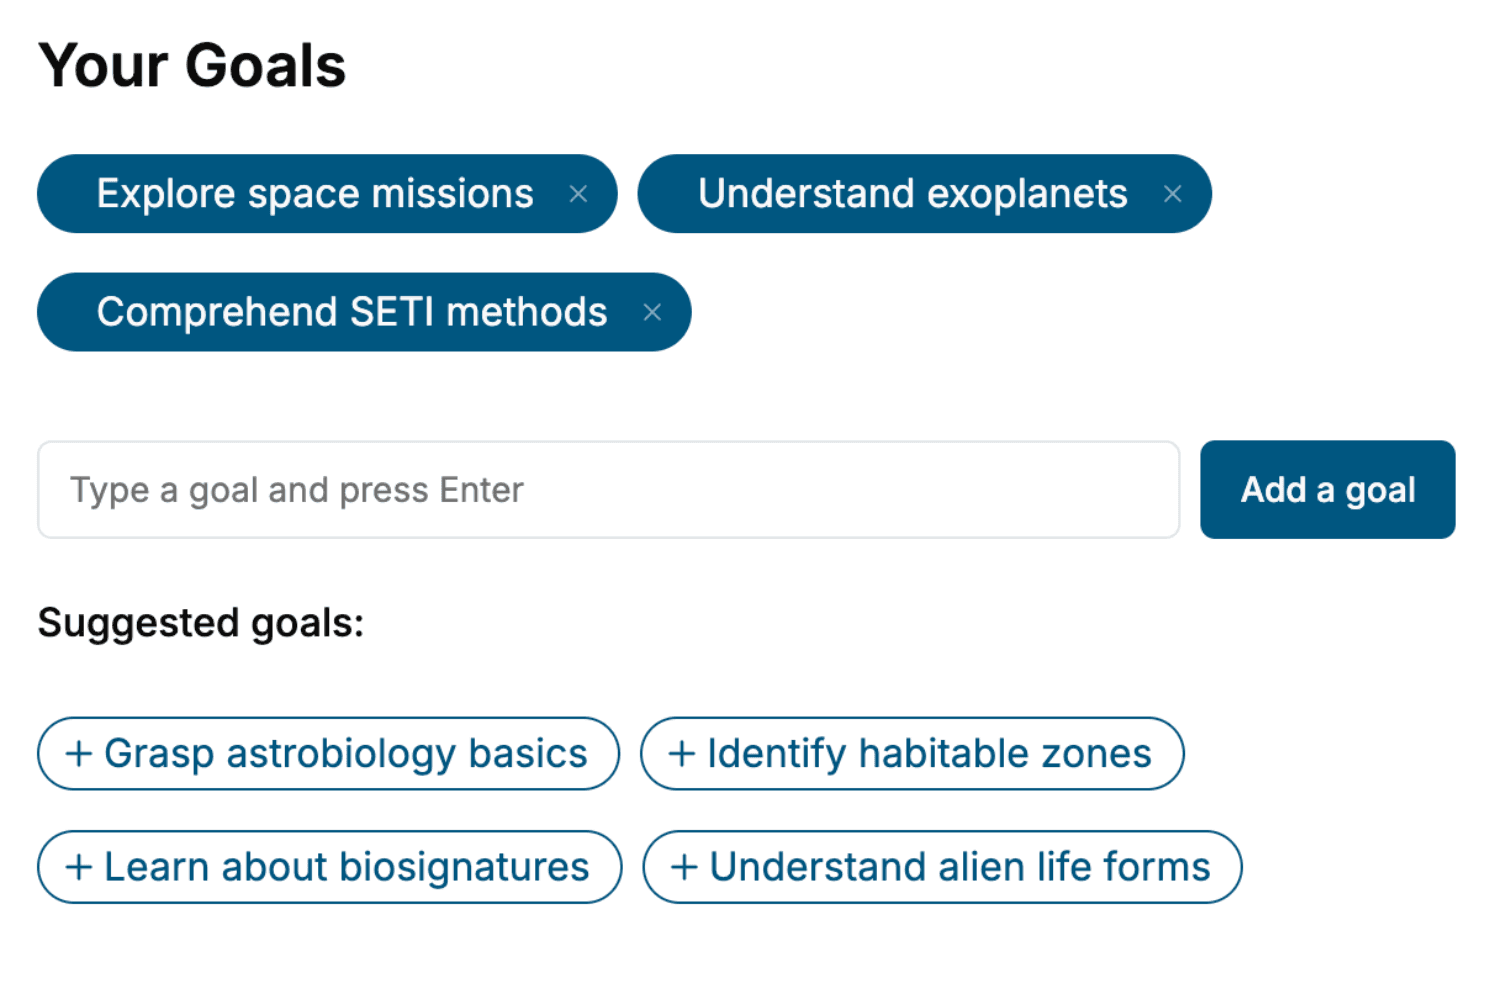
Tell us your goals and background, and get your own version of this book, tailored by AI to you.


Benefits of AI-tailored books
- Read one book, not ten:
- all the Statistics knowledge you need, gathered into a single book.
- Save days of learning:
- tell us your goals, choose your topics, and the whole book is built around them.
- Learn effortlessly:
- Statistics book written for your specific background and expertise.
- Understand at a glance:
- includes charts, tables, timelines, checklists, decision trees, and more.
- Stay current:
- written the day you order it, not years ago.
- Trust what you read:
- every book is checked for accuracy, with real research when your subject needs it.
Create your unique book in 3 steps
- 1. Select your focus
Select the focus of your Statistics book and share your background
- 2. Personalize your book
Specify your goals and choose sub-topics to include
- 3. Get your tailored book
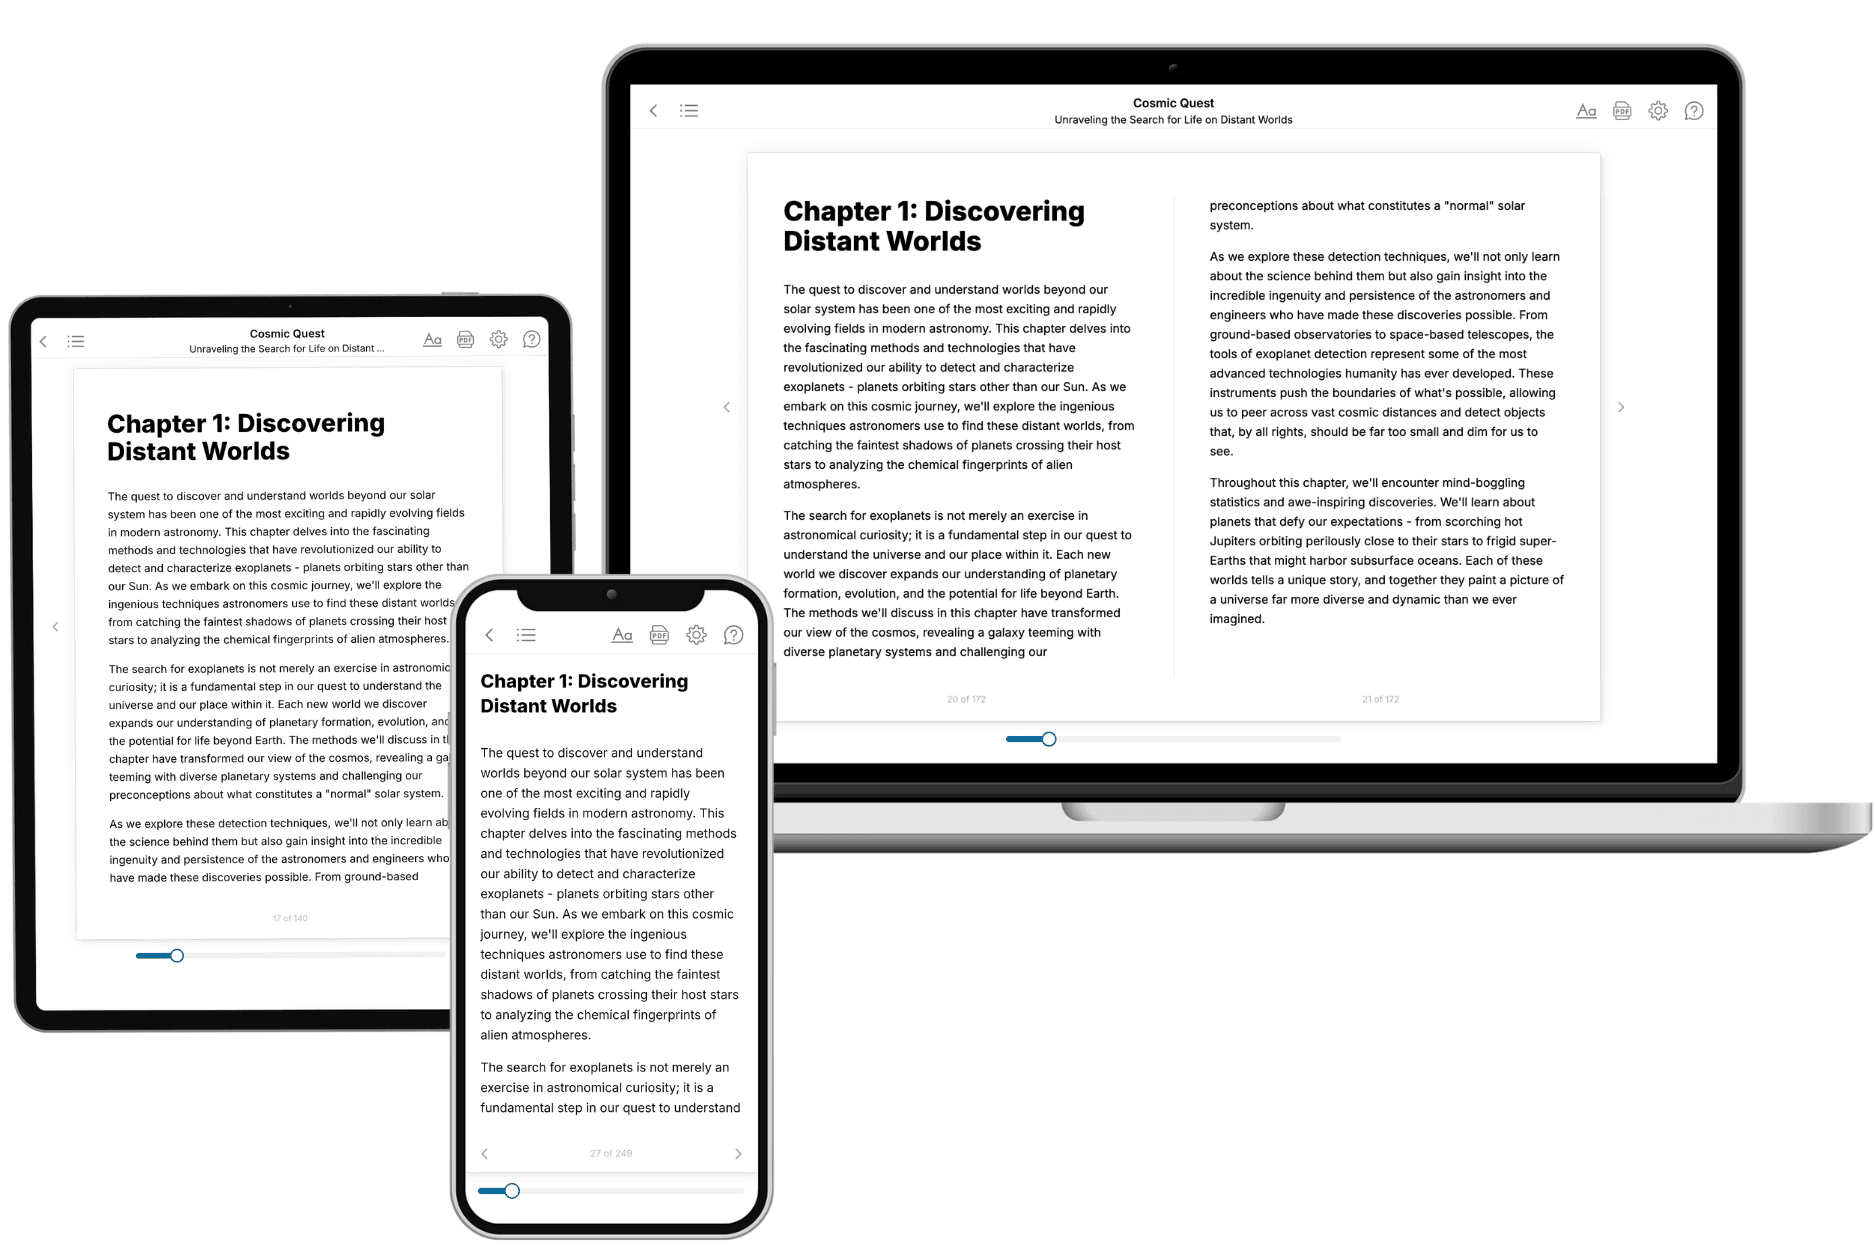
Your book is ready in 10 minutes. Read it online, download as EPUB or PDF, or send to Kindle.

Frequently asked questions
- What is TailoredRead?
TailoredRead creates complete, full-length nonfiction ebooks, written specifically for you. Tell us what you want to learn and why, and TailoredRead writes you a complete ebook on it, with charts, tables, and diagrams throughout. Read it online, on Kindle, or on any e-reader, or download it as a PDF or EPUB. Every book is written fresh the day you order it.
- How is the book tailored to me?
Before anything is written, you answer a few short questions about your goals, your background, and the topics you care about. Your book is then planned around your answers: written at your level, focused on your goals, and covering the topics you chose, instead of the one-size-fits-all book a store sells everyone.
- Will it read like generic AI content?
No. Your book isn't a chat transcript: it's planned chapter by chapter before a single word is written, told in a clear book voice, and explains ideas visually with charts, tables, and diagrams. After writing, every book goes through an editorial pass that polishes chapters so the book reads consistent from start to finish. Judge for yourself: browse thousands of sample books on our Explore Books page.
- How accurate is the content?
Our AI first checks whether your subject needs live research. Niche and fast-moving subjects are researched before writing, and the book plan and chapters are grounded in what it finds. After writing, every book goes through a quality pass that checks its facts and consistency, and researched books list their sources in a Notes section at the back.
- How long is the book?
You choose the length: Comprehensive (250-300 pages), Detailed (150-200 pages), Essential (70-100 pages), or Short (30-50 pages).
- Does the book include visuals?
Yes. Every book includes charts, tables, and diagrams: timelines, checklists, step-by-step guides, decision trees, comparison tables, matrices, and bar charts. A typical book includes dozens of these visual elements.
- Can I read it on Kindle? What formats can I download?
Yes. Every book can be read in our online reader or downloaded as a PDF or EPUB. The EPUB can be opened with Kindle, Apple Books, Kobo, and any e-reader. The Commercial and Author licenses also include an editable Word (DOCX) and Markdown download.
- How much does it cost?
About the price of a regular ebook. The exact price depends on your book's length and complexity, from $2 for the shortest books to $35 for the most comprehensive, and it's shown when you review your book, before you commit to anything. Each book is a one-time purchase, yours to keep, no subscription. Licenses that let you share, teach, or publish your book range from $35.99 to $49.99.
- Can I preview the book before purchasing?
Before you pay, you'll see what your book will cover: the title, a detailed description, the estimated length, and the complete chapter-by-chapter table of contents, so you know what you're getting before you decide. The full text itself is written after you purchase.
- How long does it take to create a book?
About 10 minutes. You can start reading the opening chapters while the rest is still being written.