The Choropleth Mapper's Guide
Creating Compelling World Maps for Travel, Exploration, and Geographic Storytelling
Create stunning visual stories that bring the world to life through the power of choropleth mapping.
315 pages17 chaptersOct 7, 2025Map
About this book
Whether you're planning epic adventures, researching global patterns, or simply fascinated by the art of cartography, this comprehensive guide transforms complex geographic data into clear, compelling visual narratives. You'll discover how to select the right data sources, choose effective color schemes, and apply proven classification methods that reveal meaningful patterns across continents and cultures. From climate and terrain visualization to population density and cultural mapping, you'll learn to create maps that not only inform but inspire wanderlust and geographic curiosity. This practical handbook bridges the gap between traditional cartographic principles and modern digital tools, showing you how to avoid common design pitfalls while maximizing visual impact. You'll explore real-world applications for travel planning, outdoor recreation, and geographic education, with step-by-step techniques for both static and interactive map creation. Transform your understanding of the world through the lens of effective choropleth design, and gain the skills to communicate geographic insights that captivate audiences and drive exploration. Your journey into the art and science of world mapping begins here.
Table of contents
- IntroductionThe Digital Mapping Revolution, The Power of Choropleth Visualization, Applications for Travel and Exploration, How to Use This BookRead below
- Chapter 1: Foundations of Choropleth MappingWhat Makes a Choropleth Map, A Brief History of Thematic Cartography, Modern Applications and Use Cases, Core Design Principles
- Chapter 2: Understanding Geographic DataTypes of Geographic Data, Finding Reliable Data Sources, Evaluating Data Quality and Reliability, Preparing Data for Mapping
- Chapter 3: Essential Statistical ConceptsData Normalization and Standardization, Understanding Data Distributions, Identifying and Handling Outliers, Recognizing Spatial Patterns and Correlations
- Chapter 4: Data Classification MethodsEqual Intervals Classification, Quantile-Based Classifications, Natural Breaks (Jenks) Method, Standard Deviation Classification, Choosing the Right Classification Method
- Chapter 5: Color Theory and Palette SelectionColor Theory Fundamentals, Sequential Color Schemes, Diverging Color Schemes, Qualitative Color Schemes, Color Accessibility and Universal Design
- Chapter 6: World Map Projections and Coordinate SystemsUnderstanding Map Projections, Popular World Map Projections, Dealing with Projection Distortions, Coordinate Systems and Datums
- Chapter 7: Essential Design ElementsCreating Effective Legends, Titles and Labeling Strategies, Scale Indicators and Reference Elements, Layout and Composition Principles
- Chapter 8: Climate and Weather MappingVisualizing Global Temperature Patterns, Mapping Precipitation and Rainfall, Showing Seasonal Climate Variations, Mapping Extreme Weather Events
- Chapter 9: Terrain and Elevation VisualizationWorking with Digital Elevation Models, Topographic Representation Techniques, Slope and Aspect Analysis, Terrain Classification Systems
- Chapter 10: Population and Demographic MappingPopulation Density Visualization, Age, Gender, and Social Demographics, Urban vs Rural Population Patterns, Visualizing Migration and Movement
- Chapter 11: Cultural and Social MappingLanguage Distribution Mapping, Defining and Mapping Cultural Regions, Religious and Belief System Patterns, Cultural Diversity Indicators
- Chapter 12: Travel Planning ApplicationsComparing Travel Destinations, Seasonal Travel Optimization, Visualizing Travel Considerations, Route Planning and Accessibility
- Chapter 13: Outdoor Recreation MappingActivity Suitability Mapping, National Parks and Protected Areas, Trail Networks and Hiking Routes, Seasonal Outdoor Activity Planning
- Chapter 14: Digital Tools and SoftwareGeographic Information Systems (GIS), Web-Based Mapping Platforms, Programming Languages for Mapping, Choosing the Right Tool for Your Project
- Chapter 15: Interactive and Dynamic MappingPrinciples of Interactive Design, User Interface Design for Maps, Animation and Temporal Visualization, Responsive and Mobile-Friendly Maps
- Chapter 16: Avoiding Common PitfallsPreventing Misleading Visualizations, Common Design and Layout Errors, Avoiding Data Misrepresentation, Quality Control and Review Processes
- Chapter 17: Advanced Visualization TechniquesBivariate Choropleth Mapping, Multi-Temporal Comparisons, Visualizing Data Uncertainty, Combining Choropleth with Other Methods
- Conclusion
- Glossary
Introduction
The world has never been more connected, yet understanding global patterns and relationships remains one of humanity's greatest challenges. Every day, millions of travelers plan journeys across continents, researchers analyze climate data spanning decades, and outdoor enthusiasts seek the perfect destinations for their next adventures. Behind each of these endeavors lies a fundamental need to visualize and comprehend geographic information in ways that reveal meaningful patterns and insights. This is where the art and science of choropleth mapping transforms raw data into compelling visual stories that can guide decisions, inspire exploration, and deepen our understanding of our planet.
Choropleth maps represent one of the most powerful and accessible forms of geographic visualization available today. By using color variations across defined geographic boundaries, these maps can instantly communicate complex patterns that might take pages of text to describe. Whether you're examining global temperature variations to plan a winter escape, analyzing population density to understand urbanization trends, or visualizing cultural diversity to enhance your travel experiences, choropleth mapping provides the visual language needed to make sense of our complex world. The technique bridges the gap between abstract data and intuitive understanding, making geographic insights accessible to both experts and enthusiasts alike.
The democratization of mapping technology has placed unprecedented power in the hands of individuals who previously would have needed specialized training and expensive software to create professional-quality maps. Today's digital tools, from web-based platforms to sophisticated programming libraries, enable anyone with curiosity and dedication to transform geographic data into meaningful visualizations. However, this accessibility comes with responsibility. Creating effective choropleth maps requires more than just technical skills; it demands understanding of cartographic principles, statistical concepts, and design theory that ensure your visualizations communicate accurately and compellingly. This book serves as your comprehensive guide through both the technical and theoretical aspects of choropleth mapping, ensuring you can harness these powerful tools effectively.
The Digital Mapping Revolution
The transformation of cartography from a specialized craft practiced by trained professionals to an accessible skill available to anyone with a computer represents one of the most significant democratizations of knowledge in recent history. Traditional map-making required years of training, expensive equipment, and access to carefully guarded geographic databases. Today, satellite imagery, census data, climate records, and countless other geographic datasets are freely available online, while powerful mapping software can be accessed through web browsers or downloaded at no cost. This revolution has fundamentally changed who can create maps and what stories can be told through geographic visualization.
The speed and scale of this transformation become apparent when you consider that Google Earth, which brought satellite imagery to millions of personal computers, was only launched in 2005. OpenStreetMap, the collaborative mapping project that now provides detailed geographic data for much of the world, began just one year earlier. Web-based mapping platforms like Leaflet and D3.js have made it possible to create interactive, publication-quality maps using nothing more than a text editor and web browser. These developments have compressed decades of traditional cartographic learning into accessible tutorials and user-friendly interfaces, enabling rapid creation of sophisticated visualizations that would have required teams of specialists just twenty years ago.
This accessibility has sparked an explosion of creative applications across diverse fields and interests. Travel bloggers now create detailed climate maps to help readers choose optimal destinations for specific activities. Environmental researchers produce compelling visualizations that communicate climate change impacts to broader audiences. Urban planners develop interactive maps that engage communities in development discussions. Outdoor recreation enthusiasts map trail conditions, wildlife sightings, and seasonal accessibility patterns. Each of these applications demonstrates how digital mapping tools have expanded beyond traditional academic and professional contexts to serve practical, personal, and creative purposes.
However, the democratization of mapping technology has also introduced new challenges and responsibilities. The ease of creating visually appealing maps can mask fundamental errors in data interpretation, statistical analysis, or design principles. Misleading visualizations can spread rapidly through social media and online platforms, potentially influencing important decisions about travel, residence, or resource allocation. The abundance of available data sources varies dramatically in quality, accuracy, and currency, requiring users to develop critical evaluation skills that were once the exclusive domain of professional cartographers. Understanding these challenges is essential for anyone seeking to create effective and responsible choropleth maps.
The current landscape of digital mapping represents both unprecedented opportunity and significant responsibility. Modern tools provide the technical capability to create sophisticated visualizations, but they cannot substitute for understanding the principles that make maps effective, accurate, and ethical. The most successful contemporary mapmakers combine technical proficiency with solid grounding in cartographic theory, statistical analysis, and design principles. They understand that powerful tools amplify both good and bad practices, making foundational knowledge more important than ever. This book aims to provide that foundational knowledge while teaching you to leverage modern digital tools effectively.
Looking forward, the digital mapping revolution continues to accelerate with developments in artificial intelligence, real-time data processing, and immersive visualization technologies. Machine learning algorithms can now identify patterns in geographic data that would take human analysts months to discover. Real-time data streams enable maps that update continuously as conditions change. Virtual and augmented reality technologies promise new ways to experience and interact with geographic information. These emerging capabilities will further expand the possibilities for choropleth mapping while reinforcing the importance of understanding fundamental principles that guide effective visualization design.
The transformation of mapping from specialized craft to accessible skill has created opportunities for anyone interested in understanding and communicating geographic patterns. Whether your interests lie in travel planning, outdoor recreation, environmental awareness, or simply satisfying curiosity about global patterns, you now have access to tools and data that can support sophisticated analysis and compelling visualization. The key to success lies in combining this technological capability with solid understanding of the principles and practices that make maps both accurate and effective. This foundation enables you to create visualizations that not only look professional but also communicate insights clearly and responsibly.
The Power of Choropleth Visualization
Choropleth maps possess a unique ability to transform abstract numerical data into immediate visual understanding through the strategic use of color variations across geographic boundaries. This visualization technique leverages fundamental aspects of human visual perception, particularly our ability to quickly distinguish color differences and associate them with spatial patterns. When you view a well-designed choropleth map showing global temperature variations, you can instantly identify the hottest and coldest regions, recognize gradual transitions between climate zones, and spot unusual patterns that might indicate interesting geographic phenomena. This immediate comprehension represents a cognitive shortcut that would be impossible to achieve through tables of numbers or lengthy textual descriptions.
The effectiveness of choropleth visualization stems from its ability to reveal patterns that exist at multiple scales simultaneously. A single map can show broad continental trends while also highlighting local variations and exceptions to general patterns. For example, a choropleth map of global precipitation immediately reveals the major desert regions, tropical rainforest zones, and temperate climate areas, while also showing how mountain ranges create rain shadows and how coastal areas differ from interior regions. This multi-scale pattern recognition enables viewers to understand both the big picture and important details in a single visualization, making choropleth maps particularly valuable for exploratory analysis and communication.
The psychological impact of color in choropleth maps extends beyond simple pattern recognition to emotional and intuitive responses that can enhance understanding and memory. Warm colors naturally suggest heat, energy, or intensity, while cool colors evoke calm, cold, or low activity. These associations, when used appropriately, create maps that feel intuitive and memorable. A temperature map using red for hot areas and blue for cold regions aligns with universal color associations, making the visualization immediately understandable across cultural and linguistic boundaries. This intuitive quality makes choropleth maps particularly effective for communicating with diverse audiences and for creating lasting impressions that support decision-making and learning.
Choropleth maps excel at revealing spatial relationships and correlations that might not be apparent in other forms of data presentation. When you create maps showing different variables for the same geographic areas, patterns of correlation, causation, and exception become visually apparent. For instance, comparing choropleth maps of elevation, precipitation, and population density can reveal how topography influences climate patterns, which in turn affect human settlement patterns. These spatial relationships are fundamental to understanding geography, ecology, and human systems, making choropleth visualization an essential tool for anyone seeking to understand how different factors interact across space.
The comparative power of choropleth maps enables rapid assessment of alternatives and identification of optimal choices for specific criteria. Travel planners can compare maps showing temperature, precipitation, tourist density, and cost of living to identify destinations that meet their specific preferences and constraints. Outdoor enthusiasts can overlay maps of terrain difficulty, weather patterns, and accessibility to find ideal locations for particular activities. This comparative capability transforms decision-making from a process of reading through multiple sources of information to a visual comparison that can be completed in minutes rather than hours.
Modern choropleth mapping extends beyond static visualization to include interactive and dynamic capabilities that further enhance their analytical power. Interactive maps allow users to explore data at different scales, toggle between different variables, and access detailed information for specific locations. Time-series choropleth maps can show how patterns change over seasons, years, or decades, revealing trends and cycles that would be impossible to detect in static visualizations. These dynamic capabilities transform choropleth maps from simple presentation tools into powerful analytical instruments that support deep exploration and understanding of geographic phenomena.
The standardization and widespread recognition of choropleth mapping conventions have created a visual language that transcends cultural and linguistic boundaries. The basic concept of using color intensity or hue to represent data values is understood intuitively by viewers worldwide, making choropleth maps effective for international communication and collaboration. This universal accessibility has contributed to their adoption across diverse fields, from academic research and government policy to journalism and public education. Understanding how to create and interpret choropleth maps has become a valuable literacy skill in our increasingly data-driven and globally connected world.
The power of choropleth visualization lies not just in its ability to display data, but in its capacity to generate insights, support decisions, and inspire action. A well-crafted choropleth map can reveal previously hidden patterns, challenge assumptions about geographic relationships, and motivate viewers to explore new places or consider different perspectives. This transformative potential makes choropleth mapping more than just a technical skill; it becomes a tool for discovery, communication, and understanding that can enhance both personal interests and professional capabilities. Mastering this visualization technique opens doors to deeper geographic literacy and more effective communication of spatial insights.
Applications for Travel and Exploration
Travel planning has been revolutionized by the ability to visualize global patterns through choropleth mapping, transforming the process from relying on guidebooks and travel agent recommendations to making informed decisions based on comprehensive geographic data. Modern travelers can create detailed choropleth maps showing seasonal temperature variations, precipitation patterns, tourist density, accommodation costs, and safety indicators to identify optimal destinations and timing for their specific interests and constraints. For example, a traveler seeking warm, dry conditions with moderate tourist crowds can overlay maps of these three variables to identify regions and seasons that meet all criteria simultaneously. This data-driven approach to travel planning enables more satisfying experiences while avoiding common pitfalls like arriving during monsoon seasons or peak tourist periods.
Adventure travelers and outdoor enthusiasts have found choropleth mapping particularly valuable for identifying and comparing potential destinations for specific activities. Mountaineers can create maps showing elevation ranges, seasonal weather patterns, and accessibility to identify optimal climbing locations and timing. Surfers can map wave heights, water temperatures, and seasonal wind patterns to plan trips that maximize their chances of ideal conditions. Wildlife photographers can overlay maps of animal migration patterns, seasonal behavior, and park accessibility to optimize their chances of capturing desired shots. These specialized applications demonstrate how choropleth mapping can support highly specific interests and requirements that would be difficult to research through traditional travel resources.
Cultural exploration benefits significantly from choropleth mapping techniques that can visualize language distributions, religious patterns, cultural diversity indices, and historical influences across regions. Travelers interested in experiencing linguistic diversity can create maps showing the number of languages spoken in different regions, helping them plan routes that maximize cultural exposure. Food enthusiasts can map culinary traditions, agricultural patterns, and regional specialties to design gastronomic tours that follow logical geographic and cultural progressions. Art and architecture lovers can visualize the distribution of different artistic traditions, historical periods, and cultural influences to create itineraries that tell coherent stories about human creativity and cultural development.
Budget-conscious travelers have discovered that choropleth mapping can reveal significant cost variations that correlate with geographic patterns, enabling strategic planning that maximizes travel experiences while minimizing expenses. Maps showing accommodation costs, meal prices, transportation expenses, and activity fees can identify regions where travel budgets stretch furthest. Currency exchange rates, seasonal price variations, and economic development levels can be visualized to reveal optimal timing and routing for cost-effective travel. For example, a choropleth map might reveal that traveling overland from expensive Western European countries through gradually less expensive Eastern European regions can provide cultural variety while managing budget constraints effectively.
Safety and health considerations for international travel can be effectively communicated through choropleth maps that visualize disease prevalence, crime rates, political stability, natural disaster risks, and healthcare quality. These maps enable travelers to make informed decisions about destinations, required precautions, and appropriate insurance coverage. Medical tourism, increasingly popular for both cost savings and quality care, benefits from choropleth maps showing healthcare quality indices, treatment costs, and recovery environment factors. Adventure travelers can map rescue service availability, communication coverage, and emergency facility access to plan appropriately challenging expeditions with adequate safety margins.
Seasonal travel optimization represents one of the most practical applications of choropleth mapping for both casual and serious travelers. Maps showing temperature ranges, precipitation patterns, daylight hours, and seasonal activity availability can reveal optimal timing for specific destinations and activities. Shoulder season identification becomes straightforward when you can visualize the transitions between peak and off-peak conditions across different regions. For example, a choropleth map might show that while Mediterranean Europe experiences peak tourist season in July and August, similar climate conditions exist in the Balkans with significantly fewer crowds and lower costs during the same period.
Transportation planning benefits from choropleth maps that visualize infrastructure quality, connectivity, and seasonal accessibility across different regions. Overland travelers can map road conditions, border crossing efficiency, and fuel availability to plan realistic routes and schedules. Public transportation quality, coverage, and cost can be visualized to identify regions where car rental might be necessary versus areas where public transit provides adequate access. Seasonal accessibility variations, particularly important for mountain and remote region travel, can be mapped to ensure routes remain passable during planned travel periods.
The integration of real-time data with choropleth mapping has created new possibilities for dynamic travel planning that responds to changing conditions. Weather pattern maps can be updated continuously to help travelers avoid storms or seek optimal conditions. Political situation maps can reflect changing safety conditions and travel advisories. Disease outbreak maps can inform health precautions and destination modifications. This dynamic capability transforms travel planning from a static process completed before departure to an ongoing optimization that continues throughout the journey, enabling travelers to adapt to changing conditions while maintaining their core travel objectives.
How to Use This Book
This book is structured as a progressive journey from fundamental concepts to advanced applications, designed to accommodate readers with varying levels of experience while ensuring everyone develops a solid foundation in choropleth mapping principles. The early chapters establish essential theoretical knowledge about cartography, statistics, and design that underlies all effective mapping, while later chapters focus on practical applications and advanced techniques. You can approach this book in several ways depending on your current knowledge level and immediate goals. Beginners should work through the chapters sequentially to build comprehensive understanding, while readers with some mapping experience might focus on specific chapters that address their particular interests or knowledge gaps.
Each chapter combines theoretical explanation with practical examples and actionable guidance, ensuring you can immediately apply what you learn. The theoretical sections provide the conceptual framework necessary for making informed decisions about data selection, classification methods, and design choices. Practical examples demonstrate how these concepts apply to real-world mapping scenarios, using datasets and situations you're likely to encounter in your own projects. Step-by-step guidance walks you through specific techniques and processes, providing templates and frameworks you can adapt for your own mapping needs. This multi-layered approach ensures you understand not just how to create choropleth maps, but why specific approaches work better for different situations.
The book's organization reflects the typical workflow of choropleth mapping projects, from initial concept through final presentation. Early chapters focus on understanding your data and audience, middle chapters cover the technical aspects of classification and visualization, and later chapters address presentation and communication strategies. This workflow-based structure means you can use the book as a reference guide for specific project phases, returning to relevant chapters as you encounter particular challenges or opportunities. Cross-references throughout the text help you navigate between related concepts and techniques, supporting both linear reading and targeted reference use.
Special attention has been given to common challenges and pitfalls that frequently derail mapping projects, with dedicated sections on troubleshooting and quality control throughout the book. These sections draw on real-world experience to help you anticipate and avoid problems before they compromise your work. Warning boxes highlight critical decision points where mistakes are commonly made, while tip boxes provide shortcuts and best practices that can improve both efficiency and quality. This practical guidance transforms the book from a purely instructional text into a working companion that supports you through the inevitable challenges of real mapping projects.
The book includes extensive examples drawn from travel, outdoor recreation, and geographic exploration contexts, ensuring the techniques you learn directly support your interests and goals. Rather than using abstract or purely academic examples, each technique is demonstrated through scenarios you might actually encounter when planning trips, researching destinations, or exploring geographic patterns. These relevant examples make the learning process more engaging while providing templates you can adapt for your own projects. The examples progress from simple, straightforward applications to complex, multi-variable analyses that demonstrate the full potential of choropleth mapping techniques.
Technical requirements and tool recommendations are integrated throughout the text rather than relegated to separate appendices, ensuring you understand the practical implications of different approaches as you learn the underlying concepts. Software-specific instructions focus on widely available, cost-effective tools that provide professional-quality results without requiring significant financial investment. Alternative approaches are presented for different skill levels and technical preferences, from point-and-click web interfaces to programming-based solutions. This flexibility ensures you can apply the techniques regardless of your current technical background or preferred working methods.
Assessment opportunities are built into each chapter through exercises and projects that reinforce learning while building a portfolio of practical mapping skills. These exercises progress from guided practice with provided datasets to independent projects using data sources you identify and acquire. Project suggestions span a range of complexity levels and application areas, enabling you to choose challenges appropriate for your current skill level and interests. Completed exercises provide building blocks for more complex projects, creating a scaffolded learning experience that builds confidence and competence progressively.
The book concludes with advanced techniques and emerging trends that extend beyond basic choropleth mapping to explore cutting-edge approaches and future possibilities. These final chapters prepare you to continue learning and adapting as mapping technology and techniques continue to evolve. Resource lists, recommended readings, and community connections provide pathways for ongoing development and engagement with the broader mapping community. This forward-looking approach ensures your investment in learning choropleth mapping techniques will continue to pay dividends as the field evolves and your own interests and projects become more sophisticated.
This is the end of the free sample. The full book has 17 chapters.
Want this book written for you?
Tell us your goals and background, and get your own version of this book, tailored by AI to you.


Benefits of AI-tailored books
- Read one book, not ten:
- all the Map knowledge you need, gathered into a single book.
- Save days of learning:
- tell us your goals, choose your topics, and the whole book is built around them.
- Learn effortlessly:
- Map book written for your specific background and expertise.
- Understand at a glance:
- includes charts, tables, timelines, checklists, decision trees, and more.
- Stay current:
- written the day you order it, not years ago.
- Trust what you read:
- every book is checked for accuracy, with real research when your subject needs it.
Create your unique book in 3 steps
- 1. Select your focus
Select the focus of your Map book and share your background
- 2. Personalize your book
Specify your goals and choose sub-topics to include
- 3. Get your tailored book
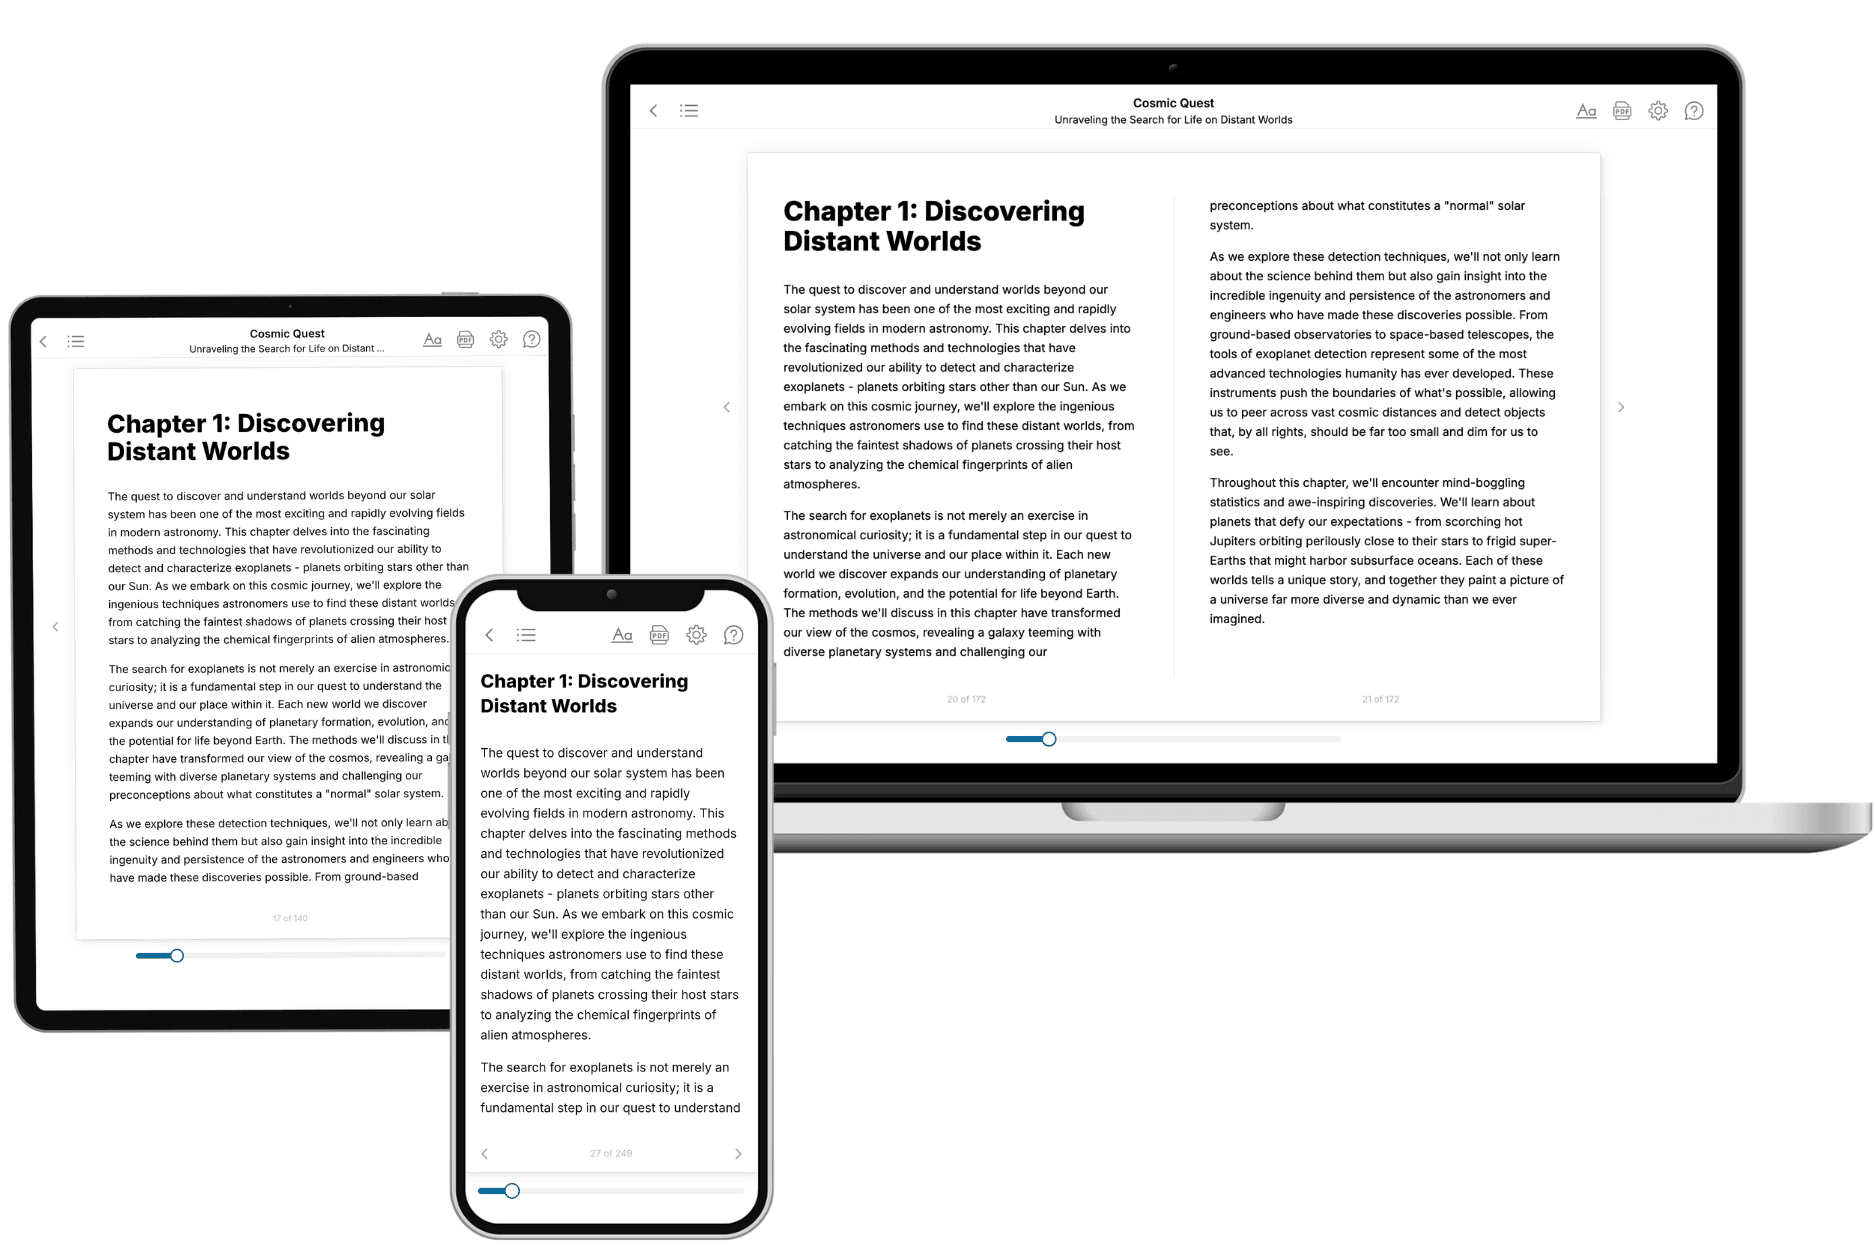
Your book is ready in 10 minutes. Read it online, download as EPUB or PDF, or send to Kindle.
Frequently asked questions
- What is TailoredRead?
TailoredRead creates complete, full-length nonfiction ebooks, written specifically for you. Tell us what you want to learn and why, and TailoredRead writes you a complete ebook on it, with charts, tables, and diagrams throughout. Read it online, on Kindle, or on any e-reader, or download it as a PDF or EPUB. Every book is written fresh the day you order it.
- How is the book tailored to me?
Before anything is written, you answer a few short questions about your goals, your background, and the topics you care about. Your book is then planned around your answers: written at your level, focused on your goals, and covering the topics you chose, instead of the one-size-fits-all book a store sells everyone.
- Will it read like generic AI content?
No. Your book isn't a chat transcript: it's planned chapter by chapter before a single word is written, told in a clear book voice, and explains ideas visually with charts, tables, and diagrams. After writing, every book goes through an editorial pass that polishes chapters so the book reads consistent from start to finish. Judge for yourself: browse thousands of sample books on our Explore Books page.
- How accurate is the content?
Our AI first checks whether your subject needs live research. Niche and fast-moving subjects are researched before writing, and the book plan and chapters are grounded in what it finds. After writing, every book goes through a quality pass that checks its facts and consistency, and researched books list their sources in a Notes section at the back.
- How long is the book?
You choose the length: Comprehensive (250-300 pages), Detailed (150-200 pages), Essential (70-100 pages), or Short (30-50 pages).
- Does the book include visuals?
Yes. Every book includes charts, tables, and diagrams: timelines, checklists, step-by-step guides, decision trees, comparison tables, matrices, and bar charts. A typical book includes dozens of these visual elements.
- Can I read it on Kindle? What formats can I download?
Yes. Every book can be read in our online reader or downloaded as a PDF or EPUB. The EPUB can be opened with Kindle, Apple Books, Kobo, and any e-reader. The Commercial and Author licenses also include an editable Word (DOCX) and Markdown download.
- How much does it cost?
About the price of a regular ebook. The exact price depends on your book's length and complexity, from $2 for the shortest books to $35 for the most comprehensive, and it's shown when you review your book, before you commit to anything. Each book is a one-time purchase, yours to keep, no subscription. Licenses that let you share, teach, or publish your book range from $35.99 to $49.99.
- Can I preview the book before purchasing?
Before you pay, you'll see what your book will cover: the title, a detailed description, the estimated length, and the complete chapter-by-chapter table of contents, so you know what you're getting before you decide. The full text itself is written after you purchase.
- How long does it take to create a book?
About 10 minutes. You can start reading the opening chapters while the rest is still being written.