Chromatic Geometry
A Color-Coded Visual Guide to Euclidean Theorems and Mathematical Proofs
Discover how color transforms your understanding of geometry.
253 pages12 chaptersJan 14, 2026Geometry
About this book
This book presents Euclidean theorems through an innovative color-coded visual system that makes abstract concepts concrete and memorable. You'll progress from foundational axioms to complex proofs, seeing how each geometric principle connects to real-world applications in design, architecture, and computational systems. Whether you're teaching geometry, designing educational materials, or deepening your mathematical intuition, this guide combines rigorous mathematical content with accessible visual explanations. Learn why the golden ratio appears in nature, how geometric transformations power computer graphics, and how classical constructions solve modern problems. By integrating color theory with mathematical diagrams, you'll develop stronger spatial reasoning and gain new perspectives on the elegant relationships that define Euclidean geometry. Perfect for professionals seeking to bridge mathematics and visual design.
Table of contents
- IntroductionWhy Color Matters in Geometry, The Science of Visual Learning, How to Use This Book, Geometry in Your WorldRead below
- Chapter 1: Foundations: Axioms and PostulatesWhat Are Axioms and Why They Matter, The Five Postulates of Euclidean Geometry, Color-Coding Axioms for Clarity, Building Logical Foundations
- Chapter 2: Points, Lines, and Planes: The Building BlocksUnderstanding Points and Their Properties, Lines, Rays, and Segments, Planes and Three-Dimensional Space, Visual Representation Through Color
- Chapter 3: Angles and Angular RelationshipsAngle Fundamentals and Measurement, Complementary, Supplementary, and Vertical Angles, Color-Coding Angles in Diagrams, Visual Proofs of Angle Theorems
- Chapter 4: Triangles: Properties and ProofsClassifying Triangles by Sides and Angles, Triangle Congruence: SSS, SAS, ASA, and AAS, Similarity and Proportional Relationships, Color-Coded Triangle Proofs
- Chapter 5: Polygons and Their PropertiesPolygon Basics and Classification, Quadrilaterals and Special Cases, Regular Polygons and Symmetry, Visualizing Polygon Relationships with Color
- Chapter 6: Circles: Theorems and ApplicationsCircle Fundamentals and Terminology, Central Angles, Inscribed Angles, and Arc Relationships, Tangent Lines and Secant Lines, Color-Coded Circle Diagrams and Proofs
- Chapter 7: Geometric Transformations and SymmetryTranslation, Rotation, and Reflection, Scaling and Dilation, Types of Symmetry and Invariants, Visualizing Transformations with Color Sequences
- Chapter 8: Vector Geometry and Coordinate SystemsVector Basics and Operations, Coordinate Systems and Distance Formulas, Dot Product and Geometric Applications, Color-Coded Vector Diagrams
- Chapter 9: Three-Dimensional Geometry and Spatial ReasoningThree-Dimensional Fundamentals, Polyhedra and Platonic Solids, 3D Transformations and Projections, Visualizing 3D Geometry with Color
- Chapter 10: The Golden Ratio and Geometric ProportionsDefining the Golden Ratio, The Golden Ratio in Nature and Art, Fibonacci Sequences and Geometric Spirals, Visualizing Proportions Through Color
- Chapter 11: Classical Constructions and Problem-SolvingCompass and Straightedge Constructions, Classical Problems and Their Solutions, Step-by-Step Construction Methods, Classical Constructions in Modern Design
- Chapter 12: Designing Educational Diagrams and Teaching GeometryPrinciples of Effective Diagram Design, Color Theory in Educational Contexts, Teaching Strategies Using Visual Methods, Creating Your Own Color-Coded Diagrams
- ConclusionSynthesizing Your Learning, Next Steps in Your Geometric Journey
- Glossary of Geometric Terms
- Further Reading and Resources
Introduction
Geometry surrounds you every moment of every day. The screen you're reading this on, the architecture of your workspace, the algorithms rendering graphics in your applications—all rely on geometric principles established over two millennia ago. Yet for many technically proficient professionals, geometry remains a collection of half-remembered theorems from school rather than a living, visual language. This book changes that relationship by introducing a systematic approach to understanding Euclidean geometry through color-coded visual proofs that transform abstract concepts into intuitive, memorable patterns.
Traditional geometry textbooks present theorems as sequences of logical statements, often divorcing the visual element from the proof itself. While this approach satisfies formal mathematical requirements, it creates unnecessary cognitive barriers. Your brain processes visual information differently than text, engaging spatial reasoning centers that evolved to navigate three-dimensional environments and recognize patterns. By integrating color as a semantic layer in geometric diagrams, this book leverages your natural visual processing capabilities to make relationships between geometric elements immediately apparent. When you see corresponding angles marked in matching colors across a diagram, your visual system recognizes the relationship before your analytical mind needs to process it verbally.
This introduction establishes the framework for your journey through Euclidean geometry. You'll discover why color-coding transforms geometric understanding, explore the cognitive science supporting visual learning methods, learn how to navigate this book's structure effectively, and recognize how geometric principles manifest in your professional and personal environments. Whether you're seeking to teach geometry more effectively, design better educational materials, or simply deepen your mathematical intuition, the chromatic approach presented here provides tools that bridge rigorous mathematical content with accessible visual explanation.
Why Color Matters in Geometry
Color serves as more than decoration in geometric diagrams—it functions as a semantic encoding system that carries mathematical meaning. When you assign specific colors to geometric elements based on their relationships, you create a visual language that communicates mathematical properties instantly. Consider a triangle congruence proof: marking corresponding sides in matching colors (red to red, blue to blue, green to green) makes the correspondence relationship visible at a glance. Your visual system processes these color matches in parallel, allowing you to grasp the entire relationship structure simultaneously rather than sequentially parsing written descriptions of which side corresponds to which.
The power of color-coding becomes especially apparent in complex diagrams involving multiple overlapping figures or transformation sequences. Traditional black-and-white diagrams require you to follow verbal labels (point A, point B, segment CD) and mentally track which elements relate to which. This creates significant cognitive load, forcing your working memory to maintain multiple associations simultaneously. Color eliminates this burden by making relationships perceptually obvious. When you see a blue angle transform into another blue angle through a rotation, the color continuity communicates the transformation's effect without requiring verbal mediation.
Research in educational psychology demonstrates that dual coding—presenting information through both verbal and visual channels—significantly enhances learning and retention[1]. Color-coded geometric diagrams exemplify this principle by encoding mathematical relationships in two complementary formats: the spatial arrangement of geometric elements and the color relationships between them. When you study a color-coded proof, you're building two parallel mental representations that reinforce each other. Later, when recalling the theorem, either the spatial pattern or the color pattern can trigger retrieval of the complete concept.
Color also provides a natural way to represent hierarchical relationships and categorical distinctions in geometry. You might use warm colors (reds, oranges, yellows) for given information and cool colors (blues, greens, purples) for derived conclusions. Or you could assign specific colors to different types of geometric objects: red for points, blue for lines, green for angles, purple for areas. These systematic color schemes create consistent visual vocabularies that transfer across different theorems and proofs, building a cumulative visual literacy that makes each subsequent diagram easier to interpret.
The chromatic approach particularly benefits professionals working at the intersection of mathematics and design. As a software engineer with advanced training, you likely work with visual representations regularly—whether designing user interfaces, creating data visualizations, or developing graphics algorithms. The same principles that make color-coded geometry effective apply to these domains. Understanding how color communicates mathematical relationships in geometric proofs provides transferable insights for any situation where you need to make abstract relationships visually comprehensible.
Consider how color-coding applies to teaching and communication. When explaining a geometric concept to colleagues or students, color-coded diagrams dramatically reduce explanation time and increase comprehension. Instead of saying the angle formed by the intersection of line segment AB and line segment CD, which I'll call angle theta,
you can simply reference the red angle.
This efficiency compounds across complex explanations, allowing you to focus cognitive resources on conceptual understanding rather than bookkeeping details.
Color choices themselves carry meaning that you can leverage strategically. Complementary colors (opposite on the color wheel) naturally draw attention to contrasts and differences, making them ideal for highlighting opposing elements like supplementary angles or inverse transformations. Analogous colors (adjacent on the color wheel) suggest similarity and continuity, perfect for representing sequences of related elements or progressive transformations. By understanding these color relationships, you can design diagrams that guide attention and emphasize the most important mathematical relationships.
The systematic use of color also addresses accessibility considerations when implemented thoughtfully. While this book uses color as a primary encoding mechanism, effective color-coded diagrams also incorporate secondary visual cues—line styles, patterns, labels—that ensure information remains accessible to readers with color vision deficiencies. This redundant encoding actually benefits all readers by providing multiple pathways to understanding, exemplifying universal design principles that make content more robust and comprehensible for everyone.
The Science of Visual Learning
Your brain dedicates more neural tissue to visual processing than to any other sense. Approximately thirty percent of your cortex engages in visual processing, compared to eight percent for touch and just three percent for hearing[2]. This massive neural investment reflects vision's evolutionary importance for survival, but it also creates opportunities for learning. When you present mathematical concepts visually, you engage this extensive processing infrastructure, allowing your brain to apply sophisticated pattern recognition capabilities to abstract mathematical relationships.
Visual working memory operates differently than verbal working memory, with distinct capacity limits and processing characteristics. While verbal working memory typically holds about seven items (the famous magic number seven
), visual working memory excels at maintaining integrated spatial relationships and patterns. A geometric diagram can present dozens of individual elements—points, lines, angles, regions—yet your visual system processes them as coherent structures rather than discrete items. This allows you to grasp complex geometric relationships that would overwhelm verbal working memory if presented as lists of propositions.
The concept of perceptual chunking explains how visual representations enhance understanding. When you repeatedly encounter geometric patterns, your visual system learns to recognize them as unified chunks rather than collections of individual elements. A right triangle with its altitude to the hypotenuse creates three similar triangles—a relationship that initially requires conscious analysis. With experience, you begin to recognize this configuration instantly as a single meaningful pattern. Color-coding accelerates this chunking process by making the similar triangles visually distinct, helping your brain segment the diagram into meaningful units.
Spatial reasoning abilities, which geometric thinking develops and relies upon, show strong correlations with mathematical achievement and problem-solving skills across domains[3]. When you work with geometric diagrams, you're not just learning specific theorems—you're strengthening general cognitive capabilities that transfer to other quantitative and analytical tasks. The mental rotation, spatial transformation, and relationship visualization skills you develop through geometric thinking enhance your ability to reason about abstract structures in programming, data analysis, and system design.
Visual proofs offer unique cognitive advantages over purely symbolic proofs. A well-designed visual proof makes the logical necessity of a theorem perceptually obvious. Consider the visual proof that the angles in a triangle sum to 180 degrees: by drawing a line parallel to one side through the opposite vertex and color-coding corresponding angles, the relationship becomes visually self-evident. This perceptual directness creates stronger conviction and deeper understanding than following a chain of algebraic manipulations, even when both approaches are logically equivalent.
The picture superiority effect describes the phenomenon that pictures are remembered better than words. Studies show that people remember about ten percent of information presented verbally after three days, but retain approximately sixty-five percent of information presented visually[4]. For geometric theorems, this effect is particularly pronounced because the visual representation isn't merely illustrative—it embodies the mathematical relationship itself. When you recall a color-coded geometric diagram, you're retrieving the actual mathematical content, not just a mnemonic device.
Visual learning also supports what cognitive scientists call constructivist learning—the process of building understanding by actively constructing mental models rather than passively receiving information. When you study a color-coded geometric proof, you're not just reading about relationships; you're building a mental spatial model that you can manipulate, rotate, and explore. This active construction creates deeper understanding and better transfer to novel problems. You can mentally apply the same color-coding scheme to new situations, using your internalized visual framework to analyze unfamiliar geometric configurations.
The integration of color with geometric diagrams specifically leverages what researchers call preattentive processing—visual features that your brain processes automatically before conscious attention. Color, orientation, size, and motion are processed preattentively, meaning your visual system detects them instantly across your entire visual field without requiring focused attention. When corresponding elements in a geometric proof share the same color, your preattentive processing identifies this relationship immediately, before you consciously examine the diagram. This allows you to grasp the overall structure of a proof instantly, then direct focused attention to specific details as needed.
How to Use This Book
This book follows a carefully structured progression from foundational concepts to advanced applications, but your path through it need not be strictly linear. Each chapter builds on previous material while also functioning as a relatively self-contained exploration of its topic. If you have strong background knowledge in certain areas, you can skip ahead to chapters addressing your specific interests, though you should familiarize yourself with the color-coding conventions established in early chapters. The consistent visual language developed throughout the book becomes more powerful as you internalize it, so even familiar topics presented with chromatic encoding may offer fresh insights.
Each chapter follows a consistent structure designed to support multiple learning styles and use cases:
- Conceptual introduction: Each topic begins with clear definitions and explanations of why the concept matters, connecting it to both mathematical foundations and practical applications
- Visual development: Color-coded diagrams progressively build complexity, showing how simple elements combine into sophisticated relationships
- Formal proofs: Rigorous mathematical proofs accompany visual demonstrations, showing how chromatic encoding supports rather than replaces logical reasoning
- Practical examples: Real-world applications demonstrate how geometric principles manifest in design, computation, and problem-solving contexts
- Implementation guidance: Specific techniques for creating your own color-coded diagrams and teaching materials
The diagrams throughout this book use a consistent color palette and encoding system. Primary geometric elements—points, lines, angles, and regions—receive colors based on their roles in proofs and their relationships to other elements. Given information typically appears in warm colors, while derived conclusions use cool colors. Corresponding elements across different figures share colors to make relationships immediately visible. When multiple instances of the same type of element appear, they receive distinct colors from a harmonious palette that maintains visual clarity without creating confusion.
To maximize your learning, engage actively with the diagrams rather than passively viewing them. Before reading the explanation of a proof, spend time examining the color-coded diagram. Ask yourself what the color relationships suggest about mathematical relationships. Which elements share colors, and what might that correspondence mean? How do the colors guide your eye through the logical sequence of the proof? This active interrogation of visual information builds stronger understanding than immediately reading the textual explanation.
Consider creating your own color-coded diagrams as you work through the material. The act of deciding how to color-code a geometric relationship forces you to analyze it deeply, identifying which elements correspond, which relationships matter most, and how to make the mathematical structure visually apparent. You don't need sophisticated software—colored pencils or markers work perfectly well. The cognitive benefits come from the thinking process, not the production quality. Chapter 12 provides detailed guidance on diagram design principles, but you can begin experimenting with color-coding immediately.
The book includes numerous examples and exercises, but you'll gain more by generating your own applications. When you encounter a theorem, pause to consider where you've seen that geometric relationship in your work or environment. How might this principle apply to a user interface layout problem? Could this transformation sequence optimize a graphics algorithm? Does this proportional relationship explain an aesthetic choice in architecture or design? Making these connections transforms abstract mathematics into practical knowledge.
For those using this book in teaching contexts, each chapter provides frameworks you can adapt for different audiences and settings. The color-coding approach scales from elementary introductions to advanced mathematical discussions. When teaching, consider having students create their own color-coded diagrams to explain concepts to each other. This peer teaching, supported by visual communication, often produces deeper understanding than traditional lecture formats. The visual language provides a common framework that facilitates mathematical discussion even when verbal mathematical vocabulary is still developing.
Pay special attention to the connections between chapters. Geometry is not a collection of isolated theorems but an interconnected system where concepts build on and illuminate each other. The color-coding system helps make these connections visible—when you see similar color patterns in different chapters, that visual similarity often reflects deep mathematical relationships. The book explicitly highlights these connections, but you'll discover additional ones through your own exploration. Keep notes on patterns you notice across different topics; these insights often lead to the most valuable understanding.
Finally, remember that this book serves as a reference as much as a tutorial. Once you've worked through the material, you'll likely return to specific chapters when facing particular problems or teaching specific concepts. The consistent structure and visual encoding make the book easy to navigate for quick reference. The table of contents and index help you locate specific theorems, while the visual consistency means you can often find what you need by recognizing the characteristic color patterns of different geometric relationships.
Geometry in Your World
Euclidean geometry isn't merely an abstract mathematical system—it's the mathematical language describing the spatial relationships that structure your physical and digital environments. Every building you enter, every screen you view, every physical object you manipulate exists in Euclidean space and exhibits geometric properties. As a software engineer, you work with geometric principles constantly, whether you're explicitly aware of it or not. User interface layouts rely on geometric relationships between elements. Graphics rendering implements geometric transformations. Data structures for spatial indexing encode geometric relationships. Understanding geometry deeply enhances your ability to work effectively in all these domains.
Consider the screen displaying this text. Its rectangular shape, the proportions of that rectangle, the arrangement of text and margins—all reflect geometric decisions. The aspect ratio might be 16:9 or 16:10, ratios chosen for both practical and aesthetic reasons rooted in geometric proportions. The margins likely follow proportional relationships that create visual balance. If the layout is responsive, it implements geometric transformations that maintain proportional relationships across different screen sizes. These aren't arbitrary choices but applications of geometric principles that affect usability and aesthetic appeal.
Architecture provides perhaps the most visible application of geometric principles. The buildings around you embody geometric relationships in three dimensions. Load-bearing structures rely on triangular bracing because triangles are rigid—a geometric property proven in Chapter 4. Arches and domes distribute weight through geometric curves. Symmetry creates visual harmony and structural balance. When architects design buildings, they're solving geometric problems: how to enclose space efficiently, how to create stable structures, how to achieve desired aesthetic effects through proportional relationships. Understanding the geometric principles underlying architecture deepens your appreciation of built environments and informs design decisions in digital spaces.
Computer graphics and visualization rely fundamentally on geometric transformations. Every time you rotate a 3D model, zoom into an image, or pan across a map, you're applying geometric transformations—rotation, scaling, translation—that this book explores in detail. The mathematics underlying these operations is pure Euclidean geometry. Understanding these geometric foundations helps you work more effectively with graphics libraries, debug visualization problems, and design better visual representations of data. The color-coded approach to transformations in Chapter 7 makes these operations visually intuitive, helping you predict transformation effects and compose operations correctly.
Navigation and mapping applications implement geometric algorithms constantly. When a mapping application calculates the shortest route between two points, it's solving geometric optimization problems. When it determines whether a point falls within a region, it's applying geometric containment tests. When it displays a three-dimensional globe as a two-dimensional map, it's implementing geometric projections. The geometric principles underlying these operations—distance formulas, coordinate transformations, projection methods—appear throughout this book, particularly in Chapters 8 and 9.
Design systems and visual frameworks increasingly recognize the importance of geometric relationships. The golden ratio, explored in Chapter 10, appears in countless design systems because it creates proportions that humans find aesthetically pleasing. Grid systems for layout rely on geometric subdivision of space. Spacing scales often follow geometric progressions. Understanding the geometric principles underlying these design choices helps you make better design decisions and communicate more effectively with designers. The visual language of color-coded geometry provides a framework for discussing spatial relationships that bridges technical and design perspectives.
Manufacturing and fabrication processes involve geometric constraints and transformations. Three-dimensional printing translates digital geometric models into physical objects. Computer-aided design (CAD) systems provide tools for creating and manipulating geometric forms. Robotic systems navigate through space using geometric calculations. Even if you don't work directly in these domains, understanding their geometric foundations provides valuable context for how digital designs become physical reality. The geometric principles remain constant whether you're working in virtual or physical space.
Natural phenomena exhibit geometric patterns that reveal underlying mathematical principles. The hexagonal structure of honeycombs minimizes material while maximizing strength—a geometric optimization. The spiral patterns of shells and galaxies follow geometric progressions related to the golden ratio. Crystal structures exhibit geometric symmetries that reflect atomic arrangements. Recognizing these geometric patterns in nature provides both aesthetic appreciation and insight into how mathematical principles manifest in physical systems. Chapter 10 explores these connections between geometry and natural forms in detail.
Game development and virtual reality create entirely geometric worlds. Every object in a game exists as a geometric model. Physics engines simulate geometric interactions—collisions, trajectories, deformations. Lighting calculations trace geometric paths of light rays. Understanding the geometric foundations of these systems helps you work more effectively with game engines, optimize performance, and create more realistic or stylized effects as desired. The three-dimensional geometry covered in Chapter 9 directly applies to these domains, while the transformation concepts in Chapter 7 underlie animation and physics systems.
Even abstract computational problems often have geometric interpretations that provide insight. Machine learning algorithms can be understood geometrically as finding optimal positions in high-dimensional spaces. Network analysis problems map to geometric graph layouts. Optimization problems often have geometric formulations that suggest solution approaches. Developing strong geometric intuition enhances your ability to recognize these geometric structures in apparently non-geometric problems, expanding your problem-solving toolkit. The vector geometry in Chapter 8 provides particularly useful tools for these abstract geometric interpretations.
Notes
Introduction
- 1. Allan Paivio, Mental Representations, Oxford University Press, 1990
- 2. George Mather, Foundations of Perception, Psychology Press, 2006
- 3. Kelly S. Mix and Yi-Ling Cheng, "The Relation Between Space and Math," Advances in Child Development and Behavior, 2012
- 4. John Medina, Brain Rules, Pear Press, 2008
This is the end of the free sample. The full book has 12 chapters.
Want this book written for you?
Tell us your goals and background, and get your own version of this book, tailored by AI to you.


Benefits of AI-tailored books
- Read one book, not ten:
- all the Geometry knowledge you need, gathered into a single book.
- Save days of learning:
- tell us your goals, choose your topics, and the whole book is built around them.
- Learn effortlessly:
- Geometry book written for your specific background and expertise.
- Understand at a glance:
- includes charts, tables, timelines, checklists, decision trees, and more.
- Stay current:
- written the day you order it, not years ago.
- Trust what you read:
- every book is checked for accuracy, with real research when your subject needs it.
Create your unique book in 3 steps
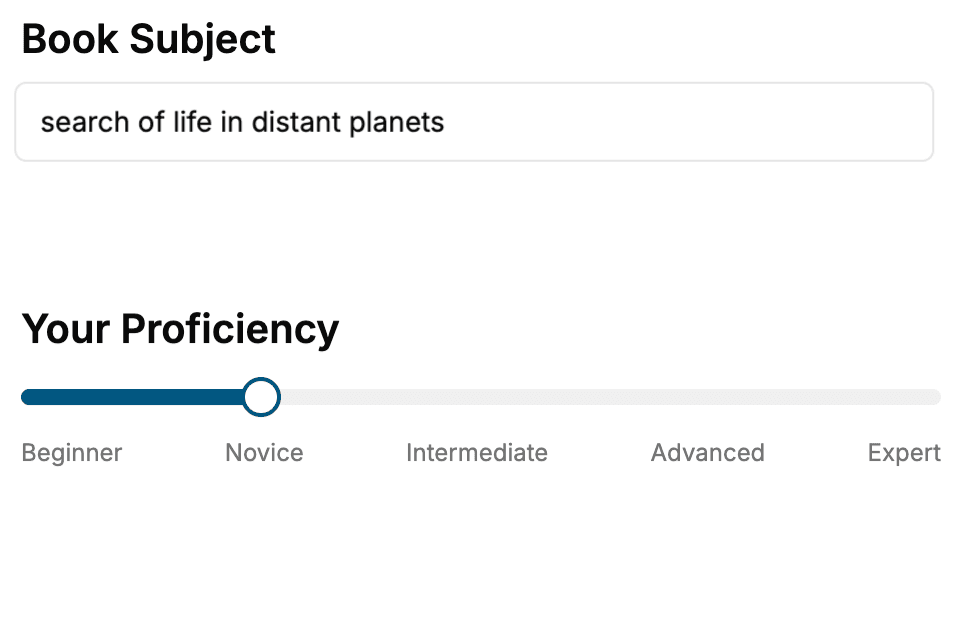
- 1. Select your focus
Select the focus of your Geometry book and share your background
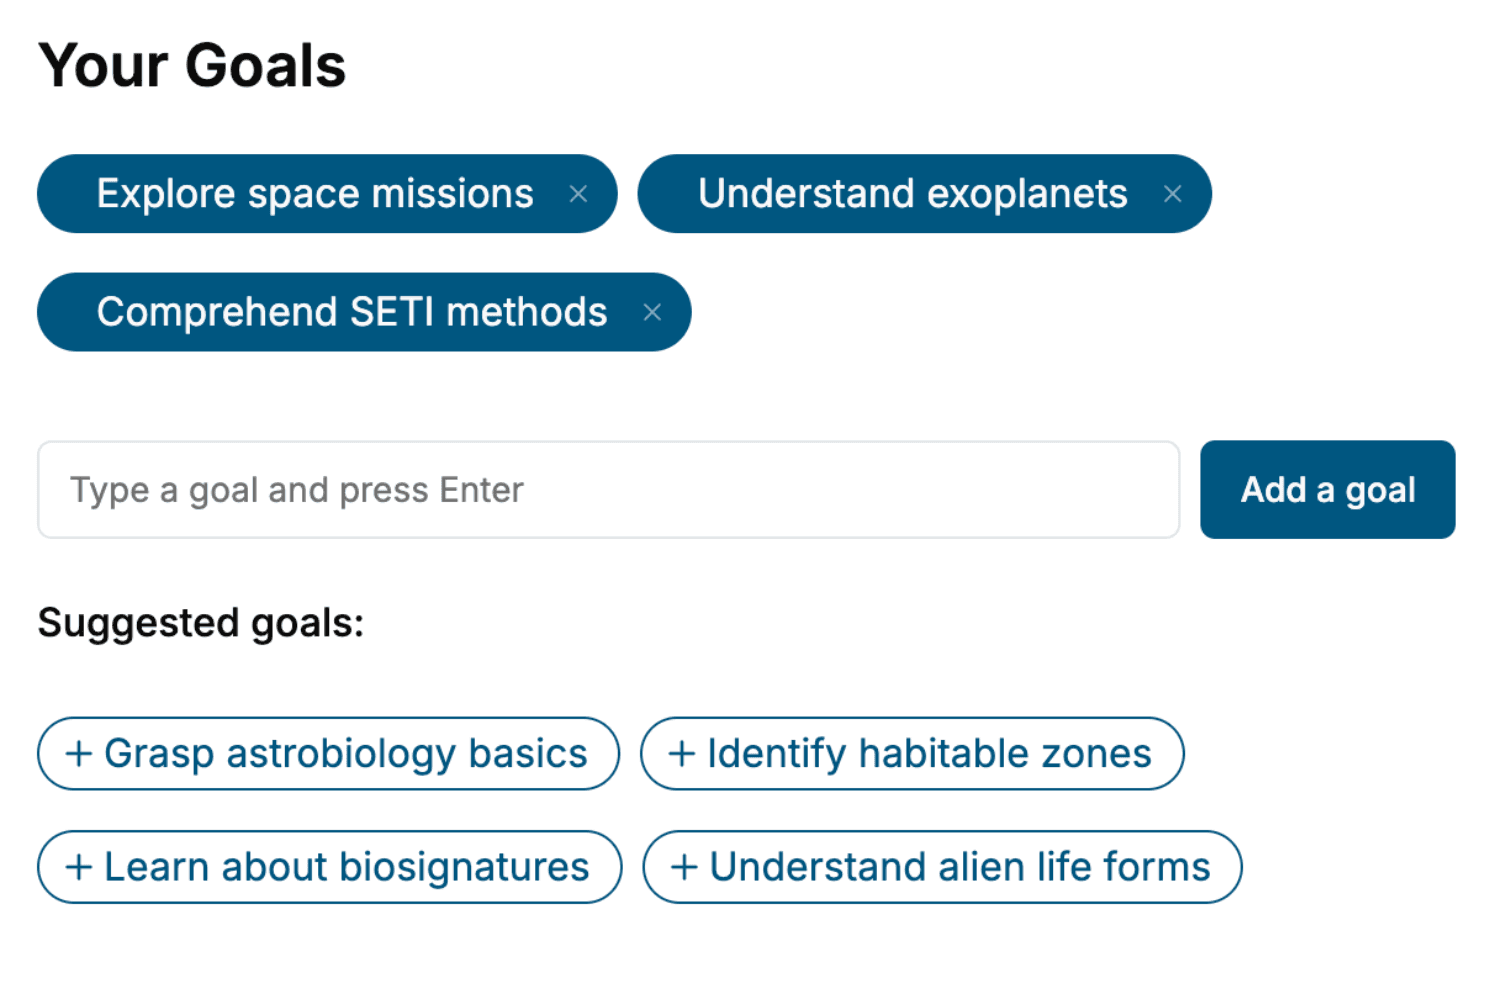
- 2. Personalize your book
Specify your goals and choose sub-topics to include
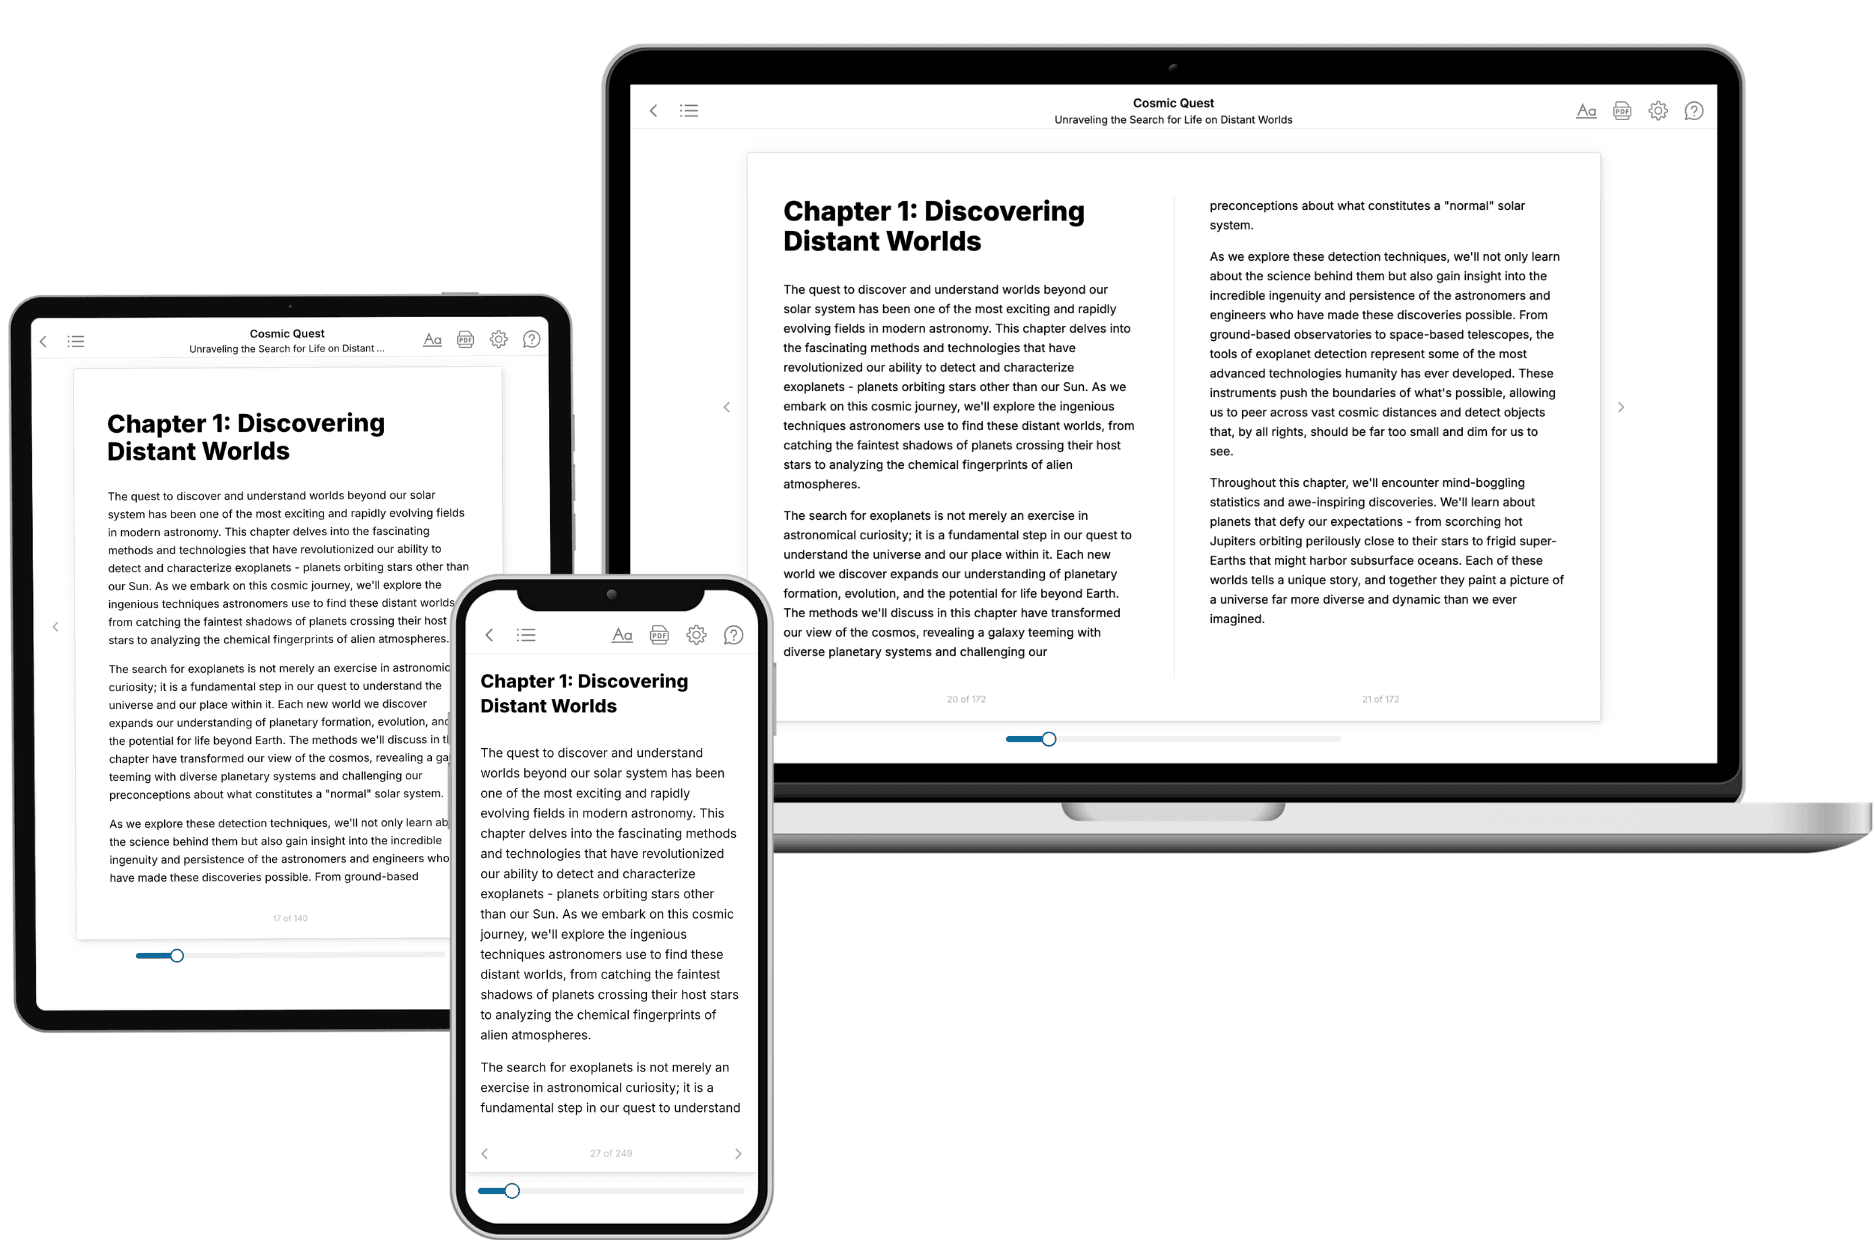
- 3. Get your tailored book
Your book is ready in 10 minutes. Read it online, download as EPUB or PDF, or send to Kindle.
Frequently asked questions
- What is TailoredRead?
TailoredRead creates complete, full-length nonfiction ebooks, written specifically for you. Tell us what you want to learn and why, and TailoredRead writes you a complete ebook on it, with charts, tables, and diagrams throughout. Read it online, on Kindle, or on any e-reader, or download it as a PDF or EPUB. Every book is written fresh the day you order it.
- How is the book tailored to me?
Before anything is written, you answer a few short questions about your goals, your background, and the topics you care about. Your book is then planned around your answers: written at your level, focused on your goals, and covering the topics you chose, instead of the one-size-fits-all book a store sells everyone.
- Will it read like generic AI content?
No. Your book isn't a chat transcript: it's planned chapter by chapter before a single word is written, told in a clear book voice, and explains ideas visually with charts, tables, and diagrams. After writing, every book goes through an editorial pass that polishes chapters so the book reads consistent from start to finish. Judge for yourself: browse thousands of sample books on our Explore Books page.
- How accurate is the content?
Our AI first checks whether your subject needs live research. Niche and fast-moving subjects are researched before writing, and the book plan and chapters are grounded in what it finds. After writing, every book goes through a quality pass that checks its facts and consistency, and researched books list their sources in a Notes section at the back.
- How long is the book?
You choose the length: Comprehensive (250-300 pages), Detailed (150-200 pages), Essential (70-100 pages), or Short (30-50 pages).
- Does the book include visuals?
Yes. Every book includes charts, tables, and diagrams: timelines, checklists, step-by-step guides, decision trees, comparison tables, matrices, and bar charts. A typical book includes dozens of these visual elements.
- Can I read it on Kindle? What formats can I download?
Yes. Every book can be read in our online reader or downloaded as a PDF or EPUB. The EPUB can be opened with Kindle, Apple Books, Kobo, and any e-reader. The Commercial and Author licenses also include an editable Word (DOCX) and Markdown download.
- How much does it cost?
About the price of a regular ebook. The exact price depends on your book's length and complexity, from $2 for the shortest books to $35 for the most comprehensive, and it's shown when you review your book, before you commit to anything. Each book is a one-time purchase, yours to keep, no subscription. Licenses that let you share, teach, or publish your book range from $35.99 to $49.99.
- Can I preview the book before purchasing?
Before you pay, you'll see what your book will cover: the title, a detailed description, the estimated length, and the complete chapter-by-chapter table of contents, so you know what you're getting before you decide. The full text itself is written after you purchase.
- How long does it take to create a book?
About 10 minutes. You can start reading the opening chapters while the rest is still being written.