Chrome Developer Mode Mastery
Unlock Advanced Web Development and Debugging Capabilities in Google Chrome
Most developers only scratch the surface of Chrome's built-in capabilities, missing powerful tools that could save hours of debugging time.
207 pages9 chaptersApr 3, 2026Web Development
About this book
Chrome Developer Mode contains far more functionality than the basic inspect element feature most people know. This comprehensive guide reveals the full potential of Chrome DevTools, taking you from intermediate user to confident power user. You'll discover how to efficiently debug JavaScript, analyze network performance, profile application memory usage, and optimize rendering speed. Learn practical techniques for inspecting DOM elements, manipulating CSS in real-time, executing complex console commands, and using breakpoints strategically. Whether you're troubleshooting a stubborn bug, optimizing a slow application, or building production-ready code, this book provides the knowledge and workflows you need to work faster and smarter with Chrome's developer tools.
Table of contents
- IntroductionWhy Chrome Developer Tools Matter, What You'll Learn in This Book, How to Use This GuideRead below
- Chapter 1: Getting Started with Chrome Developer ModeOpening and Accessing Developer Tools, Understanding the DevTools Interface, Customizing Your DevTools Layout and Settings
- Chapter 2: Mastering the Elements PanelInspecting and Selecting DOM Elements, Editing HTML and DOM Structure in Real-Time, Analyzing and Modifying CSS Styles, Understanding the Box Model and Layout
- Chapter 3: Leveraging the Console PanelConsole Fundamentals and Logging, Executing JavaScript and Testing Code, Advanced Console Methods and Utilities
- Chapter 4: Network Performance AnalysisNavigating the Network Panel, Analyzing HTTP Requests and Responses, Understanding Load Times and Performance Metrics, Simulating Network Conditions and Throttling
- Chapter 5: JavaScript Debugging TechniquesSetting and Managing Breakpoints, Step-Through Execution and Call Stacks, Using Watch Expressions and Variable Inspection, Conditional Breakpoints and Logpoints
- Chapter 6: Performance Profiling and OptimizationUsing the Performance Panel for Profiling, Memory Profiling and Leak Detection, Analyzing Rendering Performance and Jank, Practical Optimization Strategies
- Chapter 7: Advanced DevTools FeaturesDeep Dive into the Sources Panel, Inspecting Application Storage and Cookies, Security and Audit Features
- Chapter 8: Optimizing Your Development WorkflowEssential Keyboard Shortcuts and Productivity Tips, Extending DevTools with Custom Extensions, Remote Debugging and Mobile Device Testing
- Chapter 9: Real-World Debugging ScenariosDiagnosing Common Web Development Issues, Case Studies: Solving Complex Problems, Best Practices for Effective Debugging
- ConclusionYour Path to DevTools Mastery, Staying Current with Chrome Updates
- Glossary
- Further Reading and Resources
Introduction
Every web developer has been there. A bug appears in production that you cannot reproduce locally. A page loads slowly, but you have no idea which resource is causing the delay. A CSS rule refuses to apply the way you expect, and you spend an hour staring at your stylesheet before realizing the problem was something else entirely. These moments are frustrating, time-consuming, and surprisingly common. What separates developers who resolve these issues in minutes from those who spend hours guessing is not raw talent or years of experience. It is knowing how to use the right tools effectively.
Chrome Developer Tools, commonly called DevTools, is one of the most powerful and underutilized toolsets available to web developers today. Built directly into Google Chrome, it gives you a real-time window into everything happening inside a web page: the structure of the HTML, the cascade of CSS rules, the execution of JavaScript, the flow of network requests, and the consumption of memory. Most developers discover DevTools through the "Inspect Element" option in the right-click menu, use it to peek at a layout, and then close it without ever exploring further. That approach leaves an enormous amount of capability untouched.
This book exists to change that. Whether you have been writing HTML and JavaScript for two years or ten, there is a strong chance that Chrome DevTools has features you have never opened, techniques you have never tried, and workflows that could save you significant time every single week. The goal here is not to give you a surface-level tour of the interface. The goal is to take you deep enough into each panel and feature that you come away with practical skills you can apply immediately to real projects. By the time you finish this guide, DevTools will feel less like a mysterious black box and more like a trusted extension of your development environment.
The chapters ahead are organized to build on each other logically, starting with the fundamentals of the interface and moving through increasingly advanced topics like performance profiling, memory leak detection, and remote debugging. Along the way, you will find concrete examples, step-by-step techniques, and real-world scenarios drawn from the kinds of problems developers actually encounter. The focus throughout is practical. Every concept is connected to something you can do right now, in your browser, on your own projects.
Why Chrome Developer Tools Matter
Chrome holds a dominant position in the browser market, consistently accounting for roughly 65% of global browser usage across desktop and mobile platforms.[1] That market share means the majority of your users are likely viewing your work through Chrome. When something breaks or performs poorly in Chrome, it affects most of your audience. Having deep familiarity with Chrome's built-in developer tools is not just a nice skill to have. It is a professional necessity for anyone building for the modern web.
Beyond market share, Chrome DevTools has evolved into one of the most feature-rich browser development environments ever built. Google's engineering teams continuously update and expand the toolset, adding capabilities that were once only available through expensive third-party software or complex local setups. Features like the Performance panel, the Memory profiler, and the Lighthouse audit tool give you access to the kind of deep diagnostic information that used to require specialized expertise and separate applications. Today, all of it is available with a single keyboard shortcut.
The productivity gains from mastering DevTools are measurable and significant. Consider a common scenario: a JavaScript error is causing a form submission to fail silently. Without DevTools, you might add console.log statements throughout your code, reload the page repeatedly, and spend an hour narrowing down the problem. With DevTools, you can set a breakpoint on the form's submit handler, step through the execution line by line, inspect every variable in real time, and identify the exact line causing the failure in under five minutes. That difference compounds across every debugging session you have.
Performance optimization is another area where DevTools delivers outsized value. Studies consistently show that page load time has a direct impact on user engagement and conversion rates. Google's own research found that as page load time increases from one second to three seconds, the probability of a user bouncing increases by 32%.[2] The Network panel and Performance panel in DevTools give you the specific data you need to identify what is slowing your pages down and how to fix it. Without those tools, performance optimization becomes guesswork.
DevTools also plays a critical role in understanding code you did not write. When you join a new project, inherit a legacy codebase, or need to understand how a third-party library behaves, the ability to inspect, pause, and step through running code is invaluable. You can explore the DOM structure of any page, read the CSS rules applied to any element, and trace the execution path of any JavaScript function. This makes DevTools as useful for learning and exploration as it is for debugging and optimization.
Finally, Chrome DevTools is free, always available, and requires no installation or configuration. It works on any website, any web application, and any local development server. There is no barrier to entry beyond opening your browser. That accessibility, combined with the depth of its capabilities, makes it one of the highest-return investments of time you can make as a web developer. Learning it well pays dividends on every project you work on from this point forward.
A practical example: Imagine you are debugging a React application where a component is re-rendering too frequently, causing noticeable lag in the UI. Without DevTools, you might spend hours adding logging statements and trying to trace the issue through your component tree. With the Performance panel, you can record a five-second interaction, see exactly which components re-rendered and how long each render took, and pinpoint the unnecessary re-render in minutes. That is the difference DevTools mastery makes in real work.
It is also worth noting that the skills you build with Chrome DevTools transfer broadly. Firefox Developer Tools, Safari Web Inspector, and Edge DevTools all share similar panels, concepts, and workflows. Mastering Chrome DevTools gives you a mental model for browser-based debugging that applies across the entire ecosystem. The investment you make here extends well beyond a single browser.
What You'll Learn in This Book
This book covers Chrome DevTools comprehensively, moving from foundational concepts to advanced techniques in a logical sequence. Each chapter focuses on a specific area of the toolset, giving you enough depth to use it confidently in real projects. Here is a clear picture of what each part of the book covers and what you will be able to do after working through it.
Chapter 1: Getting Started with Chrome Developer Mode covers the basics of opening and navigating DevTools, understanding the layout of its panels, and customizing the interface to suit your workflow. Even if you have used DevTools before, this chapter introduces settings and layout options that many developers never discover. You will learn multiple ways to open DevTools, how to dock or undock the panel, and how to configure settings that make the tool more efficient for your specific needs.
Chapter 2: Mastering the Elements Panel goes deep into DOM inspection and CSS analysis. You will learn how to select elements precisely, edit HTML structure in real time, trace which CSS rules are applying to an element and why, and use the box model visualizer to understand layout behavior. This chapter is especially valuable for front-end developers who spend significant time working with layout and styling issues.
Chapter 3: Leveraging the Console Panel moves beyond basic console.log usage to cover the full range of console methods, JavaScript execution in the console context, and utilities that make interactive debugging faster. You will learn how to use console.table, console.group, console.time, and other methods that provide structured, readable output instead of cluttered log dumps.
Chapters 4 and 5 cover two of the most impactful skill areas in the book:
- Network Performance Analysis teaches you to read HTTP requests and responses, identify slow-loading resources, understand caching behavior, and simulate different network conditions to test how your application performs on slower connections.
- JavaScript Debugging Techniques covers breakpoints in depth, including conditional breakpoints and logpoints, step-through execution, call stack inspection, and watch expressions. These techniques transform how you approach bugs in complex JavaScript applications.
Chapter 6: Performance Profiling and Optimization introduces the Performance panel and Memory profiler. You will learn how to record and interpret performance traces, identify rendering bottlenecks, detect memory leaks, and apply practical optimization strategies. This chapter is particularly relevant for developers working on single-page applications or any interface where smooth, responsive performance is critical.
Chapter 7: Advanced DevTools Features explores the Sources panel in depth, covers application storage inspection (including cookies, localStorage, and IndexedDB), and introduces the security and audit tools built into DevTools. The Lighthouse integration alone, which provides automated audits for performance, accessibility, and SEO, is worth the time investment of this chapter.
Chapter 8: Optimizing Your Development Workflow focuses on productivity. You will learn the keyboard shortcuts that eliminate repetitive mouse navigation, how to extend DevTools with custom extensions, and how to use remote debugging to test on real mobile devices. These techniques are about working smarter, not just knowing more features.
Chapter 9: Real-World Debugging Scenarios brings everything together through practical case studies. Rather than abstract exercises, this chapter walks through the kinds of problems developers actually encounter: a slow page load caused by unoptimized images, a JavaScript error triggered only under specific user conditions, a CSS layout that breaks on certain screen sizes. Each scenario demonstrates how to apply the tools and techniques from earlier chapters in a realistic context.
By the end of this book, you will have a complete, practical understanding of Chrome DevTools. More importantly, you will have a mental framework for approaching any web development problem systematically, using the right tool for each type of issue. That framework is what separates developers who debug efficiently from those who rely on trial and error.
How to Use This Guide
This book is designed to be read with Chrome open beside it. The most effective way to absorb the material is to try each technique as you encounter it, using either your own projects or any live website as a testing ground. DevTools works on any page you can open in Chrome, which means you always have a practice environment available. Reading about how to set a breakpoint is useful. Actually setting one, stepping through code, and watching variables change in real time is transformative.
The chapters are structured to build on each other, so reading from start to finish is the recommended approach if you are new to DevTools or want a comprehensive foundation. Each chapter assumes familiarity with the concepts introduced in earlier chapters. That said, if you have specific, immediate needs, the book is also designed to work as a reference. If you are troubleshooting a network performance issue right now, you can jump directly to Chapter 4. If you need to understand memory profiling for a specific project, Chapter 6 stands on its own well enough to be useful in isolation.
Throughout the book, you will encounter several recurring elements designed to make the content more actionable:
- Step-by-step instructions walk you through specific techniques in a clear, numbered sequence.
- Practical examples show how each concept applies to real development scenarios.
- Tips and callouts highlight shortcuts, common mistakes, and things worth remembering.
- Code snippets provide concrete examples you can use or adapt directly in your own work.
One important note about the version of Chrome DevTools covered in this book: Google updates Chrome and its DevTools regularly, sometimes adding new features or reorganizing existing panels between releases. The core concepts, panels, and workflows described here are stable and have been consistent across multiple Chrome versions. However, minor UI details, menu locations, or feature names may differ slightly depending on which version of Chrome you are running. If something looks slightly different in your browser, the underlying functionality is almost certainly still there. A quick search of the Chrome DevTools documentation will help you locate it.
The book assumes you have a working knowledge of HTML, CSS, and JavaScript. You do not need to be an expert in any of these, but you should be comfortable reading and writing basic code in all three. Concepts like the DOM, CSS specificity, event listeners, and asynchronous JavaScript will come up throughout the book. If any of these feel unfamiliar, a brief review of the fundamentals before diving in will make the material easier to follow.
It is also worth setting realistic expectations about the learning curve. Some of the tools covered in this book, particularly the Performance panel and the Memory profiler, have a steeper learning curve than others. The interface can look overwhelming at first glance. Do not let that discourage you. Each chapter breaks down the relevant panels into digestible pieces, explains what you are looking at, and focuses on the specific information that matters most for practical use. You do not need to understand every pixel of the Performance panel to get significant value from it. You need to understand the right parts, and that is exactly what this book focuses on.
Finally, approach this material with a spirit of experimentation. Chrome DevTools is a safe environment for exploration. You can edit the HTML of any page, run arbitrary JavaScript in the console, and modify CSS rules without affecting anything permanently. Nothing you do in DevTools changes the actual source files on a server. Every change is temporary and disappears when you reload the page. That safety net means you can try things freely, make mistakes without consequences, and learn through hands-on exploration. Use it. The developers who get the most out of DevTools are the ones who treat it as a playground as much as a professional tool.
Getting set up: Before moving to Chapter 1, make sure you have a recent version of Google Chrome installed. Open any webpage, press
F12on Windows or Linux, orCmd + Option + Ion macOS, and confirm that the DevTools panel opens. If it does, you are ready to begin. If Chrome is not your primary browser, consider using it alongside your usual browser for the duration of this book. The techniques you learn here will be directly applicable to your work from the very first chapter.
The web development landscape moves quickly, and the tools available to developers today are more powerful than ever. Chrome DevTools represents one of the most significant productivity advantages available to any developer willing to invest the time to learn it properly. That investment starts here, and it starts now. Let's get into it.
Notes
Introduction
- 1. StatCounter Global Stats - Browser Market Share Worldwide, 2024
- 2. Google/SOASTA Research, 2017. 'The State of Online Retail Performance.' Think with Google.
This is the end of the free sample. The full book has 9 chapters.
Want this book written for you?
Tell us your goals and background, and get your own version of this book, tailored by AI to you.


Benefits of AI-tailored books
- Read one book, not ten:
- all the Web Development knowledge you need, gathered into a single book.
- Save days of learning:
- tell us your goals, choose your topics, and the whole book is built around them.
- Learn effortlessly:
- Web Development book written for your specific background and expertise.
- Understand at a glance:
- includes charts, tables, timelines, checklists, decision trees, and more.
- Stay current:
- written the day you order it, not years ago.
- Trust what you read:
- every book is checked for accuracy, with real research when your subject needs it.
Create your unique book in 3 steps
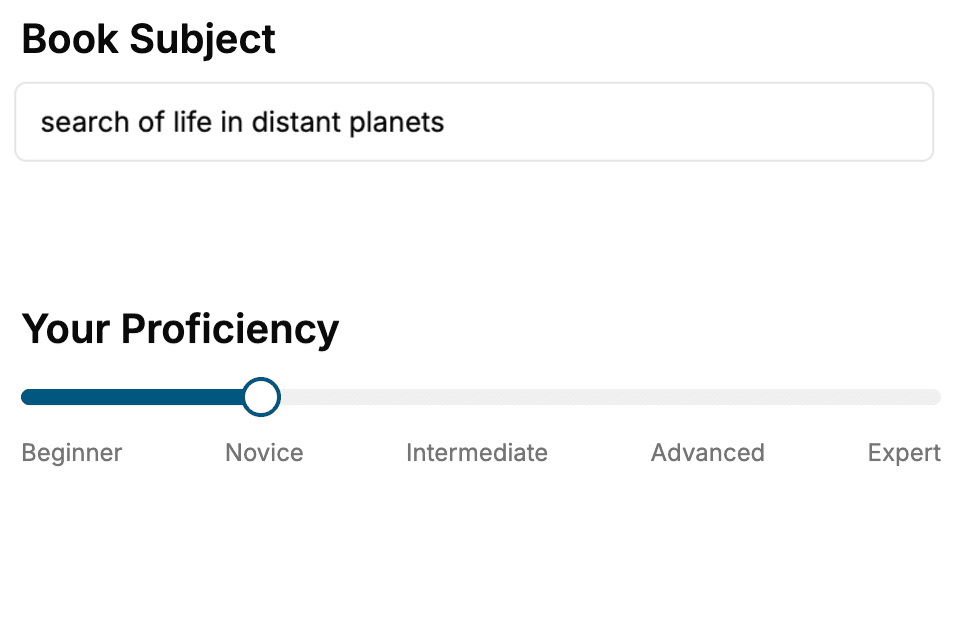
- 1. Select your focus
Select the focus of your Web Development book and share your background
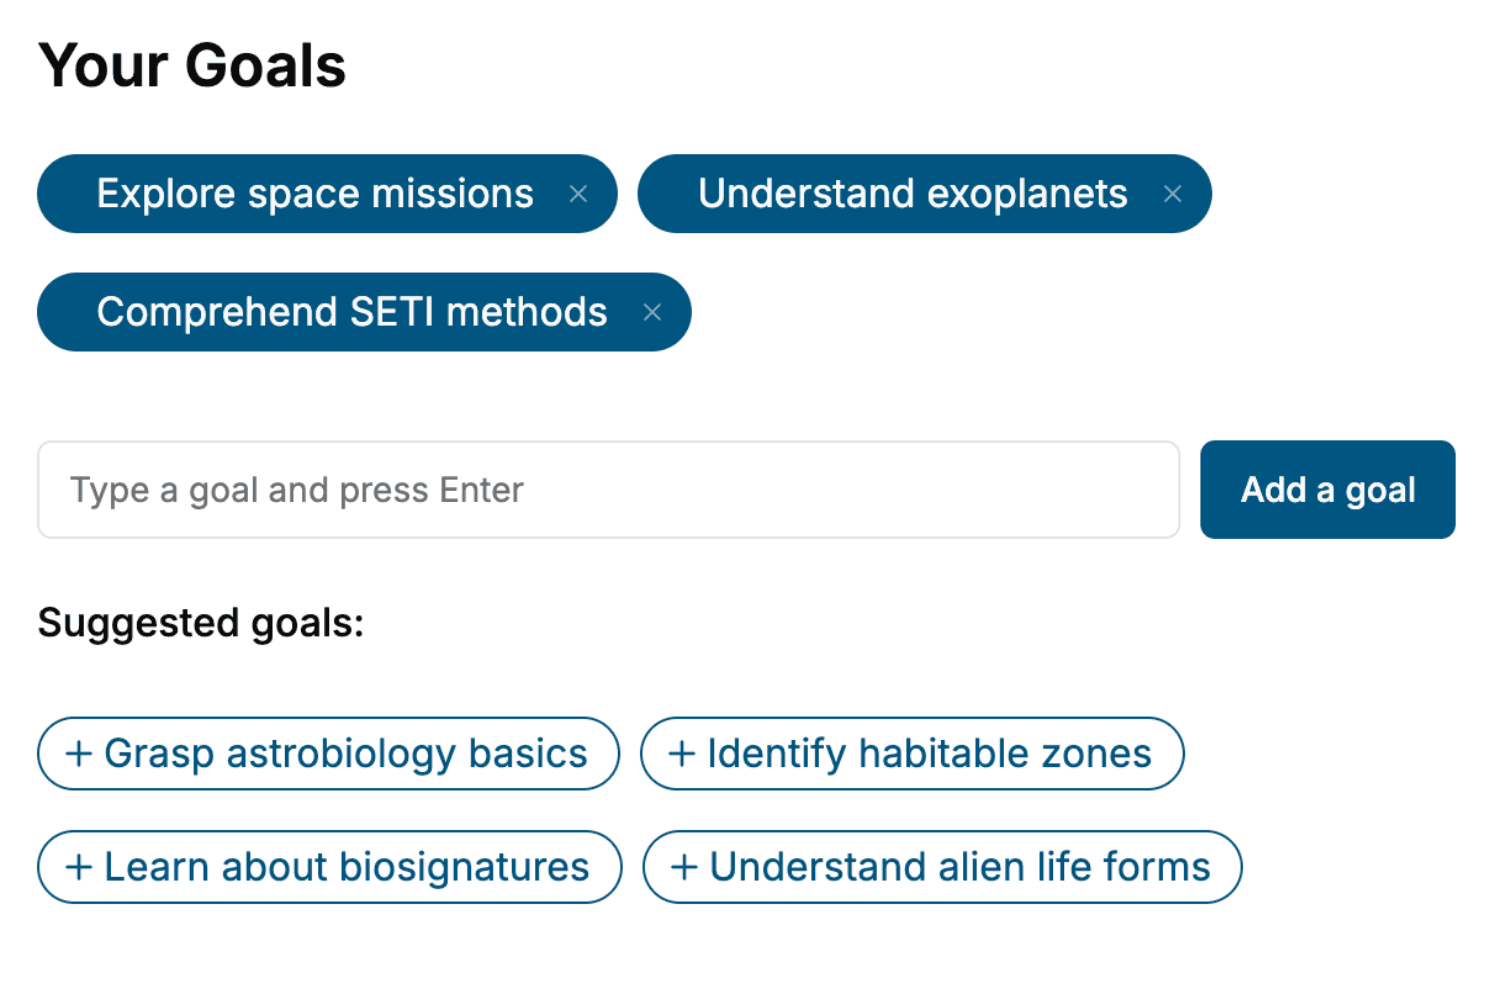
- 2. Personalize your book
Specify your goals and choose sub-topics to include
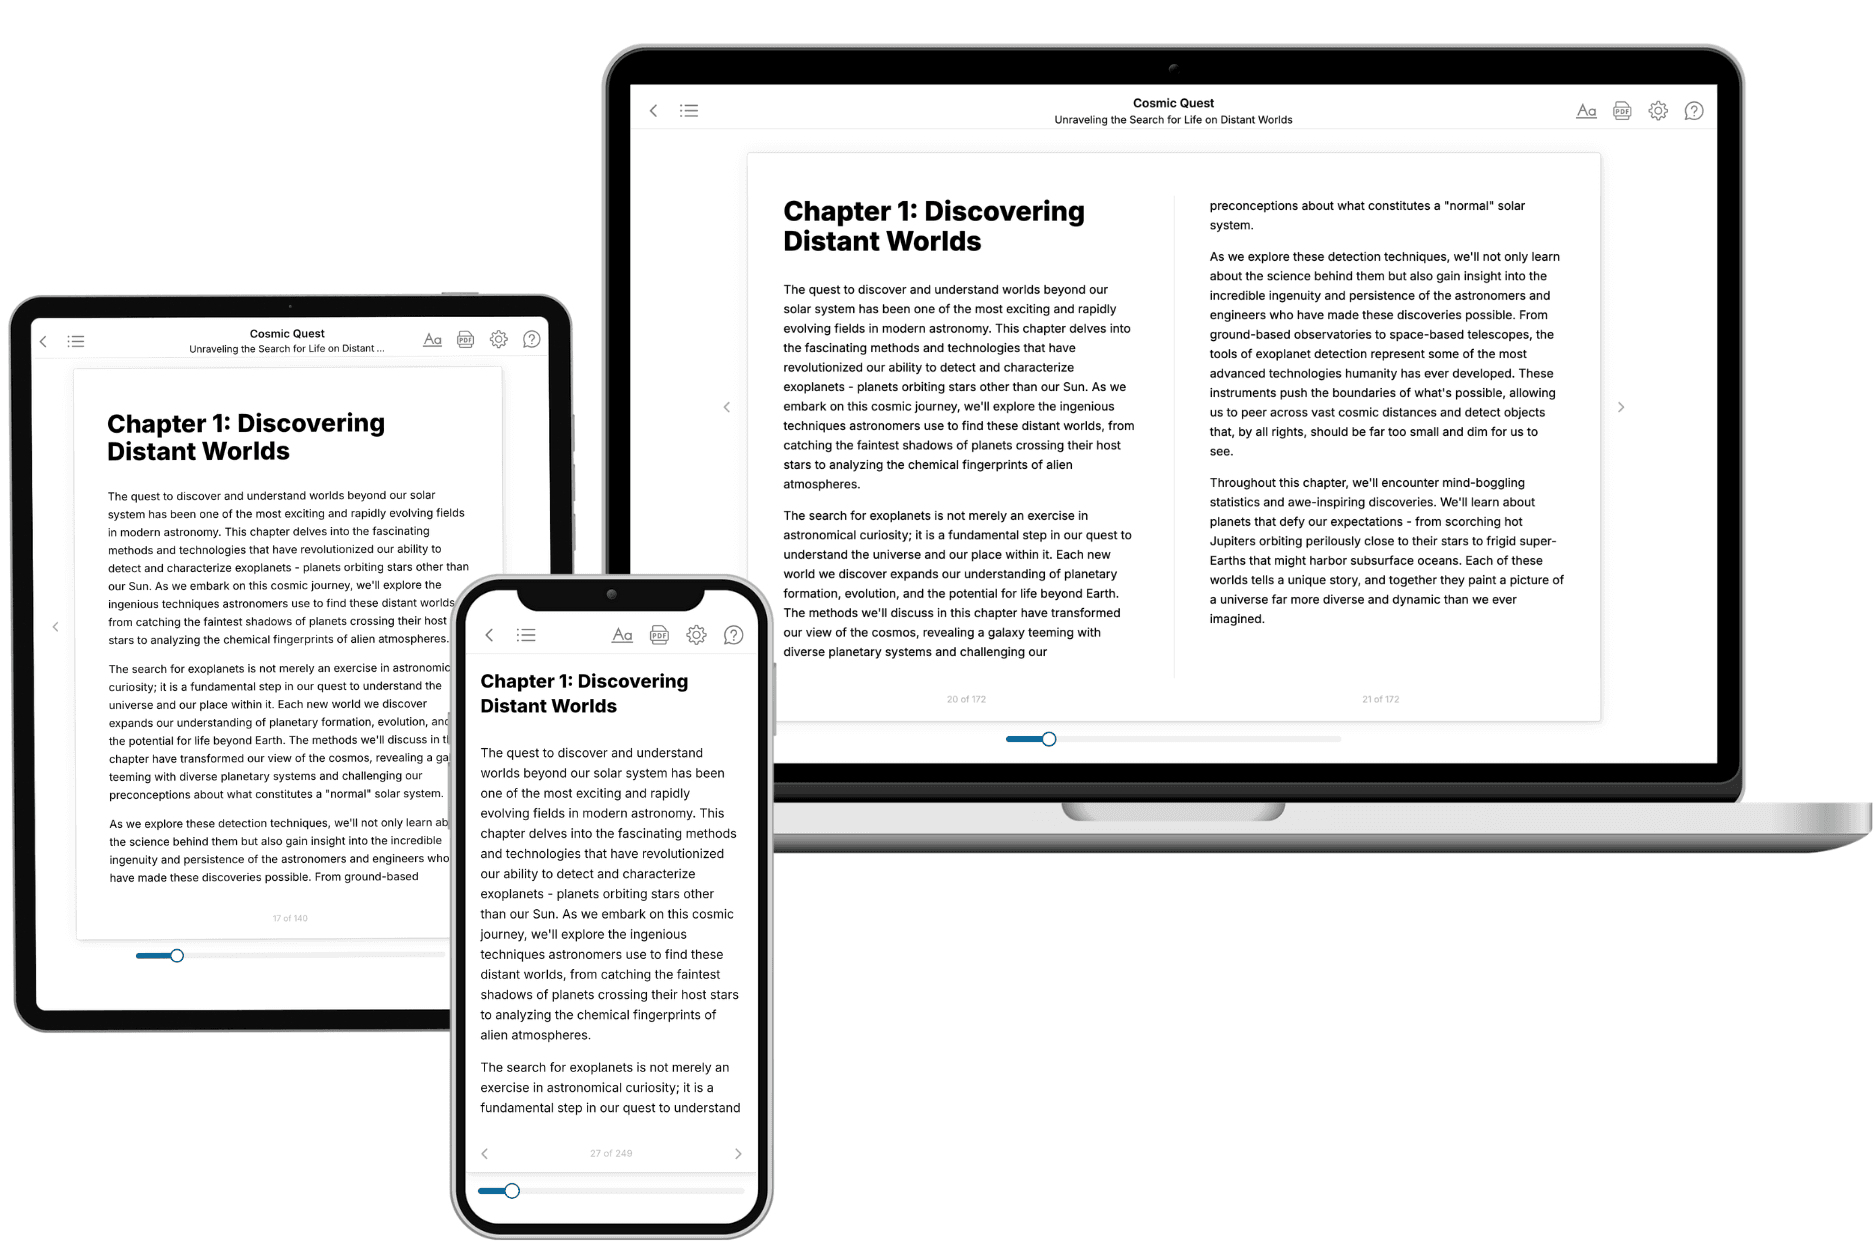
- 3. Get your tailored book
Your book is ready in 10 minutes. Read it online, download as EPUB or PDF, or send to Kindle.
Frequently asked questions
- What is TailoredRead?
TailoredRead creates complete, full-length nonfiction ebooks, written specifically for you. Tell us what you want to learn and why, and TailoredRead writes you a complete ebook on it, with charts, tables, and diagrams throughout. Read it online, on Kindle, or on any e-reader, or download it as a PDF or EPUB. Every book is written fresh the day you order it.
- How is the book tailored to me?
Before anything is written, you answer a few short questions about your goals, your background, and the topics you care about. Your book is then planned around your answers: written at your level, focused on your goals, and covering the topics you chose, instead of the one-size-fits-all book a store sells everyone.
- Will it read like generic AI content?
No. Your book isn't a chat transcript: it's planned chapter by chapter before a single word is written, told in a clear book voice, and explains ideas visually with charts, tables, and diagrams. After writing, every book goes through an editorial pass that polishes chapters so the book reads consistent from start to finish. Judge for yourself: browse thousands of sample books on our Explore Books page.
- How accurate is the content?
Our AI first checks whether your subject needs live research. Niche and fast-moving subjects are researched before writing, and the book plan and chapters are grounded in what it finds. After writing, every book goes through a quality pass that checks its facts and consistency, and researched books list their sources in a Notes section at the back.
- How long is the book?
You choose the length: Comprehensive (250-300 pages), Detailed (150-200 pages), Essential (70-100 pages), or Short (30-50 pages).
- Does the book include visuals?
Yes. Every book includes charts, tables, and diagrams: timelines, checklists, step-by-step guides, decision trees, comparison tables, matrices, and bar charts. A typical book includes dozens of these visual elements.
- Can I read it on Kindle? What formats can I download?
Yes. Every book can be read in our online reader or downloaded as a PDF or EPUB. The EPUB can be opened with Kindle, Apple Books, Kobo, and any e-reader. The Commercial and Author licenses also include an editable Word (DOCX) and Markdown download.
- How much does it cost?
About the price of a regular ebook. The exact price depends on your book's length and complexity, from $2 for the shortest books to $35 for the most comprehensive, and it's shown when you review your book, before you commit to anything. Each book is a one-time purchase, yours to keep, no subscription. Licenses that let you share, teach, or publish your book range from $35.99 to $49.99.
- Can I preview the book before purchasing?
Before you pay, you'll see what your book will cover: the title, a detailed description, the estimated length, and the complete chapter-by-chapter table of contents, so you know what you're getting before you decide. The full text itself is written after you purchase.
- How long does it take to create a book?
About 10 minutes. You can start reading the opening chapters while the rest is still being written.