Chrome Remote Debugging Mastery
Debug, Inspect, and Optimize Your Web Applications Like a Pro
You're about to discover how to debug applications anywhere—whether they're running on your colleague's machine, a staging server, or in production.
207 pages10 chaptersJun 13, 2026Chrome Developer Tools
About this book
Chrome Remote Debugging removes the limitations of local-only development, giving you the power to inspect and fix issues in real environments. This guide walks you through setting up remote debugging connections, understanding the Chrome DevTools Protocol that powers it all, and using advanced inspection techniques to diagnose performance problems, memory leaks, and logic errors. You'll learn how to debug different target types, secure your debugging sessions, and automate inspection workflows. By the end, you'll have the skills to troubleshoot complex issues faster, optimize applications in production-like environments, and collaborate more effectively with your team. Whether you're hunting down elusive bugs or optimizing performance, remote debugging becomes an indispensable part of your development toolkit.
Table of contents
- IntroductionWhy Remote Debugging Matters, What You'll Learn in This Book, How to Use This GuideRead below
- Chapter 1: Understanding Chrome Remote Debugging FundamentalsWhat Is Remote Debugging?, Local vs. Remote Debugging: Key Differences, Real-World Use Cases and Scenarios
- Chapter 2: The Chrome DevTools Protocol ExplainedChrome DevTools Protocol Overview, How CDP Enables Remote Communication, Domains, Methods, and Events in CDP, Understanding the CDP Architecture
- Chapter 3: Setting Up Your Remote Debugging EnvironmentSystem Requirements and Prerequisites, Enabling Remote Debugging on Target Devices, Port Forwarding and Network Configuration, Making Your First Remote Connection
- Chapter 4: Connecting to Remote TargetsDiscovering and Listing Remote Targets, Establishing Secure Connections, Troubleshooting Connection Issues
- Chapter 5: Debugging Web Pages and ApplicationsInspecting and Modifying DOM Elements, Setting Breakpoints and Stepping Through Code, Using the Console for Remote Inspection, Monitoring Network Activity Remotely
- Chapter 6: Debugging Service Workers and Background ProcessesUnderstanding Service Workers in Remote Context, Debugging Service Worker Lifecycle and Events, Inspecting Background Processes and Workers
- Chapter 7: Performance Profiling and OptimizationCapturing and Analyzing Performance Metrics, Memory Profiling and Leak Detection, CPU Profiling and Bottleneck Identification, Optimization Strategies Based on Profiling Data
- Chapter 8: Security and Authentication in Remote DebuggingUnderstanding Security Risks in Remote Debugging, Authentication and Authorization Mechanisms, Best Practices for Secure Remote Debugging
- Chapter 9: Automation and Scripting with Remote DebuggingCDP Clients and Libraries for Automation, Writing Automation Scripts for Remote Inspection, Continuous Monitoring and Automated Testing
- Chapter 10: Advanced Debugging Techniques and WorkflowsDebugging Multiple Targets Simultaneously, Debugging Headless Browsers and Automated Tests, Safe Debugging Practices in Production Environments
- ConclusionKey Takeaways and Next Steps, Continuing Your Remote Debugging Journey
- Appendix: Quick Reference and ResourcesChrome DevTools Protocol Quick Reference, Recommended Tools and Resources, Common Issues and Solutions
Introduction
There's a particular kind of frustration that every web developer knows well. A bug appears in staging that you simply cannot reproduce locally. A performance issue shows up on a colleague's machine but not yours. A mobile device renders something completely differently from your desktop browser, and you have no way to inspect what's actually happening inside it. You refresh, you guess, you add console.log statements, and you hope. This approach works sometimes, but it's slow, unreliable, and frankly exhausting when the stakes are high.
Chrome Remote Debugging changes that dynamic entirely. Instead of guessing what's happening inside an application running somewhere else, you connect your local Chrome DevTools directly to that application and inspect it in real time. You can set breakpoints, examine the DOM, monitor network requests, profile memory usage, and run console commands against a live target, whether that target is a phone sitting on your desk, a server in a data center, or a headless browser running automated tests in a CI pipeline. The gap between "where the bug lives" and "where you can see it" disappears.
This book is built for developers who already know their way around Chrome DevTools but want to go further. If you've used the Elements panel, set a breakpoint or two, and poked around the Network tab, you have everything you need to get started here. What this guide adds is the layer that most developers never fully explore: the ability to take those same tools and point them at any Chrome-based target, anywhere on a network. That shift in capability is not a small upgrade. It fundamentally changes how you approach debugging, performance work, and production troubleshooting.
The chapters ahead move from foundational concepts to advanced workflows. You'll start by understanding what remote debugging actually is and how the Chrome DevTools Protocol (CDP) makes it possible. From there, you'll set up real connections, debug different types of targets, profile performance in production-like environments, secure your debugging sessions, and eventually automate inspection workflows with scripts. Each chapter builds on the last, so by the time you reach the advanced techniques at the end, the underlying concepts will feel natural rather than abstract.
Why Remote Debugging Matters
Local development environments are convenient, but they're also artificial. Your machine has a fast processor, plenty of RAM, a stable network connection, and a modern operating system. The users running your application often have none of those things. They're on older Android phones with throttled connections, or they're accessing your app through a corporate proxy that modifies headers in unexpected ways. When something breaks for them and not for you, local debugging tools give you almost no useful information.
Remote debugging solves this by letting you inspect the application in its actual environment. Consider a concrete example: a progressive web app that works perfectly in your local Chrome browser but crashes on a specific Android device running Chrome 108. Without remote debugging, your options are limited to reading crash logs and guessing. With remote debugging, you connect your DevTools to that Android device over USB, open the exact page that's failing, and watch the JavaScript error appear in your console in real time. You can then step through the code, inspect variables, and identify the exact line causing the problem.
The value extends well beyond mobile device testing. Production environments often behave differently from local setups because of differences in server configuration, environment variables, caching behavior, and third-party integrations. A memory leak that takes hours to manifest won't show up in a five-minute local test session. Remote debugging lets you attach to a long-running production process and profile its memory over time, capturing the leak as it actually happens rather than trying to simulate it artificially.
Teams also benefit significantly from remote debugging as a collaboration tool. When a developer on your team encounters a bug they can't explain, they can share a debugging session rather than trying to describe the problem in words. You connect to their environment, inspect the same state they're seeing, and work through the issue together. This kind of direct inspection cuts debugging time dramatically compared to the traditional back-and-forth of screenshots and log files.
There's also a growing category of use cases around automation and testing. Headless Chrome instances running in CI/CD pipelines are, at their core, remote debugging targets. Tools like Puppeteer and Playwright are built directly on top of the Chrome DevTools Protocol. Understanding remote debugging at a fundamental level means you understand how those tools work, which makes you far more effective at writing reliable automated tests and diagnosing failures when they occur.
Remote debugging is not a niche skill for specialists. It's a core capability that becomes essential the moment your application leaves your local machine and enters the real world, where environments are unpredictable and bugs don't always cooperate with local reproduction steps.
The Chrome DevTools Protocol, which powers all of this, is a well-documented and actively maintained standard.[1] It's not a proprietary black box. It's a JSON-based communication protocol that you can interact with directly, which means the skills you build here transfer to a wide range of tools and workflows beyond the DevTools UI itself. Learning remote debugging is, in a real sense, learning the underlying language of browser inspection.
Security is another reason remote debugging deserves serious attention. Debugging ports, if left open and unprotected, represent a significant attack surface. Understanding how remote debugging works means understanding how to expose it safely, when to use tunneling, how to restrict access, and when to shut it down entirely. Developers who use remote debugging without understanding its security implications create real risks for their infrastructure. This book addresses those risks directly rather than treating security as an afterthought.
What You'll Learn in This Book
This guide covers remote debugging from the ground up, starting with the concepts and moving steadily toward practical, production-ready techniques. Each chapter focuses on a specific area of knowledge, and together they build a complete picture of what remote debugging can do and how to use it effectively. Here's a clear map of what's ahead.
Chapters 1 and 2 establish the foundation. Chapter 1 explains what remote debugging is, how it differs from local debugging, and where it fits into real development workflows. Chapter 2 goes deeper into the Chrome DevTools Protocol itself, explaining how it works, what its key components are, and why understanding it makes you a more effective debugger. These chapters are conceptual, but they're not abstract. Every concept is grounded in practical examples.
Chapters 3 and 4 focus on setup and connection. You'll learn how to enable remote debugging on different types of targets, configure port forwarding, handle network setup, and make your first successful remote connection. Chapter 4 covers the process of discovering available targets, establishing secure connections, and troubleshooting the most common connection problems. By the end of these two chapters, you'll be able to connect to any Chrome-based target reliably.
Chapters 5 and 6 cover the core debugging workflows. Chapter 5 walks through inspecting DOM elements, setting breakpoints, using the remote console, and monitoring network activity, all in a remote context. Chapter 6 extends this to service workers and background processes, which have their own lifecycle and debugging requirements. These are the chapters you'll return to most often as reference material.
Chapter 7 is dedicated to performance. You'll learn how to capture and analyze performance metrics, profile memory usage to find leaks, identify CPU bottlenecks, and translate profiling data into concrete optimization strategies. This chapter is particularly valuable for developers working on applications where performance directly affects user experience and business outcomes.
Chapter 8 addresses security in depth. It covers the risks of exposing debugging ports, the authentication mechanisms available, and the best practices for keeping remote debugging sessions safe. This chapter is essential reading before you attempt any remote debugging in a production or staging environment.
Chapter 9 opens up the world of automation. You'll learn about CDP client libraries, how to write scripts that interact with remote targets programmatically, and how to set up continuous monitoring and automated testing workflows. This is where remote debugging moves from a manual diagnostic tool to a scalable engineering capability.
Chapter 10 covers advanced techniques including debugging multiple targets simultaneously, working with headless browsers, and applying safe debugging practices in production environments. These are the techniques that separate developers who use remote debugging occasionally from those who use it as a core part of their workflow.
Throughout the book, you'll find concrete examples, step-by-step instructions, and specific commands you can run immediately. The goal is not just to explain what remote debugging is, but to give you the practical skills to use it confidently in your own work. By the last page, remote debugging should feel like a natural extension of your existing toolkit rather than an exotic specialty.
How to Use This Guide
This book is designed to be read sequentially, especially for the first time through. The early chapters build the conceptual foundation that later chapters depend on. If you jump straight to Chapter 7 on performance profiling without understanding how CDP works or how connections are established, some of the techniques will feel disconnected from their underlying mechanics. Reading in order gives you the context to understand not just what to do, but why it works.
That said, once you've read through the book once, it works well as a reference. Each chapter is self-contained enough that you can return to a specific section when you need it. If you're about to debug a service worker and want a refresher on the lifecycle events, Chapter 6 will give you what you need without requiring you to re-read everything before it. The appendix at the back of the book provides a quick reference for CDP commands, recommended tools, and common troubleshooting solutions, which is useful to bookmark for day-to-day work.
The examples in this book use Chrome and Chromium-based browsers as the primary targets. Most of the techniques also apply to other Chromium-based browsers like Microsoft Edge, Brave, and Opera, since they share the same underlying DevTools Protocol. Where there are meaningful differences, the text notes them. Firefox has its own remote debugging protocol, which is outside the scope of this book, though many of the conceptual principles carry over.
To get the most out of this guide, you should have a working development environment set up before you start Chapter 3. You'll need:
- Chrome or a Chromium-based browser installed on your development machine
- Node.js installed (version 16 or later is recommended for the automation chapters)
- A second target to debug, which can be a second browser tab, an Android device, or a local server running a web application
- Basic familiarity with the command line for running Chrome with flags and executing scripts
You don't need any special hardware or paid tools. Everything covered in this book uses freely available software. The Chrome DevTools Protocol is open and well-documented, and the client libraries used in the automation chapters are open-source. The investment required is time and attention, not money.
Each chapter includes practical exercises embedded in the explanations. These aren't formal assignments with graded outcomes. They're specific actions you can take to verify that a concept works the way the text describes. For example, after reading about port forwarding in Chapter 3, you'll have a clear set of steps to try on your own machine. Actually running those steps, rather than just reading about them, is what builds the muscle memory that makes remote debugging feel natural.
The security chapter deserves special mention in terms of how to approach it. Chapter 8 is not optional reading that you can skip if you're in a hurry. Remote debugging exposes powerful capabilities, and those capabilities can be misused if debugging ports are left open or improperly secured. Before you attempt remote debugging on any environment that handles real user data or sits on a shared network, read Chapter 8. The practices described there are straightforward to implement and they protect both your infrastructure and your users.
A note on version specificity: Chrome and the DevTools Protocol are updated frequently. The core concepts in this book are stable and have been consistent across many versions, but specific UI details and some API parameters may change over time. When in doubt, the official Chrome DevTools Protocol documentation is the authoritative source for current method signatures and event names.[2] The concepts you learn here will help you navigate that documentation effectively, even as specific details evolve.
Finally, approach this material with a spirit of experimentation. Remote debugging is a hands-on skill. Reading about it builds understanding, but connecting to a real target and watching the data flow in real time is what makes it click. Set up a simple test application, connect to it remotely, and try breaking things intentionally so you can practice finding and fixing them. The more you experiment, the faster the techniques become second nature. That's the goal: not just knowing that remote debugging exists, but being able to reach for it instinctively when you need it.
This is the end of the free sample. The full book has 10 chapters.
Want this book written for you?
Tell us your goals and background, and get your own version of this book, tailored by AI to you.


Benefits of AI-tailored books
- Read one book, not ten:
- all the Chrome Developer Tools knowledge you need, gathered into a single book.
- Save days of learning:
- tell us your goals, choose your topics, and the whole book is built around them.
- Learn effortlessly:
- Chrome Developer Tools book written for your specific background and expertise.
- Understand at a glance:
- includes charts, tables, timelines, checklists, decision trees, and more.
- Stay current:
- written the day you order it, not years ago.
- Trust what you read:
- every book is checked for accuracy, with real research when your subject needs it.
Create your unique book in 3 steps
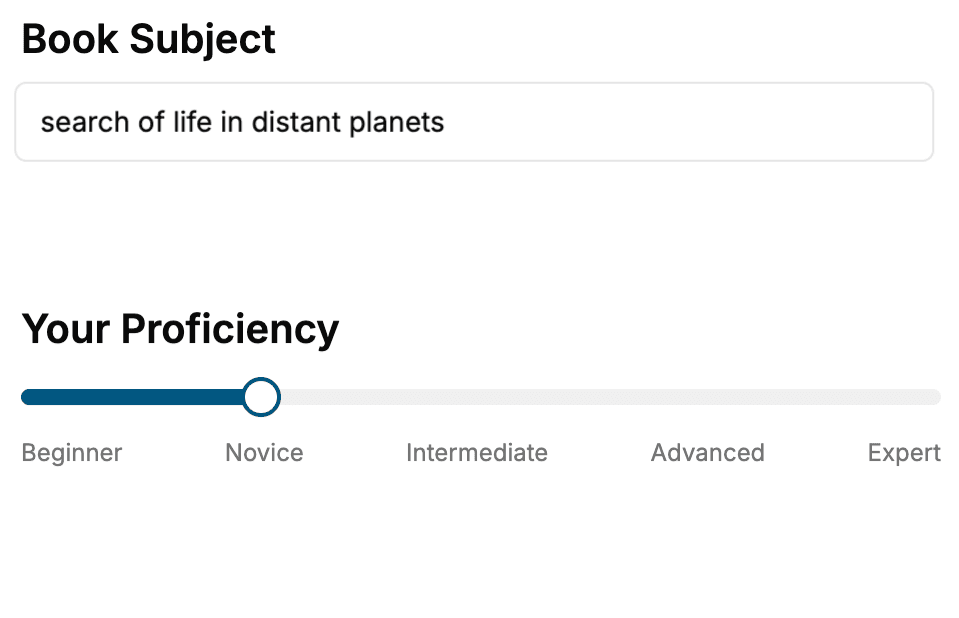
- 1. Select your focus
Select the focus of your Chrome Developer Tools book and share your background
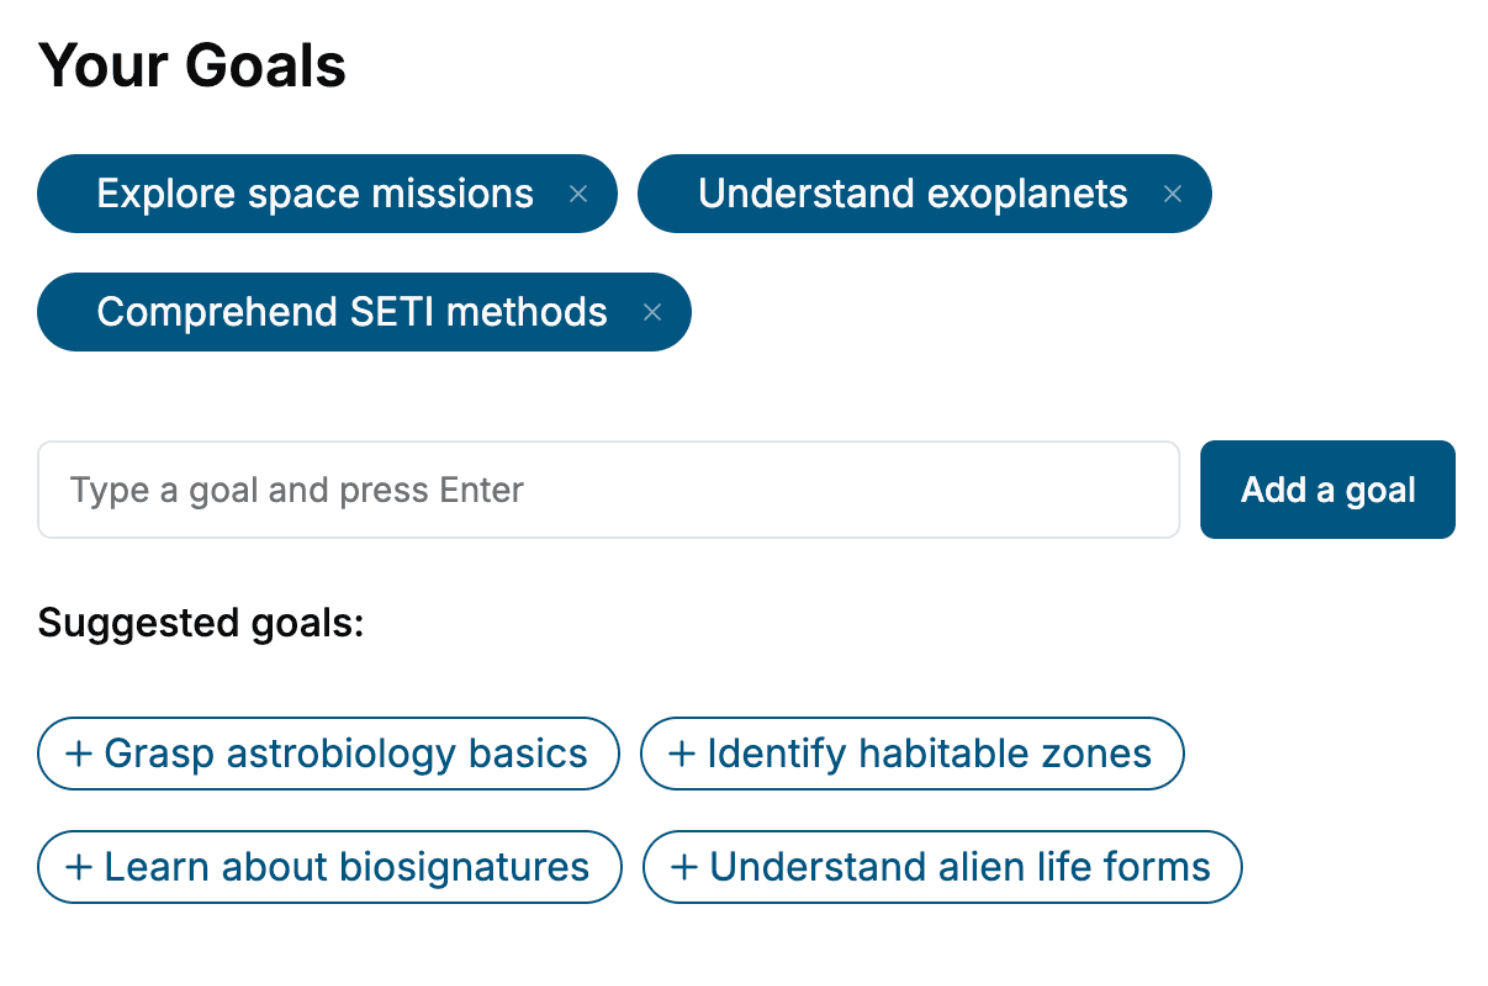
- 2. Personalize your book
Specify your goals and choose sub-topics to include
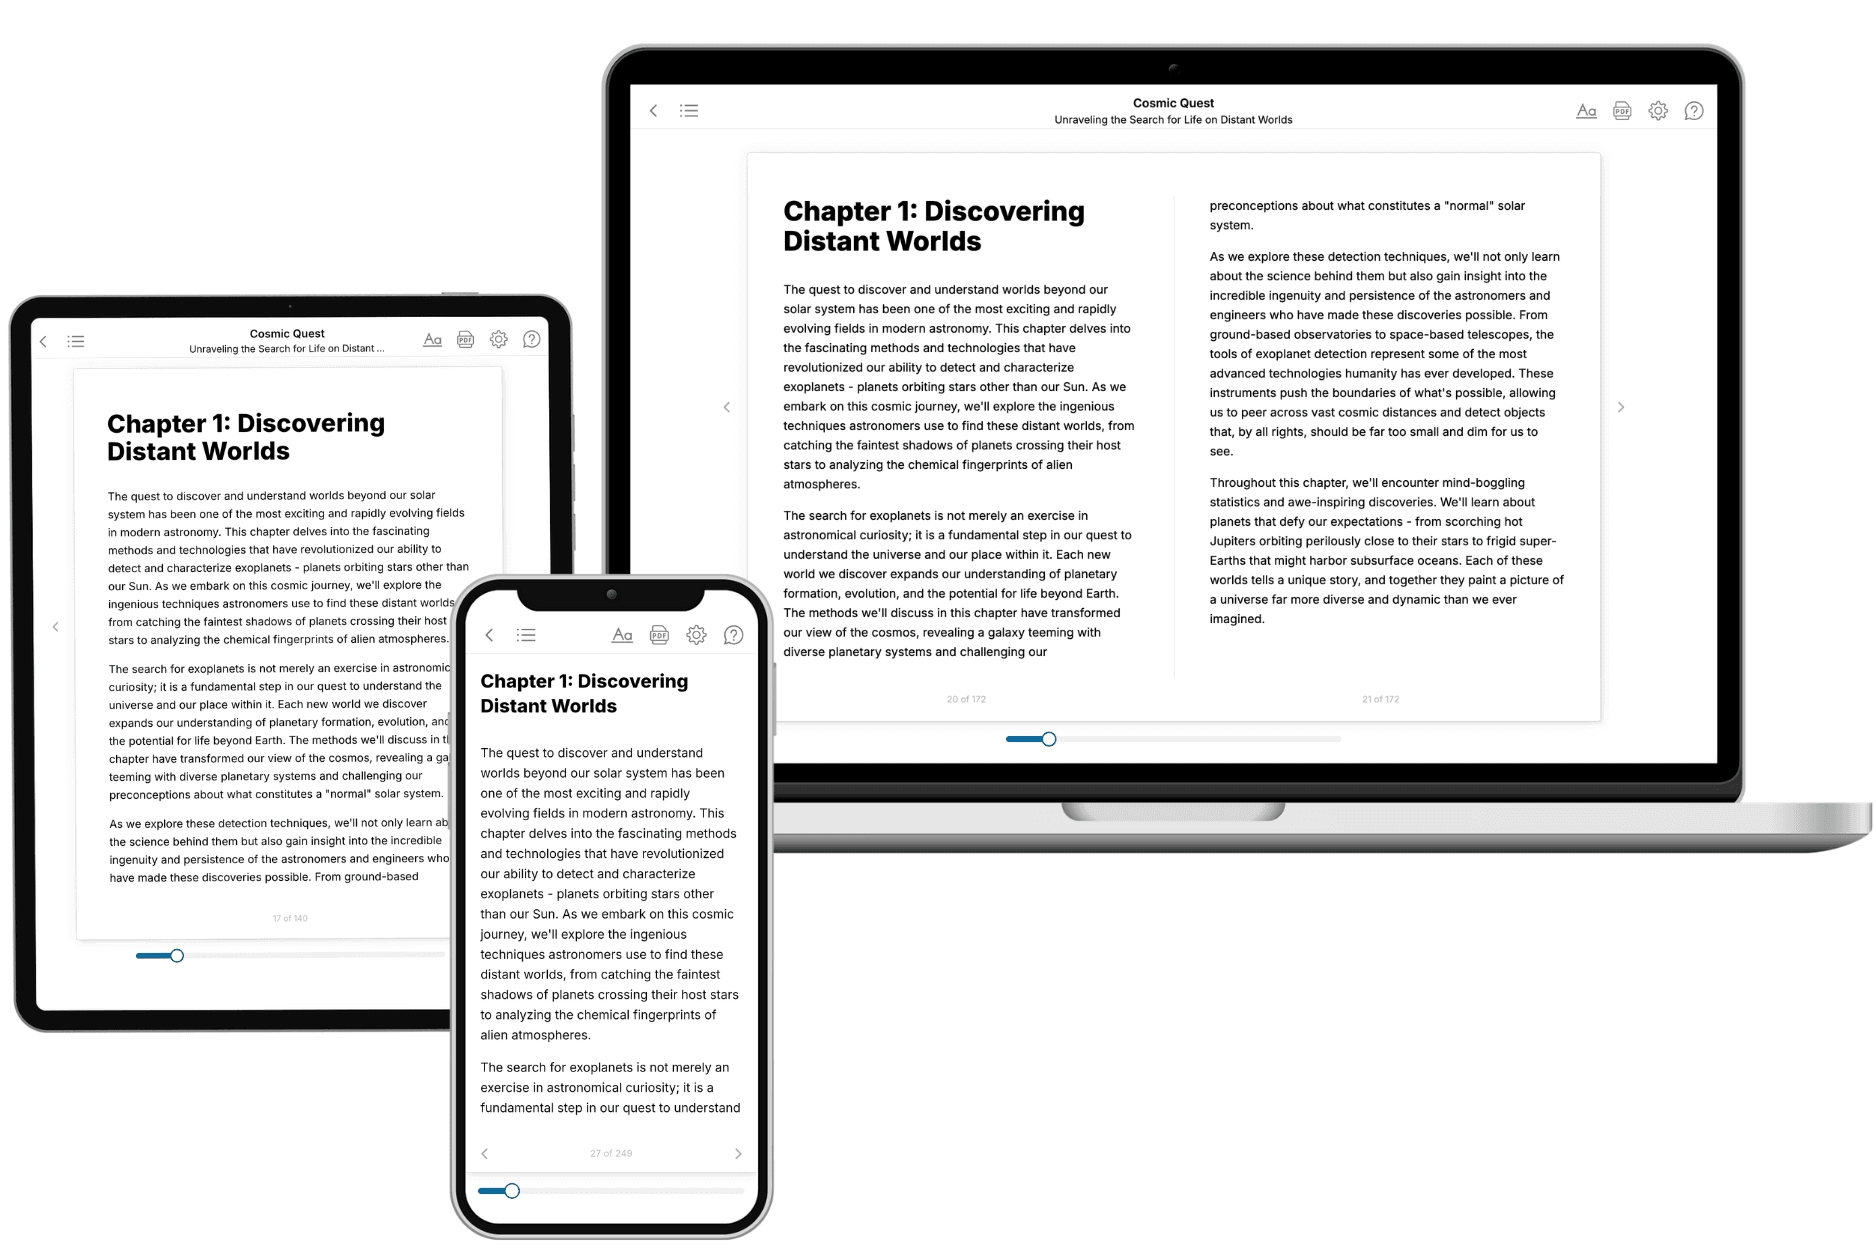
- 3. Get your tailored book
Your book is ready in 10 minutes. Read it online, download as EPUB or PDF, or send to Kindle.
Frequently asked questions
- What is TailoredRead?
TailoredRead creates complete, full-length nonfiction ebooks, written specifically for you. Tell us what you want to learn and why, and TailoredRead writes you a complete ebook on it, with charts, tables, and diagrams throughout. Read it online, on Kindle, or on any e-reader, or download it as a PDF or EPUB. Every book is written fresh the day you order it.
- How is the book tailored to me?
Before anything is written, you answer a few short questions about your goals, your background, and the topics you care about. Your book is then planned around your answers: written at your level, focused on your goals, and covering the topics you chose, instead of the one-size-fits-all book a store sells everyone.
- Will it read like generic AI content?
No. Your book isn't a chat transcript: it's planned chapter by chapter before a single word is written, told in a clear book voice, and explains ideas visually with charts, tables, and diagrams. After writing, every book goes through an editorial pass that polishes chapters so the book reads consistent from start to finish. Judge for yourself: browse thousands of sample books on our Explore Books page.
- How accurate is the content?
Our AI first checks whether your subject needs live research. Niche and fast-moving subjects are researched before writing, and the book plan and chapters are grounded in what it finds. After writing, every book goes through a quality pass that checks its facts and consistency, and researched books list their sources in a Notes section at the back.
- How long is the book?
You choose the length: Comprehensive (250-300 pages), Detailed (150-200 pages), Essential (70-100 pages), or Short (30-50 pages).
- Does the book include visuals?
Yes. Every book includes charts, tables, and diagrams: timelines, checklists, step-by-step guides, decision trees, comparison tables, matrices, and bar charts. A typical book includes dozens of these visual elements.
- Can I read it on Kindle? What formats can I download?
Yes. Every book can be read in our online reader or downloaded as a PDF or EPUB. The EPUB can be opened with Kindle, Apple Books, Kobo, and any e-reader. The Commercial and Author licenses also include an editable Word (DOCX) and Markdown download.
- How much does it cost?
About the price of a regular ebook. The exact price depends on your book's length and complexity, from $2 for the shortest books to $35 for the most comprehensive, and it's shown when you review your book, before you commit to anything. Each book is a one-time purchase, yours to keep, no subscription. Licenses that let you share, teach, or publish your book range from $35.99 to $49.99.
- Can I preview the book before purchasing?
Before you pay, you'll see what your book will cover: the title, a detailed description, the estimated length, and the complete chapter-by-chapter table of contents, so you know what you're getting before you decide. The full text itself is written after you purchase.
- How long does it take to create a book?
About 10 minutes. You can start reading the opening chapters while the rest is still being written.