Computational Statistics in Practice
Master Numerical Algorithms and Statistical Computing for Real-World Problems
Most statisticians and data scientists struggle with the gap between learning statistical theory in textbooks and implementing it in real code.
191 pages9 chaptersMar 24, 2026Statistics
About this book
You understand the concepts, but when you try to build statistical models or analyze large datasets, you hit walls: algorithms that won't converge, results that don't match theory, or computations that take impossibly long. This book closes that gap by teaching you the numerical algorithms and computational techniques that power modern statistical software. You'll learn how floating-point arithmetic affects your results, why certain optimization methods work better than others, how to implement matrix operations efficiently, and when to use simulation-based approaches. Rather than treating computation as a black box, you'll understand the mathematical foundations and practical considerations that separate working code from broken code. With clear explanations, concrete examples, and practical guidance, this book equips you to write reliable statistical software, debug computational problems, and make informed decisions about algorithm selection for your specific challenges.
Table of contents
- IntroductionWhy Computational Statistics Matters, The Gap Between Theory and Practice, What You'll Learn in This Book, How to Use This BookRead below
- Chapter 1: Foundations of Numerical ComputingFloating-Point Representation and Arithmetic, Sources of Numerical Error, Machine Precision and Rounding, Error Propagation in Computations
- Chapter 2: Numerical Stability and Algorithm DesignUnderstanding Numerical Stability, Condition Numbers and Problem Conditioning, Designing and Choosing Stable Algorithms, Testing and Validating Numerical Stability
- Chapter 3: Linear Algebra and Matrix ComputationsEfficient Matrix Operations, Matrix Decompositions: QR, SVD, and Cholesky, Solving Linear Systems Numerically, Computing Eigenvalues and Eigenvectors
- Chapter 4: Optimization Algorithms for Statistical InferenceOptimization Problem Formulation, Gradient Descent and Variants, Newton's Method and Quasi-Newton Approaches, Convergence Diagnostics and Tuning
- Chapter 5: Maximum Likelihood Estimation and the EM AlgorithmComputing Maximum Likelihood Estimates, The Expectation-Maximization Algorithm, EM Convergence and Acceleration, Practical Applications and Case Studies
- Chapter 6: Monte Carlo Methods and SimulationRandom Number Generation and Quality, Monte Carlo Integration and Approximation, Importance Sampling and Variance Reduction, Markov Chain Monte Carlo Fundamentals
- Chapter 7: Computational Complexity and Algorithm SelectionBig-O Notation and Complexity Analysis, Comparing Algorithms: Time and Space Trade-offs, Scalability and Big Data Considerations, Practical Framework for Algorithm Selection
- Chapter 8: Specialized Algorithms for Statistical ModelsAlgorithms for Regression and Generalized Linear Models, Computational Methods for Clustering, Bayesian Computational Methods, Algorithms for Time Series Analysis
- Chapter 9: Practical Implementation and DebuggingStrategies for Implementing Numerical Algorithms, Debugging Numerical and Statistical Code, Performance Optimization Techniques, Validation and Testing Numerical Software
- ConclusionKey Takeaways and Principles, Continuing Your Learning Journey
- Appendix: Quick Reference GuideAlgorithm Reference and Pseudocode, Mathematical Notation and Conventions, Software Libraries and Resources
Introduction
There is a moment that almost every statistician and data scientist knows well. You have worked through the theory, understood the derivations, and followed the textbook proofs step by step. Then you sit down to implement the method in code, and something goes wrong. The algorithm doesn't converge. The numbers look slightly off. A matrix inversion fails silently. The computation runs for hours when it should take seconds. The theory was clear, but the code is broken, and you're not sure why. This gap between statistical theory and working computation is one of the most frustrating and underappreciated challenges in the field.
This book exists to close that gap. Computational Statistics in Practice is a guide to the numerical algorithms and computational techniques that sit between statistical ideas and reliable software. It covers the mechanics of how statistical methods actually get computed: how numbers are stored and manipulated, how optimization algorithms find solutions, how matrix operations scale with data size, and how simulation methods approximate distributions that have no closed form. These are not abstract topics. They are the practical foundations that determine whether your code works correctly, efficiently, and at scale.
The approach throughout this book is direct and applied. Each topic is introduced with enough mathematical context to understand what is happening, then grounded in concrete examples and practical guidance. You will find pseudocode, worked scenarios, and specific advice on common failure modes. The goal is not to replace a numerical analysis textbook or a statistics course. The goal is to give you the working knowledge that those courses often leave out: the knowledge that separates someone who understands statistics from someone who can build statistical software that actually runs.
Whether you are a graduate student implementing your first likelihood estimator, a data scientist debugging a model that won't converge, or a software engineer building statistical infrastructure, this book is written for you. It assumes you have a working familiarity with statistics and programming, but it does not assume you have studied numerical methods formally. Every concept is built from the ground up, with attention to the practical details that matter most in real work.
Why Computational Statistics Matters
Statistics as a discipline was built on analytical methods. For most of its history, a statistical result meant a formula you could write down and evaluate by hand or with simple arithmetic. The normal distribution, the t-test, ordinary least squares regression: these methods were designed to be tractable with pencil and paper. That constraint shaped the entire field, favoring models with clean closed-form solutions over models that might be more realistic but harder to compute.
That constraint no longer applies. Modern computers can perform billions of arithmetic operations per second, and the statistical methods that have emerged to take advantage of this power look very different from classical statistics. Bayesian inference with complex hierarchical models, neural networks with millions of parameters, nonparametric methods that make no distributional assumptions, bootstrap confidence intervals computed from thousands of resamples: none of these would be practical without computational power and the algorithms to use it efficiently.
The scale of modern data has also changed what statistical computation means. A dataset with a million rows and hundreds of variables is now routine in many fields. At that scale, an algorithm that works fine on a small example can become completely impractical. A matrix operation that takes a fraction of a second on a 100-by-100 matrix might take hours on a 10,000-by-10,000 matrix if implemented naively. Understanding computational complexity is no longer optional for anyone doing serious statistical work.
Beyond scale, there is the question of accuracy. Floating-point arithmetic, the system that computers use to represent real numbers, introduces small errors into every calculation. In most cases these errors are negligible. But in statistical computing, where algorithms iterate thousands of times and small errors can compound, numerical precision becomes a genuine concern. A poorly designed algorithm can produce results that are subtly wrong in ways that are hard to detect. Understanding where these errors come from and how to control them is a core skill for anyone writing statistical software.
Computational statistics also matters because it shapes what questions you can ask. If you understand how optimization algorithms work, you can design models that are easier to fit. If you understand Monte Carlo methods, you can approximate quantities that have no analytical form. If you understand matrix decompositions, you can solve regression problems that would otherwise be numerically unstable. Computational knowledge expands your statistical toolkit in ways that pure theory cannot.
A concrete example: Consider fitting a logistic regression model to a dataset where two predictor variables are nearly perfectly correlated. The standard maximum likelihood estimator will struggle because the likelihood surface is nearly flat in one direction. An analyst who only knows the theory might conclude the algorithm is broken. An analyst who understands the numerical geometry of the problem will recognize the near-collinearity, understand why the optimizer is struggling, and know how to address it, whether through regularization, variable selection, or a different parameterization.
The field of computational statistics is also where statistics connects most directly to computer science and applied mathematics. Algorithms developed for numerical linear algebra power statistical software. Optimization methods from operations research are used to fit statistical models. Random number generators from cryptography research underpin Monte Carlo methods. Understanding these connections makes you a more versatile practitioner and helps you draw on a much wider range of tools.
Finally, computational statistics matters because statistical software is not magic. Every function call in R, Python, or Julia is executing a specific numerical algorithm with specific properties, limitations, and failure modes. When you call lm() in R or sklearn.linear_model.LinearRegression() in Python, you are invoking a chain of matrix operations, decompositions, and numerical procedures. Understanding what is happening inside those calls makes you a better user of statistical software and a better debugger when things go wrong.
The Gap Between Theory and Practice
Statistical theory is taught in a world of exact arithmetic. Textbook derivations assume that you can compute logarithms, matrix inverses, and integrals with perfect precision. The mathematical objects involved, real numbers, continuous distributions, infinite-dimensional function spaces, are idealized constructs that don't map directly onto what a computer can represent or compute. This mismatch is the root cause of most computational problems in statistical practice.
One of the most common manifestations of this gap is numerical overflow and underflow. In probability calculations, you often need to multiply many small numbers together. The likelihood of a dataset under a statistical model, for example, is the product of the individual observation probabilities. With even a few hundred observations, this product can be so small that it rounds to zero in floating-point arithmetic, a phenomenon called underflow. The standard fix, working in log-space, is well known, but it requires understanding why the problem occurs in the first place.
Consider a specific scenario that illustrates this well. Suppose you are computing the likelihood of 500 independent observations under a normal distribution. Each individual probability might be around 0.1. The product of 500 such values is 0.1^500, which is approximately 10^(-500). This number is far below the smallest positive number that standard 64-bit floating-point arithmetic can represent (roughly 10^(-308)). The result is stored as exactly zero, and any subsequent computation involving it produces nonsense. Working with log-likelihoods instead avoids this problem entirely, but only if you know to do it.
Another common gap involves matrix operations. Linear algebra textbooks present matrix inversion as a straightforward operation: given a matrix A, compute A-1. In practice, directly inverting a matrix is almost never the right approach in statistical computing. It is numerically unstable, computationally expensive, and usually unnecessary. The right approach is to use a matrix decomposition to solve the underlying linear system. This distinction is not taught in most statistics courses, but it matters enormously in practice.
Optimization is another area where theory and practice diverge sharply. Statistical theory often presents maximum likelihood estimation as a matter of taking derivatives, setting them to zero, and solving. For simple models, this works. For anything more complex, you need an iterative optimization algorithm, and the behavior of that algorithm depends on choices that theory doesn't specify: the starting point, the step size, the convergence criterion, and the handling of constraints. Getting these choices right requires practical knowledge that goes beyond the statistical model itself.
The gap also shows up in how algorithms behave on real data versus textbook examples. Textbook datasets are often clean, well-conditioned, and designed to illustrate a method's properties. Real data is messy. It contains outliers, missing values, near-collinear predictors, and distributional features that violate model assumptions. Algorithms that work perfectly on textbook data can fail badly on real data, and understanding why requires knowing how the algorithm works at a computational level.
A real-world illustration: The k-means clustering algorithm is taught as a simple iterative procedure: assign points to the nearest centroid, update centroids, repeat until convergence. What textbooks often omit is that k-means is sensitive to initialization, can converge to poor local optima, and behaves differently depending on how distances are computed in high-dimensional spaces. A practitioner who only knows the theory might run k-means once and trust the result. A practitioner who understands the computational behavior will run it multiple times with different initializations, check convergence carefully, and be skeptical of results in high dimensions.
There is also a gap in how errors are handled. Statistical theory rarely discusses what happens when a computation fails partway through. In practice, algorithms fail regularly: optimizers diverge, matrix factorizations encounter singular matrices, random number generators produce correlated sequences that bias Monte Carlo estimates. Knowing how to detect these failures, understand their causes, and recover from them is an essential practical skill that theory-focused training doesn't provide.
Closing this gap requires a different kind of knowledge than statistical theory alone provides. It requires understanding how numbers are represented in computers, how algorithms behave under realistic conditions, how to measure and control numerical error, and how to translate mathematical procedures into efficient, reliable code. This is the knowledge that this book is designed to build.
What You'll Learn in This Book
This book is organized around the core computational topics that matter most for statistical practice. Each chapter builds on the previous ones, moving from foundational concepts to more specialized algorithms. Here is a map of what you will encounter and why each topic matters.
Chapters 1 and 2 cover the foundations of numerical computing. Chapter 1 introduces floating-point arithmetic: how computers represent real numbers, where rounding errors come from, and how errors propagate through calculations. Chapter 2 builds on this with the concept of numerical stability, explaining why some algorithms amplify errors while others suppress them, and how to design and choose algorithms that produce reliable results. These two chapters are the bedrock of everything that follows.
Chapter 3 covers linear algebra and matrix computations, which are at the heart of most statistical algorithms. You will learn about efficient matrix operations, the major matrix decompositions (QR, SVD, and Cholesky), and how to solve linear systems numerically. This chapter explains why certain approaches are preferred over others in statistical software and gives you the tools to implement matrix-heavy algorithms correctly.
Chapters 4 and 5 focus on optimization, which is the computational engine of modern statistical inference. Chapter 4 covers the major families of optimization algorithms, from gradient descent to Newton's method, with attention to convergence behavior and practical tuning. Chapter 5 applies these ideas to maximum likelihood estimation and the EM algorithm, two of the most important computational tools in statistics.
Chapter 6 introduces Monte Carlo methods and simulation. You will learn how random numbers are generated and tested for quality, how Monte Carlo integration works, how importance sampling can reduce variance, and the fundamentals of Markov Chain Monte Carlo (MCMC). These methods are essential for Bayesian inference and for approximating distributions that have no closed form.
Chapter 7 covers computational complexity and algorithm selection. You will learn how to analyze the time and space requirements of algorithms using Big-O notation, how to compare algorithms for different problem sizes, and how to think about scalability when working with large datasets. This chapter gives you a framework for making informed decisions about which algorithm to use for a given problem.
Chapter 8 applies the earlier material to specific statistical models, including regression and generalized linear models, clustering methods, Bayesian models, and time series analysis. Each section explains the computational challenges specific to that model class and the algorithms designed to address them.
Chapter 9 focuses on practical implementation and debugging. You will learn strategies for translating mathematical algorithms into working code, techniques for debugging numerical problems, methods for optimizing performance, and approaches to testing and validating statistical software. This chapter is where the theoretical and computational knowledge from earlier chapters gets applied to the practical work of writing and maintaining statistical code.
Throughout the book, you will find:
- Concrete examples with specific numbers and scenarios, not just abstract descriptions
- Pseudocode and code snippets that illustrate key algorithms
- Explanations of common failure modes and how to recognize them
- Practical guidance on algorithm selection and parameter tuning
- References to the research literature for topics where you want to go deeper
By the end of this book, you will have a working understanding of the numerical algorithms that power statistical software, the ability to diagnose and fix computational problems in your own code, and a framework for making informed decisions about algorithm selection and implementation. You will not just know what statistical methods do; you will understand how they work computationally and why that matters.
How to Use This Book
This book is designed to be read sequentially, but it is also structured so that individual chapters can be used as references when you encounter a specific problem. The early chapters on floating-point arithmetic and numerical stability are foundational and will make the later material much easier to understand. If you skip them, you may find yourself confused by discussions of numerical error in later chapters. That said, if you have a strong background in numerical methods already, you can move through Chapters 1 and 2 quickly and use them as a refresher.
The book assumes a working knowledge of statistics at roughly the level of a first graduate course. You should be comfortable with probability distributions, likelihood functions, linear regression, and basic matrix algebra. It also assumes you can read and write code in at least one programming language. Examples in the book use mathematical notation and pseudocode rather than a specific language, so the concepts apply regardless of whether you work in Python, R, Julia, or another environment. Where specific library functions are mentioned, they are used as illustrations, not as requirements.
Each chapter is structured around a set of core concepts, followed by practical applications and examples. The most effective way to use this material is to engage actively with the examples rather than just reading through them. When a numerical example is presented, try to reproduce it yourself. When an algorithm is described, try to implement a simple version before looking at the pseudocode. Active engagement with the material will build the kind of intuition that passive reading cannot.
Pay particular attention to the sections on failure modes and common mistakes. These sections are drawn from real problems that practitioners encounter regularly. Understanding what can go wrong, and why, is often more valuable than understanding the ideal case. Statistical computing is full of situations where an algorithm works perfectly on clean data and fails in subtle ways on real data. Knowing the failure modes in advance puts you in a much stronger position when you encounter them.
If you are using this book as part of a course or structured study program, here are some suggested paths through the material:
- For a focus on numerical foundations: Prioritize Chapters 1, 2, 3, and 9. These chapters give you the core knowledge of floating-point arithmetic, stability, linear algebra, and practical implementation.
- For a focus on optimization and inference: Prioritize Chapters 4, 5, and 8. These chapters cover the optimization algorithms and model-fitting procedures most relevant to statistical inference.
- For a focus on simulation and Bayesian methods: Prioritize Chapters 6 and 8, with Chapter 1 as background. These chapters cover Monte Carlo methods and their application to Bayesian computation.
- For a focus on scalability and algorithm selection: Prioritize Chapters 7 and 9, with Chapter 3 as background. These chapters address computational complexity and practical performance optimization.
The appendix at the end of the book serves as a quick reference guide. It contains pseudocode for the major algorithms covered in the text, a summary of mathematical notation and conventions used throughout the book, and a guide to software libraries and resources for further exploration. When you are working on a specific problem and need a quick reminder of an algorithm's structure or a notation convention, the appendix is the place to look.
One practical suggestion: keep a running list of the computational problems you encounter in your own work as you read through this book. When you hit a section that addresses one of those problems, the material will be much more concrete and memorable. Computational statistics is a subject that is best learned in connection with real problems. The more you can connect the concepts in this book to challenges you have actually faced, the more useful the knowledge will be.
Finally, this book is a starting point, not an endpoint. Computational statistics is a broad and active field, and no single book can cover all of it. Each chapter includes references to more specialized resources for readers who want to go deeper on a particular topic. The goal here is to give you a solid, practical foundation that makes those more advanced resources accessible and to equip you with the core skills that apply across the widest range of statistical computing problems. From that foundation, you can build in whatever direction your work takes you.
This is the end of the free sample. The full book has 9 chapters.
Want this book written for you?
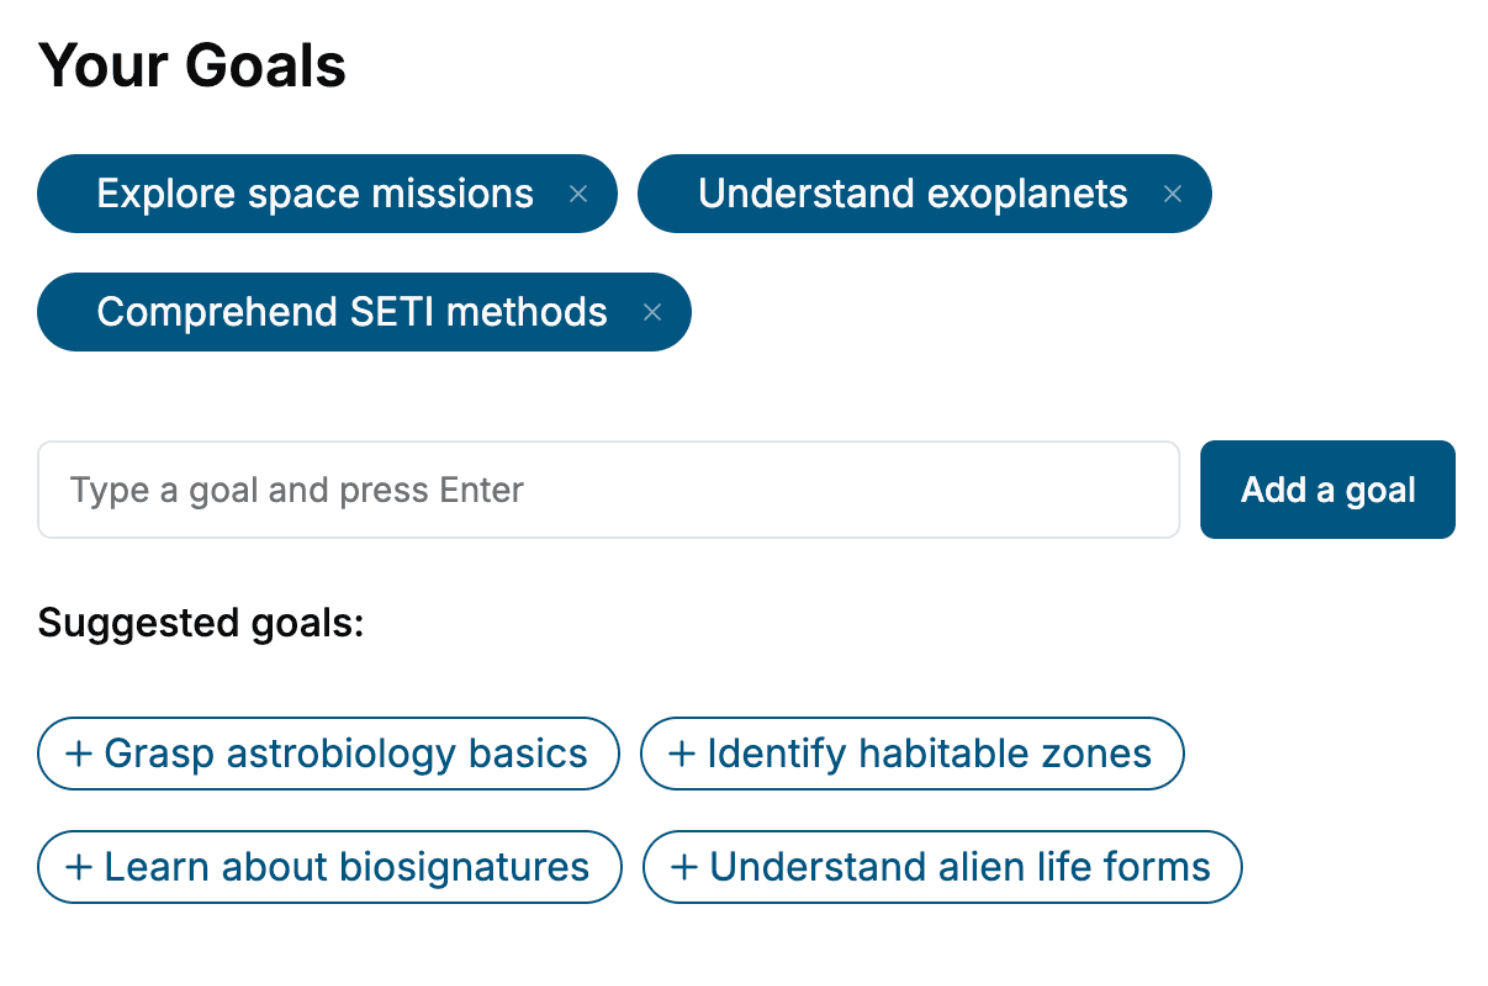
Tell us your goals and background, and get your own version of this book, tailored by AI to you.


Benefits of AI-tailored books
- Read one book, not ten:
- all the Statistics knowledge you need, gathered into a single book.
- Save days of learning:
- tell us your goals, choose your topics, and the whole book is built around them.
- Learn effortlessly:
- Statistics book written for your specific background and expertise.
- Understand at a glance:
- includes charts, tables, timelines, checklists, decision trees, and more.
- Stay current:
- written the day you order it, not years ago.
- Trust what you read:
- every book is checked for accuracy, with real research when your subject needs it.
Create your unique book in 3 steps
- 1. Select your focus
Select the focus of your Statistics book and share your background
- 2. Personalize your book
Specify your goals and choose sub-topics to include
- 3. Get your tailored book
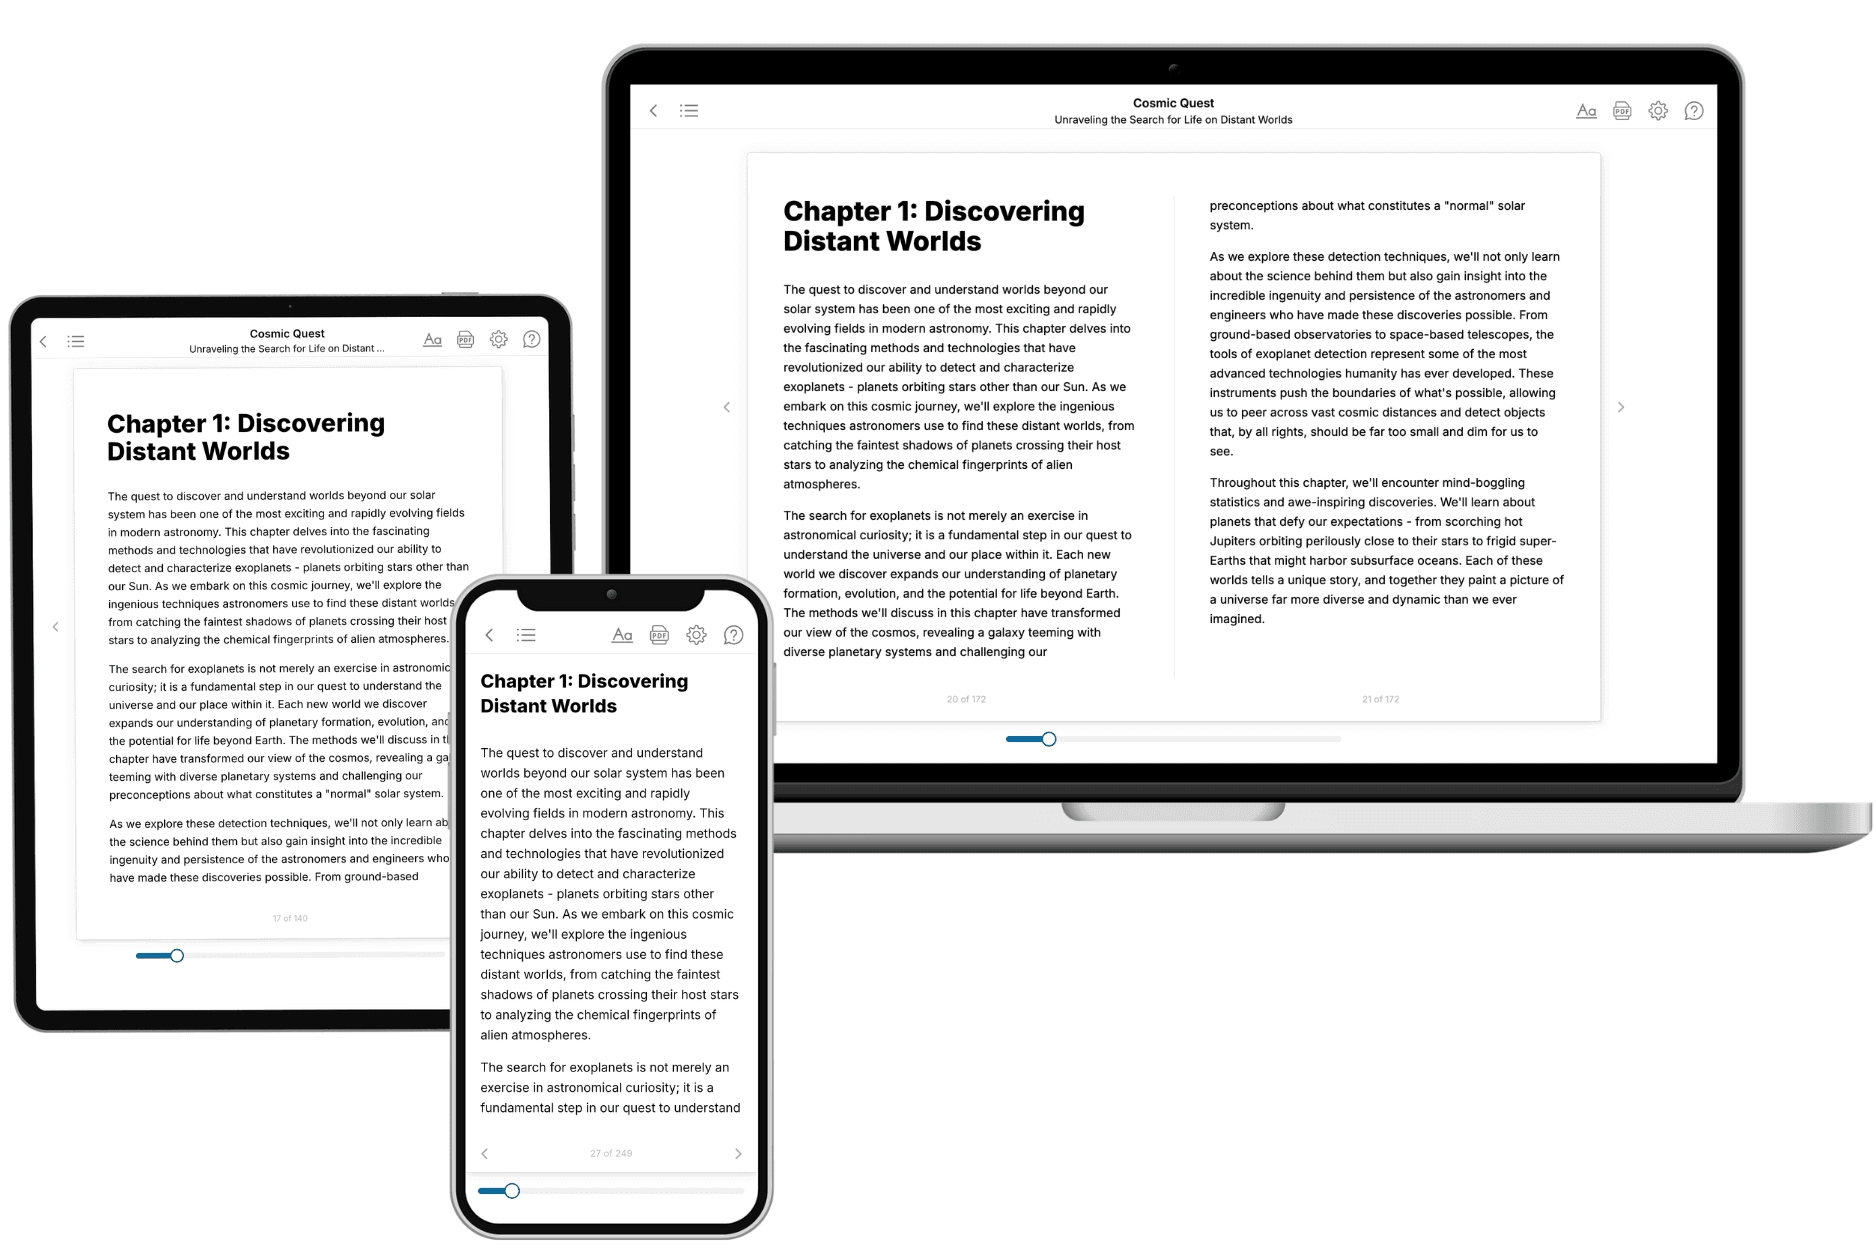
Your book is ready in 10 minutes. Read it online, download as EPUB or PDF, or send to Kindle.

Frequently asked questions
- What is TailoredRead?
TailoredRead creates complete, full-length nonfiction ebooks, written specifically for you. Tell us what you want to learn and why, and TailoredRead writes you a complete ebook on it, with charts, tables, and diagrams throughout. Read it online, on Kindle, or on any e-reader, or download it as a PDF or EPUB. Every book is written fresh the day you order it.
- How is the book tailored to me?
Before anything is written, you answer a few short questions about your goals, your background, and the topics you care about. Your book is then planned around your answers: written at your level, focused on your goals, and covering the topics you chose, instead of the one-size-fits-all book a store sells everyone.
- Will it read like generic AI content?
No. Your book isn't a chat transcript: it's planned chapter by chapter before a single word is written, told in a clear book voice, and explains ideas visually with charts, tables, and diagrams. After writing, every book goes through an editorial pass that polishes chapters so the book reads consistent from start to finish. Judge for yourself: browse thousands of sample books on our Explore Books page.
- How accurate is the content?
Our AI first checks whether your subject needs live research. Niche and fast-moving subjects are researched before writing, and the book plan and chapters are grounded in what it finds. After writing, every book goes through a quality pass that checks its facts and consistency, and researched books list their sources in a Notes section at the back.
- How long is the book?
You choose the length: Comprehensive (250-300 pages), Detailed (150-200 pages), Essential (70-100 pages), or Short (30-50 pages).
- Does the book include visuals?
Yes. Every book includes charts, tables, and diagrams: timelines, checklists, step-by-step guides, decision trees, comparison tables, matrices, and bar charts. A typical book includes dozens of these visual elements.
- Can I read it on Kindle? What formats can I download?
Yes. Every book can be read in our online reader or downloaded as a PDF or EPUB. The EPUB can be opened with Kindle, Apple Books, Kobo, and any e-reader. The Commercial and Author licenses also include an editable Word (DOCX) and Markdown download.
- How much does it cost?
About the price of a regular ebook. The exact price depends on your book's length and complexity, from $2 for the shortest books to $35 for the most comprehensive, and it's shown when you review your book, before you commit to anything. Each book is a one-time purchase, yours to keep, no subscription. Licenses that let you share, teach, or publish your book range from $35.99 to $49.99.
- Can I preview the book before purchasing?
Before you pay, you'll see what your book will cover: the title, a detailed description, the estimated length, and the complete chapter-by-chapter table of contents, so you know what you're getting before you decide. The full text itself is written after you purchase.
- How long does it take to create a book?
About 10 minutes. You can start reading the opening chapters while the rest is still being written.