Correlation Coefficients Decoded
Master the Math Behind Relationships in Data and Algorithms
Discover how to accurately interpret correlation coefficients and leverage them to make better decisions in data analysis and algorithm development.
176 pages9 chaptersMar 27, 2026Statistics
About this book
This book takes you beyond surface-level understanding to reveal the mathematical foundations, practical interpretations, and real-world applications of correlation in computer science. You'll learn when to use Pearson's r versus Spearman's rho, how to distinguish correlation from causation, and why context matters more than the number itself. Through clear explanations, practical examples, and algorithmic applications, you'll master the tools that data scientists and engineers use daily. Whether you're building machine learning models, selecting features, or analyzing relationships in complex datasets, this guide equips you with the knowledge to interpret correlations confidently and apply them effectively in your work.
Table of contents
- IntroductionWhy Correlation Matters in Modern Data Science, What You'll Learn in This Book, How to Use This GuideRead below
- Chapter 1: Foundations of CorrelationDefining Correlation: Beyond the Basics, Historical Development of Correlation Analysis, The Critical Distinction: Correlation vs. Causation
- Chapter 2: Pearson's Correlation CoefficientMathematical Foundation and Formula, Calculating Pearson's r Step by Step, Assumptions and Requirements for Pearson's r
- Chapter 3: Alternative Correlation CoefficientsSpearman's Rank Correlation Coefficient, Kendall's Tau and Other Measures, Choosing the Right Coefficient for Your Data
- Chapter 4: Interpreting Correlation CoefficientsUnderstanding Strength and Direction, Effect Size vs. Statistical Significance, Practical Significance in Real-World Contexts
- Chapter 5: Visualizing CorrelationsScatter Plots and Pattern Recognition, Correlation Matrices and Heatmaps, Advanced Visualization Techniques
- Chapter 6: Common Pitfalls and MisconceptionsThe Impact of Outliers on Correlation, Missing Nonlinear Relationships, Multiple Comparisons and False Discoveries
- Chapter 7: Correlation in Machine LearningFeature Selection and Multicollinearity, Dimensionality Reduction Techniques, Using Correlation for Model Diagnostics
- Chapter 8: Advanced Correlation TechniquesPartial Correlation and Controlling Variables, Correlation in Time Series Analysis, Correlation-Based Clustering and Similarity
- Chapter 9: Real-World Case StudiesCase Study 1: Feature Engineering in Predictive Models, Case Study 2: Detecting Anomalies Through Correlation, Case Study 3: Algorithm Optimization Using Correlation Analysis
- ConclusionKey Takeaways and Next Steps, Resources for Continued Learning
Introduction
Every day, data scientists, engineers, and analysts make decisions based on relationships they observe in data. A recommendation engine notices that users who buy running shoes also tend to buy fitness trackers. A fraud detection system flags transactions that behave differently from a customer's usual patterns. A machine learning model drops a feature because it moves in lockstep with another one already in the dataset. Behind all of these decisions, quietly doing the heavy lifting, is a single mathematical concept: the correlation coefficient. It is one of the most widely used tools in data analysis, and also one of the most frequently misunderstood.
The idea of measuring how two things move together is not new. Statisticians have been formalizing this concept since the late 1800s, and the core formulas have remained remarkably stable ever since. What has changed dramatically is the scale and complexity of the problems these tools are now applied to. Modern datasets can contain hundreds of variables, millions of rows, and relationships that are subtle, nonlinear, or buried under noise. In that environment, knowing how to compute a correlation coefficient is only the beginning. Knowing how to interpret it, when to trust it, and when to question it is where real analytical skill lives.
This book was written for people who already have some grounding in statistics or data science and want to go deeper. If you have seen the formula for Pearson's r before but are not entirely sure why it works the way it does, this book will fill that gap. If you have used correlation in a project but felt uncertain about whether you were applying it correctly, this book will give you a clearer framework. And if you are building machine learning systems and want to understand how correlation shapes feature selection, dimensionality reduction, and model diagnostics, this book will connect those dots in a practical, concrete way.
The chapters ahead move from foundational concepts to advanced applications, building knowledge layer by layer. Along the way, you will encounter real examples, worked calculations, visualizations, and case studies drawn from the kinds of problems that come up in actual data science and engineering work. The goal is not just to explain what correlation coefficients are, but to help you use them with confidence and interpret them with appropriate skepticism. That combination of confidence and skepticism is what separates good data analysis from great data analysis.
Why Correlation Matters in Modern Data Science
Correlation is everywhere in data science, often operating in the background without being explicitly named. When a streaming platform recommends a show you end up loving, that recommendation was likely built on a foundation of correlation analysis. The system identified that your viewing behavior correlates strongly with a cluster of other users, and it used that relationship to predict what you would enjoy next. The math underneath that experience is not magic. It is a structured way of measuring how closely two sets of values move together.
In machine learning, correlation plays a central role in feature selection, which is the process of deciding which input variables to include in a model. If two features are highly correlated with each other, including both of them often adds noise without adding useful information. This problem, known as multicollinearity, can destabilize regression models and make their outputs harder to interpret. Identifying and handling correlated features is one of the first things a careful data scientist does before training a model.[1]
Beyond feature selection, correlation analysis is a core tool for exploratory data analysis (EDA). Before building any model or running any formal test, experienced analysts look at correlation matrices to get a quick picture of how variables relate to each other. This early-stage scan can reveal unexpected relationships, flag potential data quality issues, and guide the direction of deeper investigation. It is one of the fastest ways to develop intuition about a new dataset.
Correlation also matters in algorithm design and evaluation. When you are comparing the outputs of two different models, or checking whether a model's predictions track the actual outcomes, you are essentially asking a correlation question. Metrics like the Pearson correlation between predicted and actual values are used routinely to assess model performance in regression tasks. Even in clustering and anomaly detection, correlation-based similarity measures drive how algorithms group data points and identify outliers.
Consider a concrete example from finance. Portfolio managers use correlation to understand how different assets move relative to each other. A portfolio where all assets are highly correlated offers little diversification. If one asset drops, they all tend to drop together. By selecting assets with low or negative correlations, managers can build portfolios that are more resilient to market shocks. This is not just theory. It is the mathematical backbone of modern portfolio theory, formalized by Harry Markowitz in the 1950s and still in active use today.[2]
The stakes of getting correlation analysis right are real. Misinterpreting a correlation coefficient can lead to dropping a valuable feature, keeping a redundant one, drawing false conclusions about causation, or building a model on a relationship that does not generalize. These are not abstract errors. They translate into worse predictions, flawed products, and decisions made on shaky ground. Understanding correlation deeply is not an academic exercise. It is a practical skill with direct consequences for the quality of your work.
One of the most important things to understand early is that correlation has limits. It measures linear relationships by default, which means it can completely miss a strong nonlinear pattern. Two variables can have a correlation of nearly zero and still be tightly related in a curved or cyclical way. Knowing this limitation is just as important as knowing how to calculate the coefficient itself. The chapters ahead will return to this point repeatedly, because it is one of the most common sources of analytical error in practice.
What You'll Learn in This Book
This book covers correlation coefficients from the ground up, but it does not linger on basics longer than necessary. The goal is to move quickly from understanding to application, giving you both the conceptual clarity and the practical tools to work with correlation confidently in real data science contexts. Here is a clear picture of what each part of the book covers and what you will be able to do after reading it.
The opening chapters establish the mathematical and conceptual foundations of correlation. You will learn what a correlation coefficient actually measures at a mathematical level, how the concept developed historically, and why the distinction between correlation and causation is so critical. These chapters are not just background. They build the mental models that make everything else easier to understand and apply correctly.
From there, the book moves into the three most important correlation coefficients used in practice:
- Pearson's r, the standard measure for linear relationships between continuous variables, including its formula, assumptions, and step-by-step calculation
- Spearman's rho, the rank-based alternative that works better with ordinal data or when the normality assumption is violated
- Kendall's tau, a robust measure particularly useful for small samples and data with many tied ranks
A full chapter is dedicated to interpretation, because computing a coefficient is only half the job. You will learn how to assess the strength and direction of a relationship, how to distinguish statistical significance from practical significance, and why a correlation of 0.3 might be highly meaningful in one context and essentially useless in another. This chapter addresses one of the most common gaps in how correlation is taught and applied.
Visualization is covered in depth because numbers alone rarely tell the full story. You will learn how to use scatter plots to spot patterns, outliers, and nonlinear relationships that a coefficient alone would miss. You will also learn how to build and read correlation matrices and heatmaps, which are essential tools for working with datasets that have many variables. Advanced visualization techniques for communicating correlation findings to non-technical audiences are also included.
The book then turns to common pitfalls and misconceptions. This is one of the most practically valuable sections, covering how outliers can distort correlation values, how nonlinear relationships can be invisible to standard measures, and how running many correlation tests at once inflates the risk of false discoveries. Each pitfall comes with a concrete example and a clear strategy for avoiding or correcting it.
The final chapters focus on advanced and applied topics that are directly relevant to modern data science and machine learning work:
- Using correlation for feature selection and handling multicollinearity in predictive models
- How correlation underpins dimensionality reduction techniques like Principal Component Analysis (PCA)
- Partial correlation, which lets you measure the relationship between two variables while controlling for the influence of others
- Correlation in time series analysis, including autocorrelation and cross-correlation
- Correlation-based clustering and similarity measures used in unsupervised learning
The book closes with three detailed real-world case studies that show how correlation analysis fits into complete data science workflows. These are not toy examples. They are structured around the kinds of problems that come up in predictive modeling, anomaly detection, and algorithm optimization. By the end, you will have a clear picture of how correlation analysis works in practice, not just in theory.
How to Use This Guide
This book is designed to be read sequentially, but it is also structured so that you can navigate directly to the sections most relevant to your current work. If you are new to correlation analysis or want to make sure your foundations are solid, reading from the beginning is the right approach. The early chapters build concepts that later chapters depend on, and skipping them can leave gaps that make the advanced material harder to follow.
If you already have a working understanding of Pearson's r and the basic interpretation of correlation coefficients, you can move more quickly through the first two chapters and spend more time on the sections covering alternative coefficients, interpretation nuances, and machine learning applications. The chapter on common pitfalls is worth reading carefully regardless of your experience level, because many of the errors it covers are made by experienced practitioners, not just beginners.
Throughout the book, you will find several recurring elements designed to make the material more concrete and actionable:
- Worked examples that walk through calculations step by step, so you can see exactly how a formula produces a result
- Practical scenarios that show how a concept applies in a real data science or engineering context
- Warning boxes that flag common mistakes and explain how to avoid them
- Decision frameworks that help you choose the right tool or approach for a given situation
- Code-adjacent notation that connects mathematical formulas to the way they are implemented in tools like Python and R
The mathematical content in this book is presented at an intermediate level. Formulas are included and explained, but the focus is always on understanding what the formula is doing and why, not on deriving it from first principles. If you are comfortable with basic algebra and have seen summation notation before, you will be able to follow all of the mathematical content without difficulty. If a particular formula feels unfamiliar, the surrounding explanation is designed to give you enough context to understand its meaning even before the notation becomes fully clear.
One practical suggestion: work through the examples actively rather than just reading them. When a calculation is presented step by step, try to follow along with your own numbers or replicate the result in a spreadsheet or coding environment. Active engagement with the math makes it stick in a way that passive reading does not. The same applies to the visualization sections. If you have access to a dataset, try building the plots described in the text. Seeing a correlation matrix for data you actually care about is far more instructive than looking at a generic example.
The goal of this book is not to make you a statistician. It is to make you a more effective data scientist and engineer by giving you a deep, practical understanding of one of the most fundamental tools in the field. Correlation coefficients are simple enough to compute in a single line of code, but rich enough to reward careful study. The pages ahead are designed to give you both the speed of the simple version and the depth of the careful one.
A note on tools and software: this book is not tied to any specific programming language or platform. Examples reference Python and R where relevant, because those are the most common environments for data science work, but the concepts apply equally in any analytical environment. The focus is always on the underlying idea, not the syntax. If you work primarily in SQL, Julia, or a spreadsheet tool, the concepts translate directly even when the specific commands differ.
Finally, approach this material with a healthy sense of skepticism, not just about correlation as a tool, but about any single analytical method. Correlation coefficients are powerful and widely applicable, but they are not a complete picture of any relationship. The best analysts use them as a starting point for investigation, not as a final answer. That mindset, curious, rigorous, and appropriately cautious, is the one this book is designed to cultivate. Carry it with you through every chapter, and it will serve you well beyond the pages of this guide.
The journey from surface-level familiarity to genuine mastery of correlation analysis is shorter than it might seem. The concepts build on each other in a logical way, and each new layer of understanding makes the previous ones clearer in retrospect. By the time you reach the case studies at the end, you will likely find yourself looking back at the introductory material and seeing it in a richer, more connected way. That is exactly how it should feel. Let's get started.
This is the end of the free sample. The full book has 9 chapters.
Want this book written for you?
Tell us your goals and background, and get your own version of this book, tailored by AI to you.


Benefits of AI-tailored books
- Read one book, not ten:
- all the Statistics knowledge you need, gathered into a single book.
- Save days of learning:
- tell us your goals, choose your topics, and the whole book is built around them.
- Learn effortlessly:
- Statistics book written for your specific background and expertise.
- Understand at a glance:
- includes charts, tables, timelines, checklists, decision trees, and more.
- Stay current:
- written the day you order it, not years ago.
- Trust what you read:
- every book is checked for accuracy, with real research when your subject needs it.
Create your unique book in 3 steps
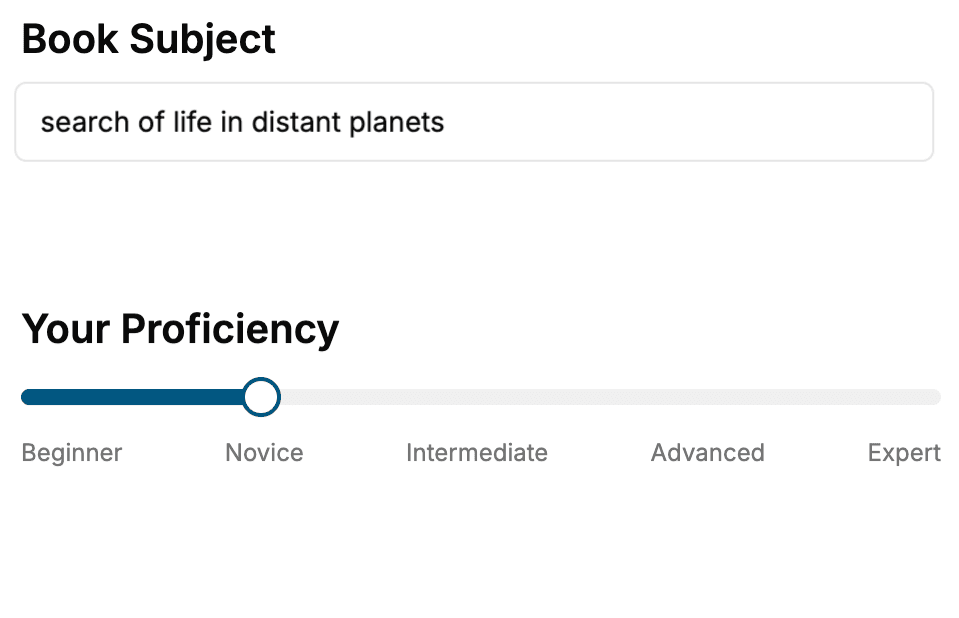
- 1. Select your focus
Select the focus of your Statistics book and share your background
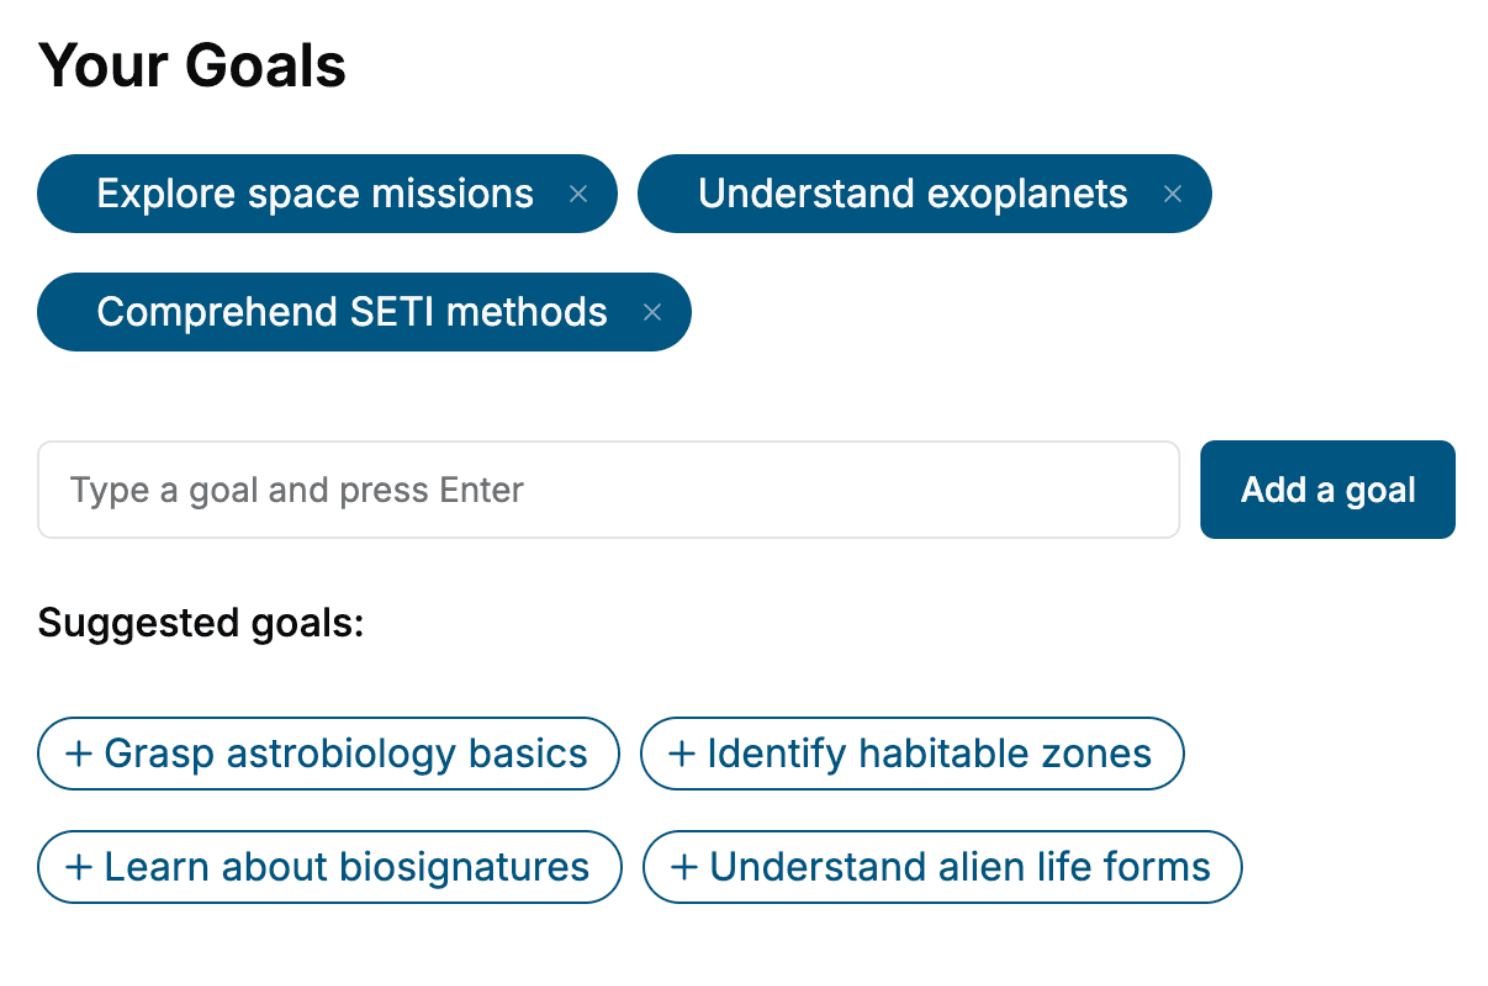
- 2. Personalize your book
Specify your goals and choose sub-topics to include
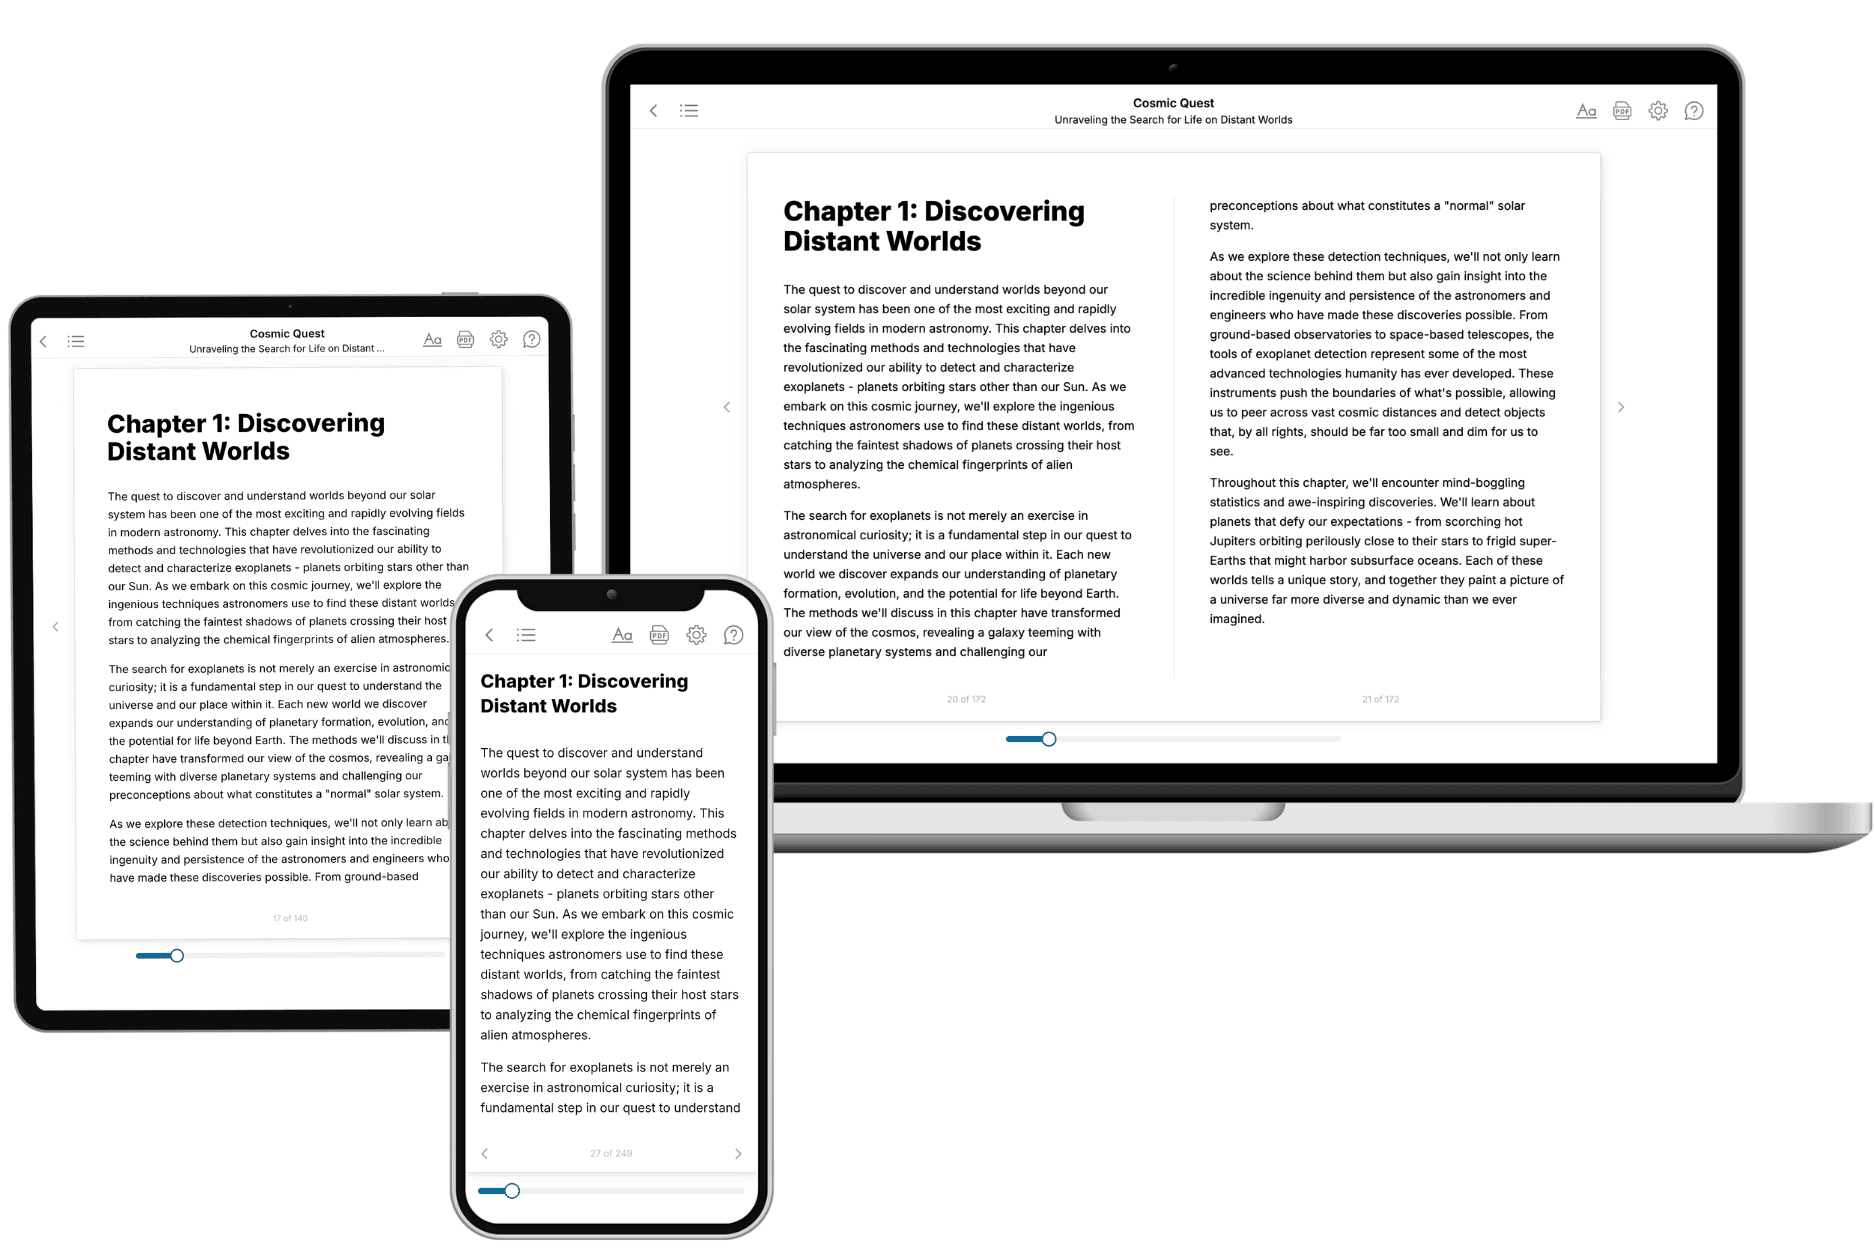
- 3. Get your tailored book
Your book is ready in 10 minutes. Read it online, download as EPUB or PDF, or send to Kindle.
Frequently asked questions
- What is TailoredRead?
TailoredRead creates complete, full-length nonfiction ebooks, written specifically for you. Tell us what you want to learn and why, and TailoredRead writes you a complete ebook on it, with charts, tables, and diagrams throughout. Read it online, on Kindle, or on any e-reader, or download it as a PDF or EPUB. Every book is written fresh the day you order it.
- How is the book tailored to me?
Before anything is written, you answer a few short questions about your goals, your background, and the topics you care about. Your book is then planned around your answers: written at your level, focused on your goals, and covering the topics you chose, instead of the one-size-fits-all book a store sells everyone.
- Will it read like generic AI content?
No. Your book isn't a chat transcript: it's planned chapter by chapter before a single word is written, told in a clear book voice, and explains ideas visually with charts, tables, and diagrams. After writing, every book goes through an editorial pass that polishes chapters so the book reads consistent from start to finish. Judge for yourself: browse thousands of sample books on our Explore Books page.
- How accurate is the content?
Our AI first checks whether your subject needs live research. Niche and fast-moving subjects are researched before writing, and the book plan and chapters are grounded in what it finds. After writing, every book goes through a quality pass that checks its facts and consistency, and researched books list their sources in a Notes section at the back.
- How long is the book?
You choose the length: Comprehensive (250-300 pages), Detailed (150-200 pages), Essential (70-100 pages), or Short (30-50 pages).
- Does the book include visuals?
Yes. Every book includes charts, tables, and diagrams: timelines, checklists, step-by-step guides, decision trees, comparison tables, matrices, and bar charts. A typical book includes dozens of these visual elements.
- Can I read it on Kindle? What formats can I download?
Yes. Every book can be read in our online reader or downloaded as a PDF or EPUB. The EPUB can be opened with Kindle, Apple Books, Kobo, and any e-reader. The Commercial and Author licenses also include an editable Word (DOCX) and Markdown download.
- How much does it cost?
About the price of a regular ebook. The exact price depends on your book's length and complexity, from $2 for the shortest books to $35 for the most comprehensive, and it's shown when you review your book, before you commit to anything. Each book is a one-time purchase, yours to keep, no subscription. Licenses that let you share, teach, or publish your book range from $35.99 to $49.99.
- Can I preview the book before purchasing?
Before you pay, you'll see what your book will cover: the title, a detailed description, the estimated length, and the complete chapter-by-chapter table of contents, so you know what you're getting before you decide. The full text itself is written after you purchase.
- How long does it take to create a book?
About 10 minutes. You can start reading the opening chapters while the rest is still being written.