Data Envelopment Analysis
A Practical Guide to Measuring Efficiency and Optimizing Performance
Achieve accurate efficiency measurement and unlock hidden performance improvement opportunities in your organization.
238 pages11 chaptersMar 24, 2026Operations Research
About this book
This comprehensive guide demystifies Data Envelopment Analysis, a powerful mathematical modeling technique used by leading organizations worldwide to evaluate performance across multiple dimensions simultaneously. You'll learn how DEA constructs efficiency frontiers, identifies best-practice benchmarks, and reveals specific improvement targets for underperforming units. Through clear explanations, practical examples, and step-by-step applications, you'll understand when and how to apply different DEA models, interpret results correctly, and avoid common pitfalls. Whether you're optimizing hospital operations, evaluating bank branches, assessing school performance, or improving manufacturing efficiency, this book provides the mathematical foundation and practical tools you need. Discover how to transform raw performance data into strategic insights that drive measurable organizational improvement.
Table of contents
- IntroductionWhy Efficiency Measurement Matters, Limitations of Traditional Performance Metrics, What is Data Envelopment Analysis?, How to Use This BookRead below
- Chapter 1: Foundations of Efficiency AnalysisDefining Efficiency in Mathematical Terms, The Inputs and Outputs Framework, Understanding the Efficiency Frontier
- Chapter 2: The Mathematics Behind DEALinear Programming Fundamentals, DEA Mathematical Formulation, Solving DEA Problems Step-by-Step
- Chapter 3: CCR Model: Constant Returns to ScaleUnderstanding the CCR Model, Radial Efficiency Measurement, Applying CCR in Practice
- Chapter 4: BCC Model: Variable Returns to ScaleUnderstanding the BCC Model, Scale Efficiency and Optimal Scale, Applying BCC in Practice
- Chapter 5: Slack Variables and Target SettingUnderstanding Slack Variables, Identifying Specific Improvement Targets, Benchmarking Against Efficient Peers
- Chapter 6: Data Preparation and QualityData Collection and Validation Strategies, Detecting and Handling Outliers, Data Normalization and Scaling
- Chapter 7: Sensitivity Analysis and RobustnessSensitivity Analysis Methods, Testing Result Stability and Reliability, Cross-Validation and Bootstrap Methods
- Chapter 8: Real-World Applications and Case StudiesHealthcare: Hospital and Clinic Efficiency, Banking: Branch Performance Evaluation, Education: School and University Assessment
- Chapter 9: Advanced DEA Techniques and ExtensionsSuper-Efficiency and Ranking Models, Dynamic DEA and Temporal Analysis, Fuzzy DEA and Handling Uncertainty
- Chapter 10: Integration with Other MethodsCombining DEA with Regression Analysis, DEA and Machine Learning Integration, DEA in Multi-Criteria Decision Making
- Chapter 11: Implementation and Software ToolsOverview of DEA Software and Tools, Implementing DEA in Spreadsheets, Using R, Python, and Other Programming Languages
- ConclusionKey Takeaways and Best Practices, Future Directions in Efficiency Analysis
- Glossary of Terms
- Further Reading and Resources
Introduction
Every organization, at some point, faces the same fundamental question: are we getting the most out of what we have? Whether you manage a hospital, run a network of bank branches, oversee a school district, or optimize a manufacturing plant, the pressure to do more with less is constant. Performance measurement sits at the heart of that challenge. Without a reliable way to measure efficiency, decisions about where to invest, where to cut, and where to improve are little more than educated guesses. This book gives you a rigorous, practical method for answering that question with confidence.
Data Envelopment Analysis, commonly known as DEA, is a mathematical technique that measures the relative efficiency of organizational units by comparing how well each one converts inputs into outputs. It was first introduced by Charnes, Cooper, and Rhodes in 1978, and it has since grown into one of the most widely used tools in operations research, management science, and public policy evaluation.[1] Today, DEA is applied in hundreds of industries across dozens of countries, from evaluating the efficiency of public hospitals in the United Kingdom to benchmarking bank branches in Brazil.
What makes DEA genuinely powerful is its ability to handle complexity that simpler metrics cannot. Traditional performance ratios, like revenue per employee or cost per unit, collapse a multidimensional reality into a single number. That simplification often hides more than it reveals. DEA, by contrast, evaluates each unit across multiple inputs and outputs simultaneously, constructing a picture of best practice that reflects the actual trade-offs organizations face. The result is not just a score, but a roadmap: a clear view of where inefficiency exists, how large it is, and what specific changes would close the gap.
This book is designed for professionals and students who have a working knowledge of mathematics and want to apply DEA in real organizational settings. You do not need a background in advanced optimization theory to benefit from this material. The explanations are clear and grounded in practical examples, and every major concept is connected to a concrete application. By the time you finish, you will be able to design a DEA study, run the analysis, interpret the results, and communicate findings to decision-makers in a way that drives real action.
Why Efficiency Measurement Matters
Efficiency is not just an abstract concept for economists. It has direct, tangible consequences for the people and organizations involved. A hospital that uses its resources inefficiently may deliver worse patient outcomes while spending more per bed than a comparable facility down the road. A school that underperforms relative to its peers may be failing students who deserve better, even while consuming the same budget. Measuring efficiency is the first step toward understanding why these gaps exist and what can be done about them.
The stakes are especially high in the public sector, where resources are finite and accountability is paramount. Governments and public agencies are under constant pressure to demonstrate value for money. In the United Kingdom, the National Health Service has used efficiency analysis to compare hospital trusts and identify where productivity improvements are possible.[2] In the United States, state education departments have used similar methods to evaluate school districts and allocate resources more equitably. These are not academic exercises. They are decisions that affect real services and real people.
In the private sector, efficiency measurement is equally critical. Consider a retail bank with 200 branches spread across a region. Some branches are highly profitable and serve customers well. Others consume similar resources but produce far weaker results. Without a systematic way to compare them, management may reward the wrong branches, invest in the wrong improvements, or miss the opportunity to replicate what the best performers are doing. Efficiency measurement turns that fog into clarity.
The competitive pressure to improve efficiency has also intensified in recent decades. Globalization, digital disruption, and tightening margins have made operational performance a strategic priority rather than a back-office concern. Organizations that measure efficiency rigorously and act on the findings gain a compounding advantage over time. Those that rely on intuition or simple metrics tend to fall behind, often without understanding why.
Efficiency measurement also matters because it creates accountability. When performance is measured transparently and consistently, it becomes harder to ignore underperformance or attribute it to factors outside anyone's control. A well-designed efficiency study separates the units that are genuinely constrained by their environment from those that are simply not using their resources well. That distinction is essential for fair and effective management.
Finally, efficiency measurement is a foundation for learning. When you identify which units are performing at best practice, you can study what they are doing differently. Those insights can then be transferred to underperforming units through targeted interventions, training, or process redesign. This is the logic behind benchmarking, and DEA makes it rigorous and systematic rather than anecdotal.
Limitations of Traditional Performance Metrics
Before exploring what DEA offers, it is worth understanding why traditional performance metrics fall short. The most common approach to measuring performance is the financial ratio: revenue per employee, cost per unit produced, return on assets, and so on. These ratios are easy to calculate, easy to communicate, and widely understood. But they carry serious limitations that become apparent as soon as the measurement problem gets even slightly complex.
The most fundamental problem with single ratios is that they only capture one dimension of performance at a time. A hospital might look efficient on cost per patient day but inefficient on patient outcomes per nurse. A school might score well on test results per teacher but poorly on results per dollar of funding. When you use a single ratio, you are implicitly deciding that one dimension is all that matters. In most real-world settings, that assumption is wrong.
Consider a simple example. Suppose you are comparing three bank branches using two metrics: cost per transaction and customer satisfaction score. Branch A has low costs but poor satisfaction. Branch B has high satisfaction but high costs. Branch C sits in the middle on both. Which branch is most efficient? A single ratio cannot answer that question. You need a method that evaluates both dimensions simultaneously and finds the branches that achieve the best combination of outcomes relative to their inputs.
The core problem with traditional metrics: They force a multidimensional reality into a single number, which means they always sacrifice information. The question is not whether that trade-off exists, but whether you are aware of it when you make decisions.
Another limitation of traditional metrics is that they typically require a benchmark to be meaningful. Saying that a branch processed 500 transactions per employee last month tells you very little unless you know what other branches achieved. Most organizations address this by comparing against an industry average or a historical baseline. But averages can be misleading. If the industry average is dragged down by many poor performers, beating the average is a low bar. DEA, by contrast, benchmarks each unit against the best performers in the dataset, which sets a much more demanding and informative standard.
Parametric statistical methods, such as regression analysis, offer a more sophisticated alternative to simple ratios. A regression model can estimate the relationship between inputs and outputs across a group of units and identify which ones perform above or below the predicted level. This is a genuine improvement over single ratios. However, regression-based approaches require you to specify a functional form for the relationship between inputs and outputs. You have to assume, for example, that the relationship is linear, or log-linear, or follows some other mathematical shape. If that assumption is wrong, the efficiency estimates will be biased.
DEA avoids this problem entirely. It is a non-parametric method, which means it does not require any assumptions about the functional form of the production relationship. Instead, it constructs the efficiency frontier directly from the data, using only the observed input-output combinations of the units being evaluated. This makes DEA far more flexible and robust in settings where the true production function is unknown, which is almost always the case in practice.
Traditional metrics also struggle with the problem of incommensurable units. How do you combine nurses, beds, and equipment into a single measure of hospital inputs? How do you aggregate test scores, graduation rates, and student satisfaction into a single measure of school outputs? Standard approaches either ignore some variables or apply arbitrary weights. DEA handles this elegantly by allowing the data to determine the most favorable set of weights for each unit, subject to constraints that ensure the comparison is fair.
None of this means that traditional metrics are useless. Ratios and regression models have their place, and they are often the right tool for simple, well-defined measurement problems. But when the performance question involves multiple inputs, multiple outputs, and a diverse set of organizational units operating under different conditions, traditional methods reach their limits quickly. That is precisely where DEA begins to shine.
What is Data Envelopment Analysis?
Data Envelopment Analysis is a method for measuring the relative efficiency of a set of comparable units, each of which uses multiple inputs to produce multiple outputs. The units being evaluated are called Decision Making Units, or DMUs. A DMU can be almost anything: a hospital, a school, a bank branch, a factory, a government agency, or even a country. The only requirement is that all DMUs in the analysis perform the same general function and can be described using the same set of inputs and outputs.
The core idea behind DEA is the concept of an efficiency frontier. Imagine plotting all your DMUs in a space defined by their input and output levels. Some units will be using their inputs more productively than others. The best performers form a boundary, called the frontier, that represents best practice. Units on the frontier are rated as fully efficient, with a score of 1.0 (or 100%). Units below the frontier are inefficient, and their efficiency score reflects how far they fall short of the best practice standard.
Here is a concrete example to make this tangible. Suppose you are evaluating five public libraries, each using a single input (staff hours per week) to produce a single output (books borrowed per week). The data might look like this:
- Library A: 100 staff hours, 500 books borrowed (ratio: 5.0)
- Library B: 150 staff hours, 600 books borrowed (ratio: 4.0)
- Library C: 200 staff hours, 1,000 books borrowed (ratio: 5.0)
- Library D: 250 staff hours, 900 books borrowed (ratio: 3.6)
- Library E: 300 staff hours, 1,200 books borrowed (ratio: 4.0)
Libraries A and C both achieve a ratio of 5.0 books per staff hour, which is the best in the group. They sit on the efficiency frontier and receive a score of 1.0. Library D, with a ratio of only 3.6, is the least efficient. DEA calculates its score by asking: given its level of inputs, how much output should it be producing if it performed like the best units? The answer defines both the efficiency score and the improvement target.
When multiple inputs and outputs are involved, the geometry becomes more complex, but the logic remains the same. DEA uses linear programming to construct the frontier and calculate efficiency scores for each DMU. For each unit, it solves an optimization problem that finds the most favorable set of weights for that unit's inputs and outputs, subject to the constraint that no unit in the dataset can achieve a score greater than 1.0 using those same weights. This is what makes DEA both flexible and rigorous.
There are two foundational DEA models that you will encounter throughout this book. The CCR model, named after Charnes, Cooper, and Rhodes, assumes constant returns to scale, meaning that doubling inputs should double outputs. The BCC model, named after Banker, Charnes, and Cooper, relaxes this assumption and allows for variable returns to scale, which is more realistic in many organizational settings.[3] Choosing between these models is one of the most important decisions in any DEA study, and later chapters will guide you through that choice carefully.
Beyond efficiency scores, DEA also produces slack variables and peer benchmarks. Slack variables identify specific inputs that are being over-used or outputs that are being under-produced, even after the radial efficiency improvement has been applied. Peer benchmarks identify which efficient DMUs a given inefficient unit should look to as role models. Together, these outputs transform DEA from a scoring exercise into a practical improvement tool.
It is also worth noting what DEA does not do. It does not explain why a unit is inefficient. It does not account for random variation or measurement error in the data. It does not tell you whether the inputs and outputs you have chosen are the right ones. These are limitations that require careful attention, and this book addresses each of them in detail. DEA is a powerful tool, but like any tool, it works best when used thoughtfully and with a clear understanding of its assumptions.
How to Use This Book
This book is structured to take you from foundational concepts to advanced applications in a logical, progressive sequence. Each chapter builds on the one before it, so reading in order is recommended if you are new to DEA. If you already have some background in the method, the chapter structure makes it easy to jump directly to the topics most relevant to your current work.
Here is a brief map of what each part of the book covers:
- Chapters 1 and 2 establish the conceptual and mathematical foundations. Chapter 1 defines efficiency in precise terms and introduces the inputs-outputs framework. Chapter 2 covers the linear programming mechanics that underpin all DEA models. If you are comfortable with optimization mathematics, you can move through these chapters quickly. If linear programming is new to you, take your time here, because the rest of the book depends on it.
- Chapters 3 and 4 cover the two core DEA models in depth. Chapter 3 focuses on the CCR model and its assumptions. Chapter 4 introduces the BCC model and explains when and why variable returns to scale matter. Both chapters include worked examples with real numbers so you can follow the calculations step by step.
- Chapter 5 goes beyond efficiency scores to explore slack variables and target setting. This is where DEA becomes most directly useful for operational improvement, and it is a chapter worth returning to when you are working on a real application.
- Chapters 6 and 7 address the practical challenges of data quality and result reliability. Chapter 6 covers data preparation, outlier detection, and normalization. Chapter 7 covers sensitivity analysis and cross-validation. These chapters are often underemphasized in textbooks, but they are critical for producing results that hold up to scrutiny.
- Chapter 8 presents detailed case studies from healthcare, banking, and education. These examples show how DEA is applied in practice, including the decisions made at each stage of the analysis and the insights that emerged from the results.
- Chapters 9 and 10 cover advanced topics, including super-efficiency models, dynamic DEA, fuzzy DEA, and integration with regression analysis and machine learning. These chapters are designed for readers who want to push beyond the basics and apply DEA in more complex or specialized settings.
- Chapter 11 provides a practical guide to software and implementation, covering dedicated DEA tools, spreadsheet-based approaches, and programming in R and Python.
Throughout the book, you will find worked examples, practical checklists, and specific guidance on common pitfalls. The goal is not just to explain how DEA works in theory, but to give you the tools to apply it correctly in practice. Every major concept is illustrated with a concrete example, and every chapter ends with clear takeaways that summarize the key points.
A note on the mathematics: DEA involves linear programming, matrix notation, and optimization concepts. The mathematical content in this book is presented at an intermediate level, consistent with a solid undergraduate background in quantitative methods. Equations are explained in plain language alongside the formal notation, so you can follow the logic even if your algebra is a little rusty. Where calculations become complex, step-by-step worked examples walk you through the process in detail.
If you are using this book as part of a course or training program, the chapter structure maps well onto a semester-length curriculum. Chapters 1 through 5 cover the core material that every DEA practitioner needs. Chapters 6 through 8 add the practical skills needed for real-world application. Chapters 9 through 11 provide depth for advanced study or specialized applications. The glossary at the back of the book provides quick reference definitions for all key terms introduced throughout the text.
One of the most important things to keep in mind as you work through this material is that DEA is a tool for generating insights, not a machine for producing answers. The quality of a DEA study depends heavily on the judgment of the analyst: the choice of DMUs, the selection of inputs and outputs, the handling of outliers, and the interpretation of results. This book will sharpen that judgment by giving you a deep understanding of what the method can and cannot do, and by showing you how experienced practitioners navigate the decisions that arise in real applications.
By the end of this book, you will have a complete, working knowledge of Data Envelopment Analysis. You will be able to design a study from scratch, execute the analysis using software or code, interpret the results with confidence, and communicate findings in a way that supports better organizational decisions. That is a genuinely valuable capability, and it is one that relatively few analysts possess. The chapters ahead will take you there, one step at a time.
Notes
Introduction
- 1. A. Charnes and others, "Measuring the efficiency of decision making units," European Journal of Operational Research, 1978
- 2. R. Jacobs and others, Measuring Efficiency in Health Care, Cambridge University Press, 2006
- 3. R. D. Banker and others, "Some models for estimating technical and scale inefficiencies in data envelopment analysis," Management Science, 1984
This is the end of the free sample. The full book has 11 chapters.
Want this book written for you?
Tell us your goals and background, and get your own version of this book, tailored by AI to you.


Benefits of AI-tailored books
- Read one book, not ten:
- all the Operations Research knowledge you need, gathered into a single book.
- Save days of learning:
- tell us your goals, choose your topics, and the whole book is built around them.
- Learn effortlessly:
- Operations Research book written for your specific background and expertise.
- Understand at a glance:
- includes charts, tables, timelines, checklists, decision trees, and more.
- Stay current:
- written the day you order it, not years ago.
- Trust what you read:
- every book is checked for accuracy, with real research when your subject needs it.
Create your unique book in 3 steps
- 1. Select your focus
Select the focus of your Operations Research book and share your background
- 2. Personalize your book
Specify your goals and choose sub-topics to include
- 3. Get your tailored book
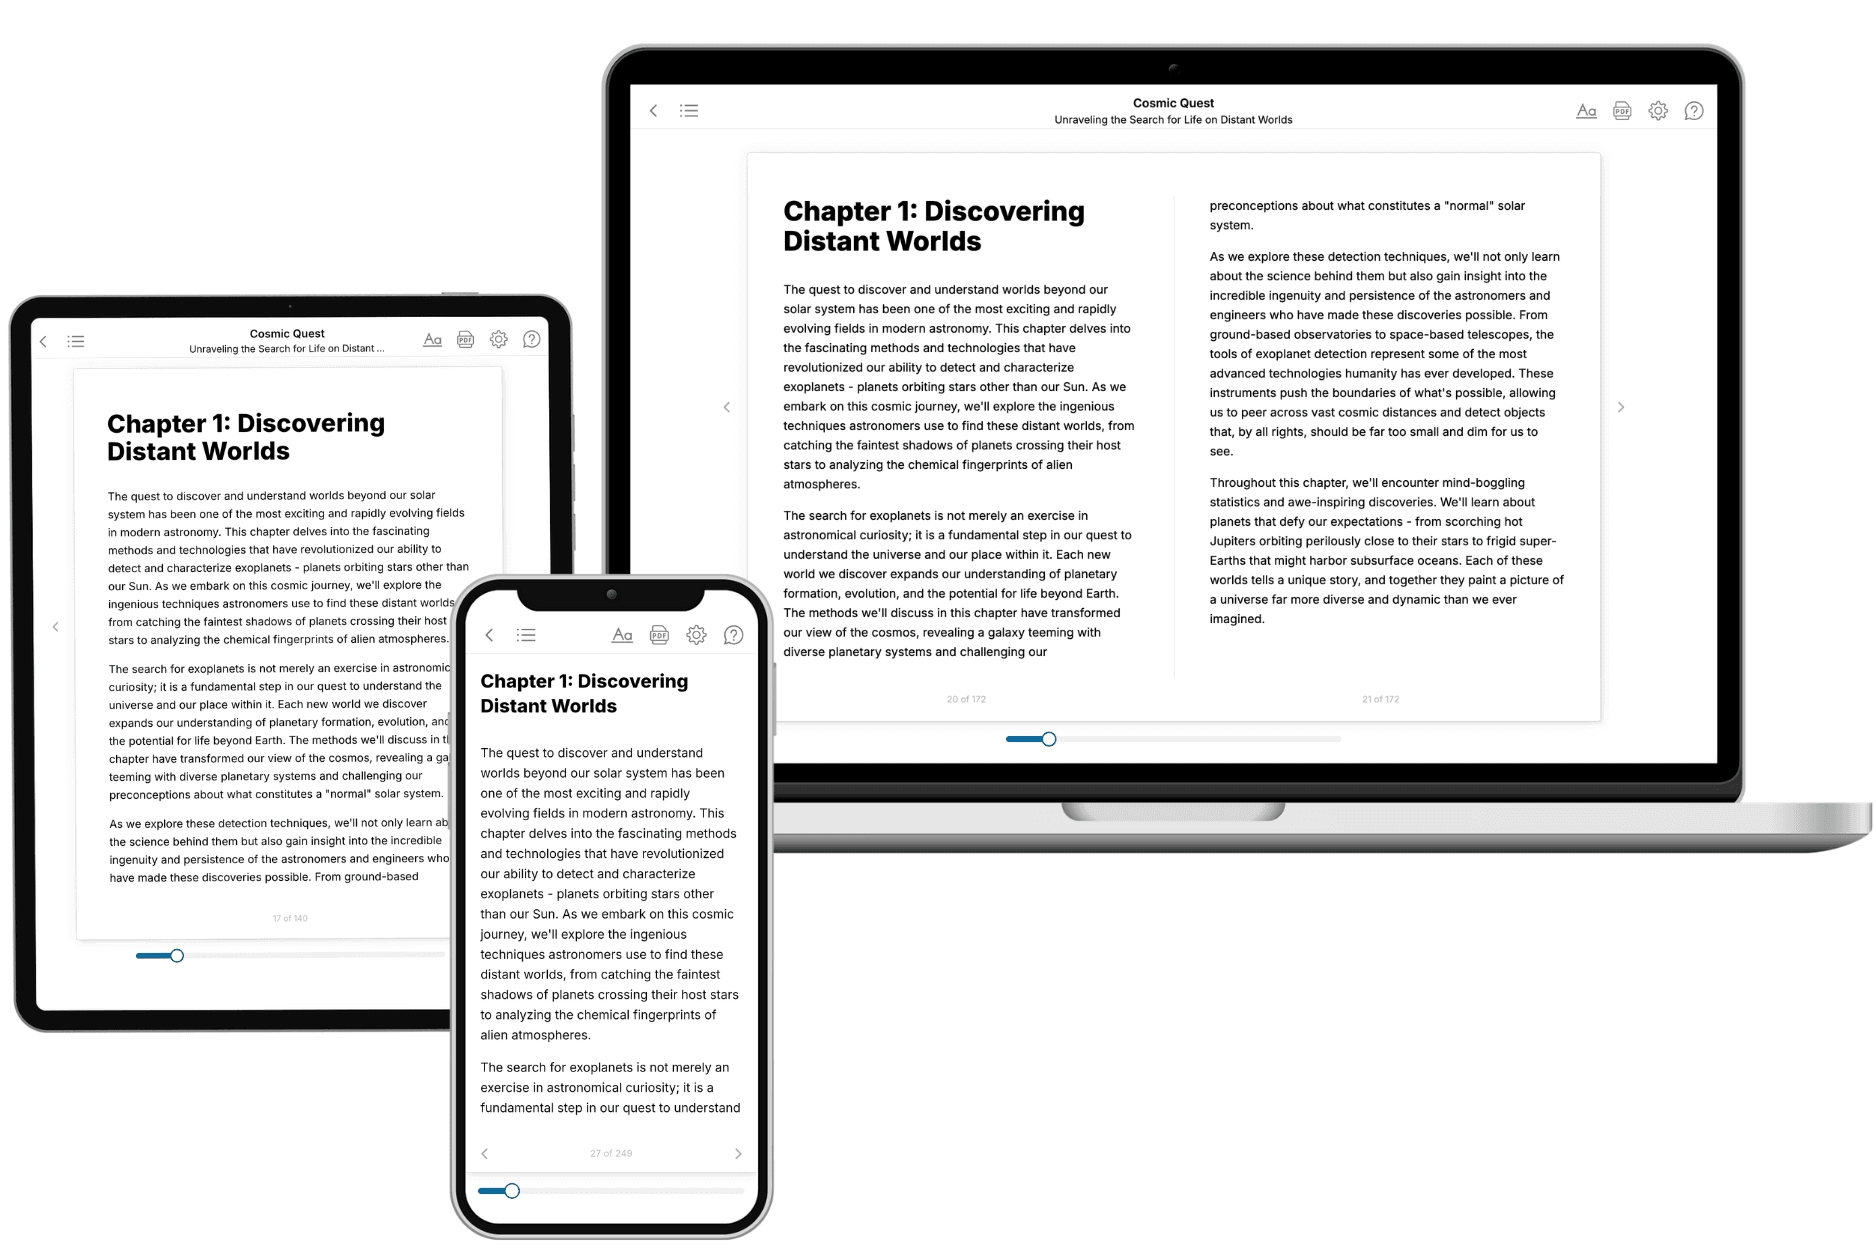
Your book is ready in 10 minutes. Read it online, download as EPUB or PDF, or send to Kindle.

Frequently asked questions
- What is TailoredRead?
TailoredRead creates complete, full-length nonfiction ebooks, written specifically for you. Tell us what you want to learn and why, and TailoredRead writes you a complete ebook on it, with charts, tables, and diagrams throughout. Read it online, on Kindle, or on any e-reader, or download it as a PDF or EPUB. Every book is written fresh the day you order it.
- How is the book tailored to me?
Before anything is written, you answer a few short questions about your goals, your background, and the topics you care about. Your book is then planned around your answers: written at your level, focused on your goals, and covering the topics you chose, instead of the one-size-fits-all book a store sells everyone.
- Will it read like generic AI content?
No. Your book isn't a chat transcript: it's planned chapter by chapter before a single word is written, told in a clear book voice, and explains ideas visually with charts, tables, and diagrams. After writing, every book goes through an editorial pass that polishes chapters so the book reads consistent from start to finish. Judge for yourself: browse thousands of sample books on our Explore Books page.
- How accurate is the content?
Our AI first checks whether your subject needs live research. Niche and fast-moving subjects are researched before writing, and the book plan and chapters are grounded in what it finds. After writing, every book goes through a quality pass that checks its facts and consistency, and researched books list their sources in a Notes section at the back.
- How long is the book?
You choose the length: Comprehensive (250-300 pages), Detailed (150-200 pages), Essential (70-100 pages), or Short (30-50 pages).
- Does the book include visuals?
Yes. Every book includes charts, tables, and diagrams: timelines, checklists, step-by-step guides, decision trees, comparison tables, matrices, and bar charts. A typical book includes dozens of these visual elements.
- Can I read it on Kindle? What formats can I download?
Yes. Every book can be read in our online reader or downloaded as a PDF or EPUB. The EPUB can be opened with Kindle, Apple Books, Kobo, and any e-reader. The Commercial and Author licenses also include an editable Word (DOCX) and Markdown download.
- How much does it cost?
About the price of a regular ebook. The exact price depends on your book's length and complexity, from $2 for the shortest books to $35 for the most comprehensive, and it's shown when you review your book, before you commit to anything. Each book is a one-time purchase, yours to keep, no subscription. Licenses that let you share, teach, or publish your book range from $35.99 to $49.99.
- Can I preview the book before purchasing?
Before you pay, you'll see what your book will cover: the title, a detailed description, the estimated length, and the complete chapter-by-chapter table of contents, so you know what you're getting before you decide. The full text itself is written after you purchase.
- How long does it take to create a book?
About 10 minutes. You can start reading the opening chapters while the rest is still being written.