Data Mining Essentials
Master the Mathematical Foundations and Practical Techniques to Extract Insights from Data
Elevate your data analysis capabilities by mastering the mathematical techniques that power modern data mining.
222 pages10 chaptersAug 28, 2026Data Mining
About this book
This comprehensive guide bridges the gap between theoretical mathematics and practical application, providing you with the knowledge to confidently extract actionable insights from complex datasets. You'll explore the mathematical foundations underlying popular algorithms, understand when and why to apply specific techniques, and learn how to evaluate your results rigorously. From data preparation through advanced pattern discovery, each chapter builds your expertise systematically. Whether you're working with business data, scientific datasets, or research information, you'll gain the skills to preprocess effectively, select appropriate methods, and interpret results with confidence. The combination of clear explanations, mathematical rigor, and practical guidance ensures you can immediately apply these techniques to your own projects and make data-driven decisions with greater accuracy.
Table of contents
- IntroductionWhat is Data Mining and Why It Matters, The Mathematical Foundation Behind Data Mining, How to Use This Book, Overview of Core TechniquesRead below
- Chapter 1: Fundamentals of Data and DatasetsTypes of Data: Numerical, Categorical, and Temporal, Understanding Data Structures and Formats, Assessing Data Quality and Completeness
- Chapter 2: Data Preprocessing and PreparationCleaning Data: Handling Missing Values and Outliers, Normalization and Scaling Techniques, Feature Engineering and Transformation, Sampling and Stratification Methods
- Chapter 3: Exploratory Data Analysis and VisualizationDescriptive Statistics and Summary Measures, Correlation and Association Analysis, Visualization Techniques for Pattern Discovery
- Chapter 4: Classification TechniquesClassification Fundamentals and Mathematical Principles, Decision Trees and Tree-Based Methods, Naive Bayes and Probabilistic Classifiers, Logistic Regression and Linear Classifiers
- Chapter 5: Regression and PredictionLinear Regression: Theory and Application, Polynomial and Non-Linear Regression, Evaluating Regression Models
- Chapter 6: Clustering and Unsupervised LearningClustering Fundamentals and Distance Metrics, K-Means and Partitioning Methods, Hierarchical Clustering Approaches, Density-Based Clustering Methods
- Chapter 7: Dimensionality ReductionThe Curse of Dimensionality, Principal Component Analysis and Linear Methods, Feature Selection and Importance Ranking
- Chapter 8: Model Evaluation and ValidationClassification Metrics: Accuracy, Precision, Recall, and F1, Cross-Validation and Holdout Methods, Understanding Overfitting and Underfitting, ROC Curves and Performance Comparison
- Chapter 9: Ensemble Methods and Advanced TechniquesEnsemble Learning Principles, Bagging and Boosting Methods, Random Forests and Gradient Boosting
- Chapter 10: Practical Applications and Case StudiesBusiness Intelligence and Customer Analytics, Scientific Research and Pattern Discovery, Building an End-to-End Data Mining Project
- ConclusionKey Takeaways and Next Steps, Continuing Your Data Mining Journey
- Glossary of Terms
- Further Reading and Resources
Introduction
A grocery chain notices that customers who buy diapers late on Friday evenings also tend to buy beer. No manager asked that question directly. The pattern surfaced because someone ran an algorithm across millions of transaction records looking for combinations that occurred together more often than chance would predict. That story, whether apocryphal or not, captures something real about how modern organizations operate. They do not rely on hunches or spot checks anymore. They mine their data, systematically and mathematically, to find relationships a human analyst would never spot by scrolling through spreadsheets.
This book exists to make that process understandable and usable. Retailers predict which customers will stop buying from them. Hospitals flag patients at risk of readmission. Banks score loan applications in milliseconds. Streaming platforms decide what to recommend next. Every one of these outcomes depends on techniques that trace back to statistics, linear algebra, and probability theory, applied through algorithms with names like Decision Tree, K-Means, and Random Forest. None of these names are mysterious once you see the math underneath them.
The chapters ahead move in a deliberate sequence. Early material builds a foundation in data types and preparation. Middle chapters cover the two big families of technique, supervised learning for labeled outcomes and unsupervised learning for hidden structure. Later chapters address dimensionality, validation, and ensemble methods, closing with full projects that stitch every piece together. Each concept is introduced with its mathematical basis first, then grounded in a concrete example, because formulas without context rarely stick.
This introduction sets the stage before the technical material begins. It explains what data mining actually means, why the mathematics behind it deserves attention rather than avoidance, how to get the most out of the chapters that follow, and what techniques are waiting further ahead. Treat it as a map, not a detour. Skipping it means walking into later chapters without knowing why the sequence was chosen or how the pieces connect.
What is Data Mining and Why It Matters
Data mining is the process of discovering patterns, relationships, and structures within large volumes of data that are not obvious through simple inspection. The term was popularized in the 1990s as databases grew beyond what a person could reasonably examine by hand, and the field formalized around a mix of statistics, machine learning, and database systems[1]. The distinction that matters most is between looking at data and mining it. Looking at data means checking a report or a dashboard for numbers you already expect to see. Mining data means letting algorithms search for relationships you did not know to look for in the first place.
Consider a telecom company with ten million customer records, each containing call frequency, contract length, complaint history, and payment behavior. No analyst can manually review ten million rows and spot which combination of features predicts a customer canceling their plan. But a classification algorithm can be trained on past cancellations, learn which patterns preceded them, and then flag current customers who match those patterns. This exact scenario is a canonical case for Churn Prediction, one that recurs throughout the later chapters of this book because it clearly illustrates supervised learning in action.
The value of data mining shows up in three broad categories:
- Prediction: estimating an unknown value, such as whether a loan applicant will default.
- Description: summarizing what is already happening, such as which products tend to sell together.
- Anomaly detection: spotting cases that deviate sharply from normal behavior, such as fraudulent transactions.
Each category maps to specific techniques covered later. Prediction relies heavily on Classification and Linear Regression. Description leans on clustering and correlation analysis. Anomaly detection often borrows from both, using distance-based methods to flag points that sit far from any cluster.
It helps to separate data mining from two terms it often gets confused with. Business intelligence typically means reporting on known metrics, like a monthly sales dashboard. Artificial intelligence is a broader field that includes reasoning, planning, and perception, of which data mining's machine learning techniques are one part. Data mining sits specifically at the point where you have historical data and want to extract a pattern, a prediction, or a grouping from it, using mathematically grounded methods rather than guesswork.
Why does this matter now more than it did decades ago? Storage costs have collapsed, sensors and software log nearly every interaction, and computing power lets algorithms train on millions of records in minutes rather than days. A hospital system can track vital signs from every patient every few seconds. A logistics company can log every package scan across a global network. None of that data becomes useful on its own. It becomes useful when someone applies a method capable of turning volume into insight, and that is precisely the skill this book builds.
The consequences of skipping data mining, or doing it poorly, are not abstract. A retailer that fails to predict seasonal demand overstocks warehouses and ties up capital in unsold inventory. An insurer that cannot detect fraudulent claims pays out money it should have flagged. A hospital that cannot identify high-risk patients misses opportunities for early intervention. These are not hypothetical risks. They are the daily stakes that make data mining a functional necessity rather than an academic exercise, and they are why every technique in this book is tied back to a real decision someone needs to make.
One common mistake beginners make is assuming more data automatically means better results. A dataset with a million rows but poor quality, riddled with missing values and inconsistent labels, will produce worse models than a clean dataset with a fraction of the size. This is why Data Quality and preprocessing occupy entire chapters before any modeling technique is introduced. The temptation to jump straight to building a Random Forest is understandable, but skipping preparation is the single most common reason real-world projects underperform.
Another misconception worth addressing directly: data mining is not about running an algorithm and trusting whatever comes out. Every technique makes assumptions. Linear Regression assumes a roughly linear relationship. K-Means assumes clusters are roughly spherical. Applying a method without understanding its assumptions is how analysts produce confident, polished, and wrong conclusions. That is precisely why this book insists on mathematical grounding rather than treating algorithms as black boxes to be called from a library.
By the end of this book, the goal is not simply recognizing algorithm names. It is being able to look at a business problem, a scientific dataset, or a research question and reason through which technique fits, why it fits, and how to check whether the results can be trusted. That reasoning ability is what separates someone who runs code from someone who genuinely mines data.
The Mathematical Foundation Behind Data Mining
Every data mining technique, however sophisticated it appears, reduces to a handful of mathematical ideas applied repeatedly in different combinations. Linear algebra provides the language for representing data as vectors and matrices, which is why a dataset with a thousand customers and twenty features is really just a thousand-by-twenty matrix waiting to be manipulated. Probability and statistics supply the tools for quantifying uncertainty, testing whether a pattern is meaningful or coincidental, and estimating how confident a prediction should be. Calculus, particularly the idea of a derivative, underlies how algorithms like Logistic Regression adjust their parameters to reduce error over successive iterations.
Take distance as a concrete example. Many techniques in this book, from clustering to nearest-neighbor style classification, depend on measuring how far apart two data points sit. The most common measure is Euclidean Distance, calculated as the square root of the sum of squared differences across each dimension:
distance = sqrt((x1 - y1)^2 + (x2 - y2)^2 + ... + (xn - yn)^2)This single formula underlies K-Means clustering, certain outlier detection methods, and even some similarity searches used in recommendation systems. Understanding it once means recognizing it instantly in every later chapter, rather than treating each algorithm as an unrelated black box.
Probability plays an equally central role, especially in classification. The Naive Bayes Classifier, covered in depth later, works by applying Bayes' theorem to estimate the probability of a label given a set of features, assuming those features are independent of each other[2]. A spam filter, for instance, estimates the probability an email is spam given the words it contains, updating that estimate as it observes each word. The independence assumption is technically false, since words in a sentence are not truly independent, yet the method works well in practice, which is a useful early lesson: mathematical assumptions do not need to be perfectly true to produce useful results.
Optimization is the third pillar, and it shows up whenever an algorithm needs to find the best possible fit to data. Linear Regression finds the line that minimizes the sum of squared errors between predicted and actual values, a method formalized by Gauss and Legendre in the early nineteenth century[3]. Logistic Regression uses a related idea but applies a Sigmoid Function to squeeze predictions into a range between zero and one, making it suitable for classification rather than continuous prediction. Both cases involve the same underlying question: given this data, what parameter values make the model's predictions as close to reality as possible?
It helps to think of these mathematical ideas as a toolbox rather than a wall to climb. A carpenter does not need a physics degree to understand that a lever multiplies force, only enough grasp of the principle to use it correctly. Similarly, this book does not demand a formal mathematics background beyond algebra and basic statistics. What it demands is willingness to sit with a formula long enough to see what each symbol represents, rather than skipping past equations to get to the code.
Concrete numbers make abstract formulas easier to trust. Suppose two customers are described by two features, monthly spend and number of visits. Customer A spends 200 dollars and visits 4 times a month. Customer B spends 180 dollars and visits 5 times. Their Euclidean Distance is sqrt((200-180)^2 + (4-5)^2) = sqrt(400 + 1) = 20.02. That single number becomes the basis for deciding whether these two customers belong in the same cluster, which is exactly the kind of calculation K-Means performs millions of times during training.
The mathematics also explains why certain techniques fail under certain conditions, which matters just as much as knowing when they succeed. Linear Regression breaks down when the relationship between variables is curved rather than straight, which is why Polynomial Regression exists as an extension. K-Means struggles when clusters have irregular shapes, which is why DBSCAN exists as an alternative built on density rather than distance to a center point. Every "why" question about an algorithm's limitation traces back to the mathematical assumption it depends on.
There is a practical payoff to this grounding beyond passing understanding. When a model produces a strange or unexpected result, the person who understands the underlying math can diagnose the problem. Someone who only knows how to call a function from a software library is left guessing, or worse, trusting a flawed output because the code ran without an error message. Mathematical literacy is what separates debugging a model from simply hoping it works.
None of this requires memorizing derivations. It requires building an intuition for what each formula is doing and why. That intuition is built gradually across this book, one technique at a time, always returning to the same core ideas of distance, probability, and optimization so that later chapters feel like variations on a familiar theme rather than an ever-expanding list of unrelated tricks.
How to Use This Book
This book is structured to be read in order, at least for a first pass, because later chapters assume familiarity with concepts introduced earlier. The fundamentals of data types and quality in the opening chapter feed directly into the preprocessing techniques of the next, which in turn make the exploratory analysis chapter meaningful, since summary statistics and visualizations only tell a true story when the underlying data has been cleaned properly. Jumping straight to Random Forests without understanding Decision Trees, or attempting Principal Component Analysis without grasping variance, will leave gaps that show up later as confusion rather than saving time now.
That said, the book is also organized to function as a reference after the first read. Each chapter is self-contained enough that returning to the section on Cross-Validation, for example, does not require rereading everything before it. A practical approach is to read straight through once to build the overall map, then return to individual subchapters when a specific project calls for a specific technique. Treat the table of contents as a lookup tool for that second pass, the way a mechanic keeps a manual open to the relevant page rather than rereading the whole book each time.
Every subchapter follows a consistent internal pattern worth recognizing early:
- The mathematical principle behind the technique, explained with formulas.
- A worked example using concrete numbers or a realistic scenario.
- Guidance on when the technique applies and when it does not.
- Common pitfalls and how to avoid them.
Recognizing this pattern makes each section easier to digest, since the sequence rarely changes even when the topic does.
Active reading produces far better retention than passive reading, especially with mathematical material. Whenever a formula appears, try plugging in small numbers by hand before moving on, the way the Euclidean Distance example was worked through in the previous subchapter. When a worked example uses a dataset of customers or transactions, imagine substituting a dataset from personal experience, whether that is a spreadsheet from work, a hobby project, or publicly available data. This substitution habit turns abstract formulas into something that feels applicable rather than theoretical.
A basic comfort with a programming environment capable of handling data, such as Python with common data science libraries, will make the practical exercises far more useful, though this book focuses on the mathematics and logic rather than syntax. The formulas and worked examples are language-agnostic by design, so the concepts transfer regardless of which tool eventually gets used to implement them. Anyone who prefers a different environment, such as R, will find the underlying reasoning identical.
Pay close attention to the sections addressing pitfalls and limitations, since these are often skipped by readers eager to reach the "how to build it" material. Knowing that Logistic Regression assumes a roughly linear relationship between features and the log-odds of the outcome, or that K-Means requires specifying the number of clusters in advance, prevents frustrating dead ends later. These caveats are not footnotes to the main lesson. They are frequently the most valuable part of each subchapter, because they explain why a technique that works beautifully on one dataset fails completely on another.
The glossary near the end of the book is worth bookmarking early rather than discovering late. Terms like Overfitting, Bias-Variance Tradeoff, and Information Gain recur across multiple chapters, and a quick glossary check is faster than searching back through earlier sections for a definition. Building the habit of checking there whenever a term feels unfamiliar keeps momentum going without forcing a full backtrack through prior chapters.
Finally, treat the case studies and end-to-end project material near the close of the book as the real test of everything learned earlier. Reading about Decision Trees is different from applying one to messy, real data full of missing values and irrelevant features. The final chapters intentionally combine preprocessing, model selection, and evaluation into single projects, mirroring what an actual data mining task looks like outside of a textbook. Treat those chapters not as a formality to skim, but as the moment the separate pieces finally click together into a coherent skill.
Progress through this material at whatever pace allows genuine understanding rather than rushing toward a final page count. A reader who spends real time with the Naive Bayes Classifier before moving to Logistic Regression will find the transition intuitive, since both techniques estimate probabilities but through different mathematical routes. A reader who skims both will find them indistinguishable and confusing later on. This is a subject where the depth of understanding at each step compounds into confidence at the end.
Overview of Core Techniques
Data mining techniques fall into two broad families, and understanding this split early makes every later chapter easier to place mentally. Supervised learning works with labeled data, meaning each historical example comes with a known outcome, such as a customer who did or did not churn, or a house that sold for a specific price. The algorithm learns the relationship between features and outcome from these labeled examples, then applies that relationship to new, unlabeled cases. Unsupervised learning works without labels at all, searching instead for structure, such as natural groupings or reduced representations of the data, based purely on patterns in the features themselves.
Within supervised learning, two further categories matter. Classification predicts a discrete category, such as spam or not spam, approved or denied, churned or retained. Regression predicts a continuous number, such as a house price, a temperature, or a customer's expected lifetime spend. The chapter on Classification Techniques covers Decision Trees, Naive Bayes Classifiers, and Logistic Regression, three approaches that reach similar goals through very different mathematical routes: splitting rules based on Gini Impurity and Information Gain, probability estimation via Bayes' theorem, and a Sigmoid Function applied to a weighted sum of features, respectively.
The Regression and Prediction chapter builds on similar logic but for continuous outcomes. Linear Regression establishes the baseline approach, minimizing squared error to fit a straight line or hyperplane through the data. Polynomial Regression extends this to curved relationships when a straight line clearly underfits the pattern, such as modeling how crop yield changes with fertilizer amount, where too little or too much both reduce output. Evaluating these models relies on metrics like Mean Squared Error, Mean Absolute Error, and R-Squared, each offering a different lens on how well predictions match reality, covered in detail when that chapter's evaluation subchapter arrives.
Unsupervised learning gets its own extended treatment across the clustering and dimensionality reduction chapters. Clustering algorithms like K-Means group similar observations together using distance metrics, useful for tasks like segmenting customers into groups with similar purchasing habits without knowing those groups in advance. The Elbow Method helps decide how many clusters actually make sense for a given dataset, avoiding the trap of forcing data into an arbitrary number of groups. Hierarchical clustering builds a Dendrogram showing how observations merge together at different levels of similarity, while DBSCAN takes a density-based approach better suited to clusters with irregular shapes than K-Means can handle.
Dimensionality reduction addresses a different but related challenge: what happens when a dataset has too many features, some redundant, some irrelevant, some simply adding noise. The Curse of Dimensionality describes how distance-based methods start behaving strangely as feature counts grow, since points spread out and start looking equally distant from each other in high-dimensional space[4]. Principal Component Analysis addresses this by finding new combined features that capture the most Explained Variance in the data using far fewer dimensions than the original set, while Feature Selection takes a more direct route by identifying and keeping only the most informative original features.
No technique matters without a rigorous way to check whether it actually works, which is the entire subject of the Model Evaluation and Validation chapter. A Confusion Matrix breaks down classification results into correct and incorrect predictions across categories, feeding into metrics like precision, recall, and F1 Score that each highlight a different kind of error. Cross-Validation, particularly the practice of splitting data into multiple folds for repeated training and testing, guards against the trap of a model that performs well only on the specific data it was trained on. Recognizing the Bias-Variance Tradeoff, and diagnosing whether a model suffers from Overfitting or Underfitting, becomes second nature after working through this chapter's worked examples.
Ensemble methods, covered toward the end of the book, take a step beyond single algorithms by combining many models into one stronger prediction. Bagging trains multiple versions of a model on different random samples of the data and averages their results, the principle behind Random Forest, which combines many Decision Trees to reduce the instability any single tree might have. Boosting instead trains models sequentially, each one focusing on correcting the mistakes of the one before it, the principle behind Gradient Boosting, a technique responsible for many winning solutions in data mining competitions over the past decade[5].
All of this converges in the final practical chapter, which walks through Business Intelligence and Customer Analytics scenarios alongside scientific applications, then builds a full End-to-End Pipeline from raw data through to a validated model. That pipeline structure, sourcing data, cleaning it, exploring it, choosing and training a technique, evaluating it, and refining based on results, is the shape every real project takes regardless of industry. Recognizing that shape early makes each individual chapter feel like a piece of a larger puzzle rather than an isolated topic.
What ties every one of these techniques together, from a simple Histogram in the exploratory chapter to a full Gradient Boosting ensemble near the end, is that each one answers a specific kind of question using a specific mathematical mechanism. Learning to match the question being asked to the technique built to answer it is the practical skill this book is built around, and it starts with something as basic as knowing whether a dataset's outcome variable is a category or a number. Everything else follows from that first distinction.
Notes
Introduction
- 1. Usama Fayyad and others, "From Data Mining to Knowledge Discovery in Databases," AI Magazine, 1996
- 2. Thomas Bayes, "An Essay towards Solving a Problem in the Doctrine of Chances," Philosophical Transactions of the Royal Society, 1763
- 3. Carl Friedrich Gauss, "Theoria Motus Corporum Coelestium," Perthes und Besser, 1809
- 4. Richard Bellman, Dynamic Programming, Princeton University Press, 1957
- 5. Jerome Friedman, "Greedy Function Approximation: A Gradient Boosting Machine," Annals of Statistics, 2001
This is the end of the free sample. The full book has 10 chapters.
Want this book written for you?
Tell us your goals and background, and get your own version of this book, tailored by AI to you.


Benefits of AI-tailored books
- Read one book, not ten:
- all the Data Mining knowledge you need, gathered into a single book.
- Save days of learning:
- tell us your goals, choose your topics, and the whole book is built around them.
- Learn effortlessly:
- Data Mining book written for your specific background and expertise.
- Understand at a glance:
- includes charts, tables, timelines, checklists, decision trees, and more.
- Stay current:
- written the day you order it, not years ago.
- Trust what you read:
- every book is checked for accuracy, with real research when your subject needs it.
Create your unique book in 3 steps
- 1. Select your focus
Select the focus of your Data Mining book and share your background
- 2. Personalize your book
Specify your goals and choose sub-topics to include
- 3. Get your tailored book
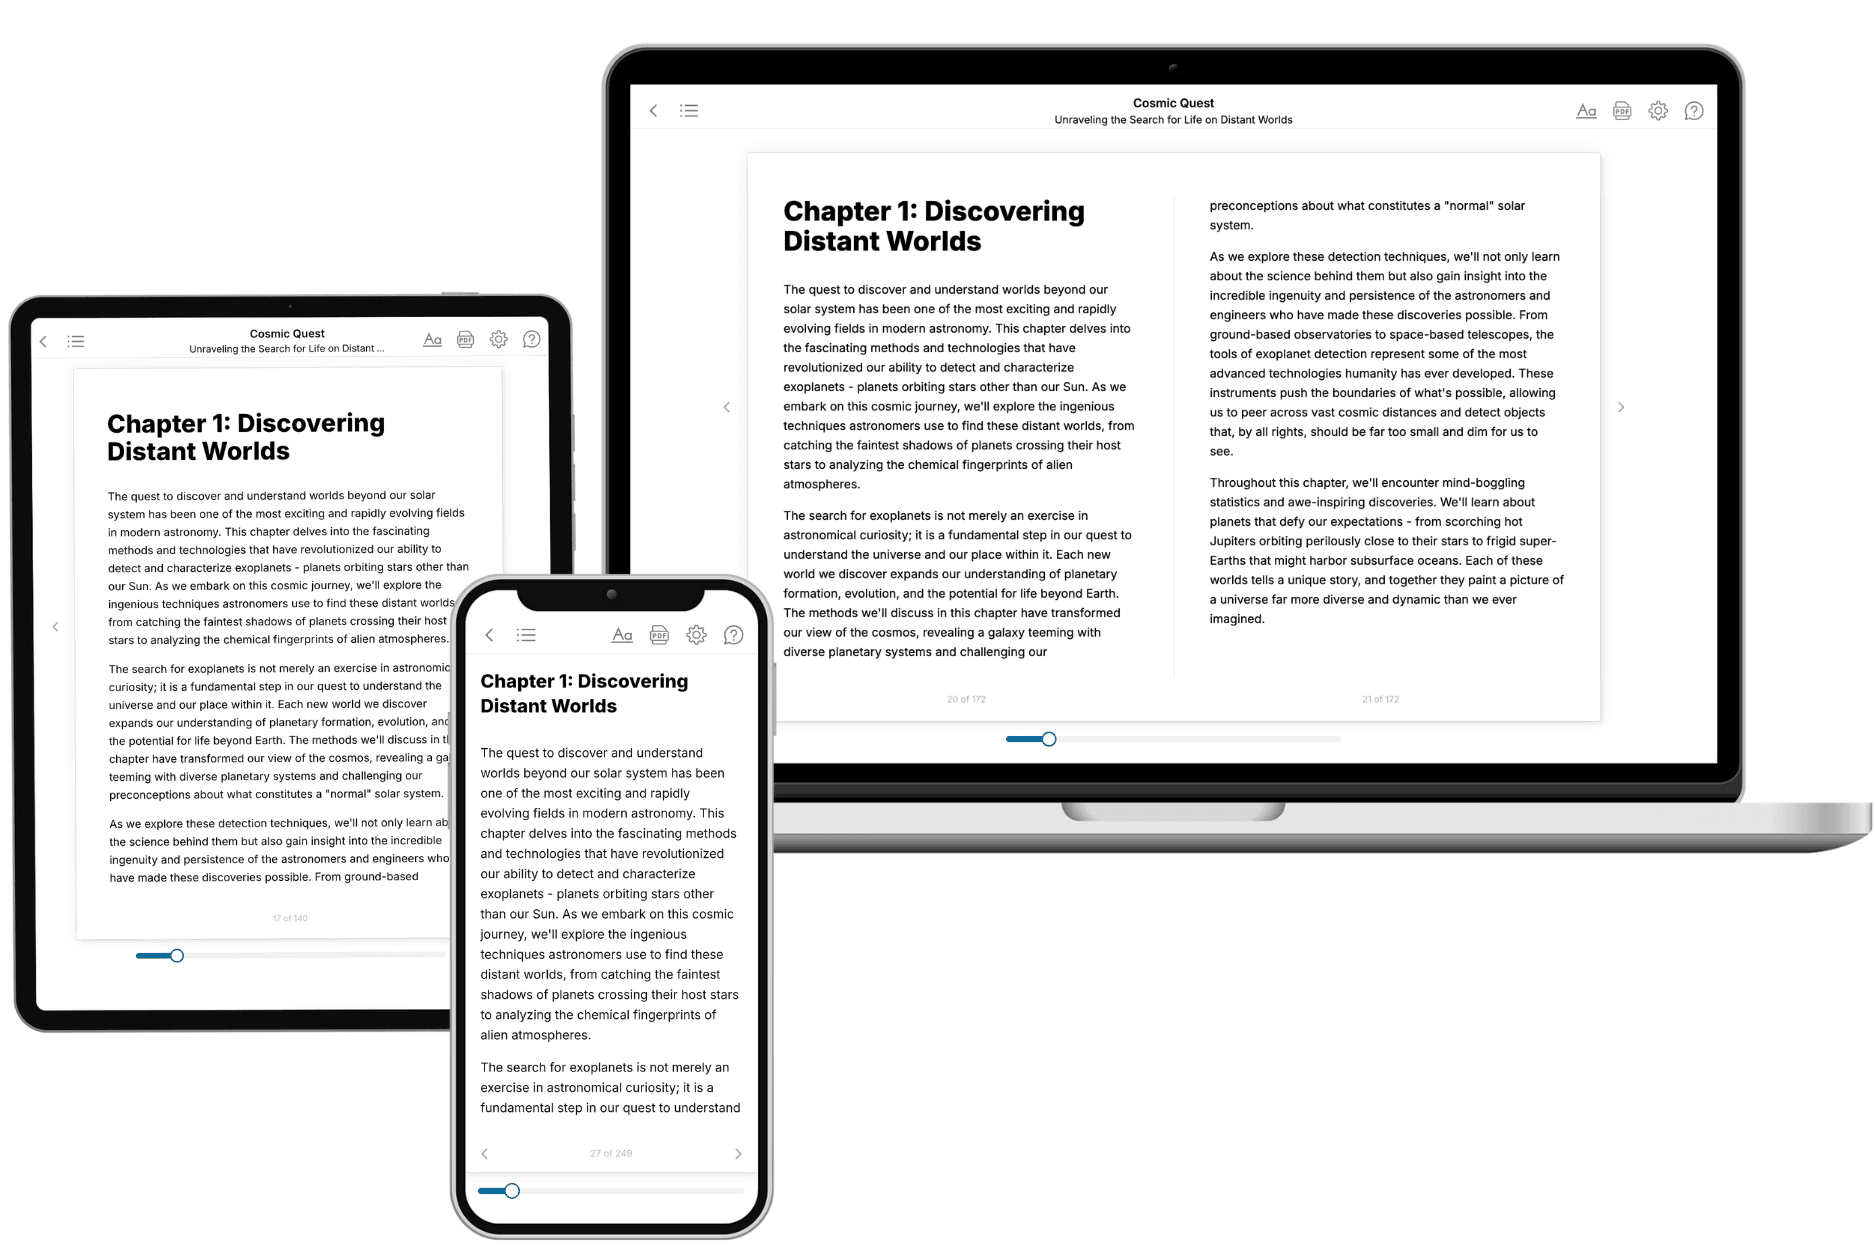
Your book is ready in 10 minutes. Read it online, download as EPUB or PDF, or send to Kindle.

Frequently asked questions
- What is TailoredRead?
TailoredRead creates complete, full-length nonfiction ebooks, written specifically for you. Tell us what you want to learn and why, and TailoredRead writes you a complete ebook on it, with charts, tables, and diagrams throughout. Read it online, on Kindle, or on any e-reader, or download it as a PDF or EPUB. Every book is written fresh the day you order it.
- How is the book tailored to me?
Before anything is written, you answer a few short questions about your goals, your background, and the topics you care about. Your book is then planned around your answers: written at your level, focused on your goals, and covering the topics you chose, instead of the one-size-fits-all book a store sells everyone.
- Will it read like generic AI content?
No. Your book isn't a chat transcript: it's planned chapter by chapter before a single word is written, told in a clear book voice, and explains ideas visually with charts, tables, and diagrams. After writing, every book goes through an editorial pass that polishes chapters so the book reads consistent from start to finish. Judge for yourself: browse thousands of sample books on our Explore Books page.
- How accurate is the content?
Our AI first checks whether your subject needs live research. Niche and fast-moving subjects are researched before writing, and the book plan and chapters are grounded in what it finds. After writing, every book goes through a quality pass that checks its facts and consistency, and researched books list their sources in a Notes section at the back.
- How long is the book?
You choose the length: Comprehensive (250-300 pages), Detailed (150-200 pages), Essential (70-100 pages), or Short (30-50 pages).
- Does the book include visuals?
Yes. Every book includes charts, tables, and diagrams: timelines, checklists, step-by-step guides, decision trees, comparison tables, matrices, and bar charts. A typical book includes dozens of these visual elements.
- Can I read it on Kindle? What formats can I download?
Yes. Every book can be read in our online reader or downloaded as a PDF or EPUB. The EPUB can be opened with Kindle, Apple Books, Kobo, and any e-reader. The Commercial and Author licenses also include an editable Word (DOCX) and Markdown download.
- How much does it cost?
About the price of a regular ebook. The exact price depends on your book's length and complexity, from $2 for the shortest books to $35 for the most comprehensive, and it's shown when you review your book, before you commit to anything. Each book is a one-time purchase, yours to keep, no subscription. Licenses that let you share, teach, or publish your book range from $35.99 to $49.99.
- Can I preview the book before purchasing?
Before you pay, you'll see what your book will cover: the title, a detailed description, the estimated length, and the complete chapter-by-chapter table of contents, so you know what you're getting before you decide. The full text itself is written after you purchase.
- How long does it take to create a book?
About 10 minutes. You can start reading the opening chapters while the rest is still being written.