Data Science with R: From Code to Insights
Master R Programming, Data Wrangling, and Predictive Analytics for Cybersecurity and Beyond
Master the complete data science workflow in R and transform raw data into actionable insights.
114 pages5 chaptersMar 14, 2026R Programming Language
About this book
You'll progress from R fundamentals through advanced techniques like machine learning and network analysis, with every concept grounded in practical, hands-on exercises using real datasets. This book bridges the gap between learning syntax and building production-ready analyses. You'll import data from multiple sources, clean and transform it using tidyverse tools, create compelling visualizations, and develop predictive models using caret. Special emphasis on cybersecurity applications shows how these techniques uncover threats and patterns in security data. Each chapter includes reproducible R Markdown examples and exercises designed for undergraduate learners. Whether you're analyzing network traffic, building threat detection models, or exploring complex datasets, you'll gain the skills to work independently and communicate results effectively to technical and non-technical audiences alike.
Table of contents
- IntroductionWhy R Matters for Data Science and Cybersecurity, How This Book Is Organized, Setting Up Your R EnvironmentRead below
- Chapter 1: R Programming FundamentalsR Syntax, Data Types, and Core Concepts, Functions, Packages, and Reproducible Code, Debugging and Best Practices
- Chapter 2: Data Import and TransformationImporting Data from CSV, Excel, Databases, and APIs, Data Wrangling with Tidyverse: dplyr and tidyr, Querying Databases with SQL and R
- Chapter 3: Exploratory Data Analysis and VisualizationExploratory Data Analysis: Uncovering Patterns and Anomalies, Creating Compelling Visualizations with ggplot2, Statistical Summaries and Descriptive Statistics
- Chapter 4: Predictive Modeling and Machine LearningFeature Engineering and Data Preparation, Building Models with Caret: Training, Tuning, and Evaluation, Clustering Algorithms and Network Analysis
- Chapter 5: Reproducible Research and CommunicationR Markdown: Integrating Code, Narrative, and Results, Case Study: Analyzing Cybersecurity Threat Data
- Conclusion and Next Steps
Introduction
Data is everywhere, and the ability to make sense of it has become one of the most valuable skills in technology today. Whether you are analyzing network traffic logs for suspicious behavior, building a model to predict system vulnerabilities, or simply trying to understand patterns in a large dataset, the tools and techniques of data science give you a structured way to find answers. This book is your guide to developing those skills using R, a programming language built from the ground up for statistical computing and data analysis.
R has been a cornerstone of academic research and professional data science for decades. It is not just a programming language; it is an entire ecosystem designed around the idea that working with data should be intuitive, reproducible, and powerful. From loading a raw CSV file to training a machine learning model and publishing a polished report, R handles the full workflow. The tidyverse collection of packages, in particular, has transformed how analysts write R code, making complex data transformations readable and maintainable in ways that other languages struggle to match.
This book is written specifically for undergraduate computer science and cybersecurity students who already have some programming experience. You know what a loop is. You have written functions before. You understand the basics of how data structures work. What you may not yet have is a clear path from that general programming knowledge to the specific, practical skills that data science demands. That is exactly the gap this book is designed to close. Every chapter builds on the last, and every concept is grounded in hands-on examples you can run, modify, and learn from directly.
Cybersecurity is a thread that runs throughout this entire book. Security professionals deal with some of the most complex and high-stakes data problems in the industry. Intrusion detection, malware classification, anomaly detection in network logs, and threat intelligence analysis all require the same core data science skills covered here. By connecting R techniques to real security scenarios, this book ensures that what you learn is not just academically interesting but immediately applicable to the kind of work you are likely to encounter in your career.
Why R Matters for Data Science and Cybersecurity
When students first encounter R, a common question comes up: why not just use Python? It is a fair question. Python is widely used, has excellent data science libraries, and is already familiar to many computer science students. The honest answer is that both languages have real strengths, and many working data scientists use both. However, R offers specific advantages that make it particularly well-suited for statistical analysis, data visualization, and reproducible research, which are exactly the skills this book focuses on.
R was designed by statisticians, for statisticians. That origin shapes everything about how the language works. Statistical operations that require significant setup in other languages are often built directly into R's core. Concepts like data frames, factor variables, and vectorized operations are native to R in a way that feels natural once you understand them. When you are working with datasets that have complex structures, missing values, or require careful statistical treatment, R's design philosophy pays off quickly.[1]
The tidyverse ecosystem is one of R's most compelling advantages. Developed largely by Hadley Wickham and a community of contributors, the tidyverse is a collection of packages that share a consistent design philosophy and grammar. Tools like dplyr for data manipulation, tidyr for reshaping data, and ggplot2 for visualization all work together seamlessly. Code written with tidyverse tools tends to be readable even by people who are not deeply familiar with R, which matters enormously when you are collaborating on a team or revisiting your own work months later.
For cybersecurity specifically, R offers capabilities that align well with the kinds of problems security analysts face. Consider the following common security data tasks:
- Analyzing large volumes of network log data to identify unusual traffic patterns
- Building classification models to distinguish malicious from benign files
- Visualizing attack timelines and geographic distributions of threat sources
- Clustering IP addresses or user behaviors to find hidden groups
- Generating reproducible reports that document findings for incident response teams
The job market reinforces R's relevance. According to the 2023 Stack Overflow Developer Survey, R ranks among the top languages used by data scientists and analysts globally.[2] In cybersecurity roles specifically, data science skills are increasingly listed as requirements rather than nice-to-haves. Security operations centers are generating more data than human analysts can manually review, and organizations are turning to machine learning and statistical analysis to help close that gap. Knowing R positions you to contribute to that work from day one.
Beyond job market considerations, R teaches you to think about data in a rigorous, structured way. The habits you build here, such as checking data quality before analysis, documenting your assumptions, validating your models, and communicating uncertainty honestly, are habits that make you a better analyst regardless of which tools you use later. R is the vehicle; the destination is a way of thinking about data that will serve you throughout your career.
It is also worth noting that R has a vibrant, welcoming community. The R community, including groups like R-Ladies and the broader RStudio (now Posit) ecosystem, has invested heavily in making the language accessible to newcomers. There are thousands of free tutorials, active forums, and open-source packages covering nearly every domain imaginable. When you get stuck, and you will get stuck, help is genuinely easy to find.
How This Book Is Organized
This book follows the natural arc of a real data science project. Rather than organizing chapters around abstract language features, the structure mirrors the workflow you will actually use when working with data. You start with the foundations, build toward analysis and modeling, and finish with communication and reproducibility. Each chapter introduces new tools and concepts while reinforcing and extending what came before.
Chapter 1: R Programming Fundamentals covers the core building blocks of the language. You will learn R's syntax, data types, and control structures, then move into writing your own functions and working with packages. The chapter closes with debugging strategies and coding best practices that will save you significant frustration as your projects grow in complexity. If you have programmed before, some of this will feel familiar, but R has enough quirks that even experienced programmers benefit from a focused introduction.
Chapter 2: Data Import and Transformation addresses one of the most time-consuming parts of real data science work. You will learn to import data from CSV files, Excel spreadsheets, relational databases, and APIs. Then you will dive deep into the tidyverse tools for cleaning and reshaping data, including dplyr and tidyr. A dedicated section on SQL integration shows you how to query databases directly from R, which is essential when datasets are too large to load entirely into memory.
Chapter 3: Exploratory Data Analysis and Visualization is where data starts to tell its story. Exploratory data analysis (EDA) is the process of systematically examining a dataset before building any models, and it is arguably the most important skill in this book. You will learn to compute descriptive statistics, identify outliers and missing values, and spot patterns that guide your later analysis. The chapter's centerpiece is a thorough introduction to ggplot2, R's premier visualization library, which uses a layered grammar of graphics to build charts that are both beautiful and informative.
Chapter 4: Predictive Modeling and Machine Learning introduces the caret package, which provides a unified interface for training and evaluating machine learning models in R. You will work through feature engineering, model training, hyperparameter tuning, and performance evaluation. The chapter also covers clustering algorithms and network analysis, two techniques that are particularly valuable in cybersecurity for finding hidden structure in complex datasets.
Chapter 5: Reproducible Research and Communication ties everything together. R Markdown is a tool that lets you combine code, narrative text, and visualizations in a single document that can be rendered as a report, a web page, or a presentation. You will learn to write R Markdown documents that others can run and verify. The chapter concludes with a full case study analyzing real cybersecurity threat data, walking through the complete workflow from raw data to a polished, reproducible report.
Each chapter is designed to be worked through sequentially, but the book is also structured so that later chapters can serve as references once you have the fundamentals. If you are already comfortable with R basics, you can move quickly through Chapter 1 and spend more time on the data transformation and modeling chapters. The cybersecurity examples appear throughout, not just in the final case study, so the practical context is present from the very beginning.
Throughout the book, you will find several recurring features designed to reinforce learning:
- Code examples: Every concept is illustrated with runnable R code that you can copy, modify, and experiment with
- Practical exercises: Each chapter ends with exercises that challenge you to apply what you have learned to new problems
- Cybersecurity connections: Callouts throughout the text connect general data science techniques to specific security applications
- Common mistakes: Sections that highlight the errors beginners most frequently make, so you can avoid them
The datasets used throughout the book are either publicly available or synthetically generated to resemble real-world data. Where possible, cybersecurity datasets from sources like the CICIDS dataset collection and the KDD Cup 1999 dataset are used to ground the examples in realistic scenarios.[3] All code in the book is written for R version 4.0 and above, and package versions are noted where compatibility matters.
Setting Up Your R Environment
Before you can write a single line of R code, you need to set up your working environment. The good news is that the R ecosystem has excellent free tools, and the setup process is straightforward on Windows, macOS, and Linux. This section walks you through everything you need to get a fully functional R development environment running on your machine.
The first step is installing R itself. R is maintained by the Comprehensive R Archive Network (CRAN), and the latest version is always available at cran.r-project.org. Download the installer for your operating system and follow the standard installation steps. As of this writing, R 4.3 is the current stable release. It is worth keeping R reasonably up to date, as packages sometimes require recent versions, though you do not need to update every time a new minor version is released.
Once R is installed, the next step is installing RStudio. While you can write R code in any text editor or even in the terminal, RStudio is the integrated development environment (IDE) that the vast majority of R users work in, and for good reason. RStudio provides a four-panel layout that shows your code editor, console, environment, and file browser all at once. It has built-in support for R Markdown, package management, version control with Git, and debugging tools. RStudio Desktop is free and available at posit.co/download/rstudio-desktop.
A note on Posit Cloud: If you are working on a machine where you cannot install software, or if you want a consistent environment that works from any browser, Posit Cloud (formerly RStudio Cloud) offers a free tier that runs a full RStudio environment in your web browser. It is an excellent option for classroom settings or when you are working on multiple machines.
After installing R and RStudio, the next task is installing the core packages used throughout this book. Open RStudio, click on the Console panel at the bottom left, and run the following installation commands. This will take a few minutes the first time, as each package and its dependencies are downloaded and compiled.
# Install the tidyverse (includes dplyr, ggplot2, tidyr, readr, and more)
install.packages("tidyverse")

# Install caret for machine learning
install.packages("caret")

# Install additional packages used in later chapters
install.packages(c("readxl", "DBI", "RSQLite", "igraph", "rmarkdown", "knitr"))
Once the installations complete, verify that everything loaded correctly by running a quick test. In the console, type library(tidyverse) and press Enter. You should see a message listing the packages that were loaded, along with any conflicts. If you see an error instead, the most common cause is a failed installation due to a missing system dependency. The error message will usually tell you what is missing, and a quick search for that error message plus your operating system will almost always find a solution.
Understanding the RStudio interface will save you time from the start. The four main panels are:
- Source editor (top left): Where you write and save R scripts and R Markdown documents
- Console (bottom left): Where R code is executed and output is displayed interactively
- Environment/History (top right): Shows all variables and objects currently in memory, plus a history of commands you have run
- Files/Plots/Packages/Help (bottom right): A multi-tab panel for browsing files, viewing plots, managing packages, and reading documentation
One of the most important habits to build from the very beginning is using R Projects. An R Project is a self-contained working directory that keeps all your scripts, data files, and outputs organized together. When you open a project, RStudio automatically sets the working directory to that folder, which means file paths in your code will work consistently regardless of where the project is stored on your machine. To create a new project, go to File > New Project and follow the prompts. Create one project now called data-science-r and use it for all the exercises in this book.
Version control is another practice worth setting up early. Git integration in RStudio allows you to track changes to your code, revert to earlier versions, and collaborate with others. If you do not already have Git installed, download it from git-scm.com. Once installed, you can initialize a Git repository for your project through Tools > Version Control > Project Setup in RStudio. You do not need to be a Git expert to benefit from it; even just committing your work at the end of each session gives you a safety net that will eventually save you from a painful mistake.
Finally, take a moment to configure a few RStudio settings that will make your experience smoother. Go to Tools > Global Options and make the following adjustments:
- Under General, uncheck "Restore .RData into workspace at startup" and set "Save workspace to .RData on exit" to Never. This ensures you always start with a clean environment, which prevents hard-to-diagnose bugs caused by leftover objects from previous sessions.
- Under Code > Display, enable "Show margin" and set the margin column to 80. This helps you keep your code lines at a readable length.
- Under Appearance, choose a theme that is comfortable for long coding sessions. Many developers prefer a dark theme to reduce eye strain.
With your environment set up and configured, you are ready to start writing R code. The investment you make in setting things up properly now, using projects, version control, and clean workspace settings, will pay dividends throughout the book and beyond. Good tooling habits are part of what separates analysts who produce reliable, reproducible work from those who are constantly fighting their own setup. Everything from this point forward assumes you have R, RStudio, and the core packages installed and working. If you run into any issues during setup, the RStudio community forums at community.rstudio.com are an excellent resource staffed by knowledgeable and helpful contributors.
Notes
Introduction
- 1. R. Ihaka and R. Gentleman, "R: A Language for Data Analysis and Graphics," Journal of Computational and Graphical Statistics, 1996
- 2. Stack Overflow, "Developer Survey Results 2023," 2023
- 3. I. Sharafaldin and others, Toward Generating a New Intrusion Detection Dataset and Intrusion Traffic Characterization, ICISSP 2018, 2018
This is the end of the free sample. The full book has 5 chapters.
Want this book written for you?
Tell us your goals and background, and get your own version of this book, tailored by AI to you.


Benefits of AI-tailored books
- Read one book, not ten:
- all the R Programming Language knowledge you need, gathered into a single book.
- Save days of learning:
- tell us your goals, choose your topics, and the whole book is built around them.
- Learn effortlessly:
- R Programming Language book written for your specific background and expertise.
- Understand at a glance:
- includes charts, tables, timelines, checklists, decision trees, and more.
- Stay current:
- written the day you order it, not years ago.
- Trust what you read:
- every book is checked for accuracy, with real research when your subject needs it.
Create your unique book in 3 steps
- 1. Select your focus
Select the focus of your R Programming Language book and share your background
- 2. Personalize your book
Specify your goals and choose sub-topics to include
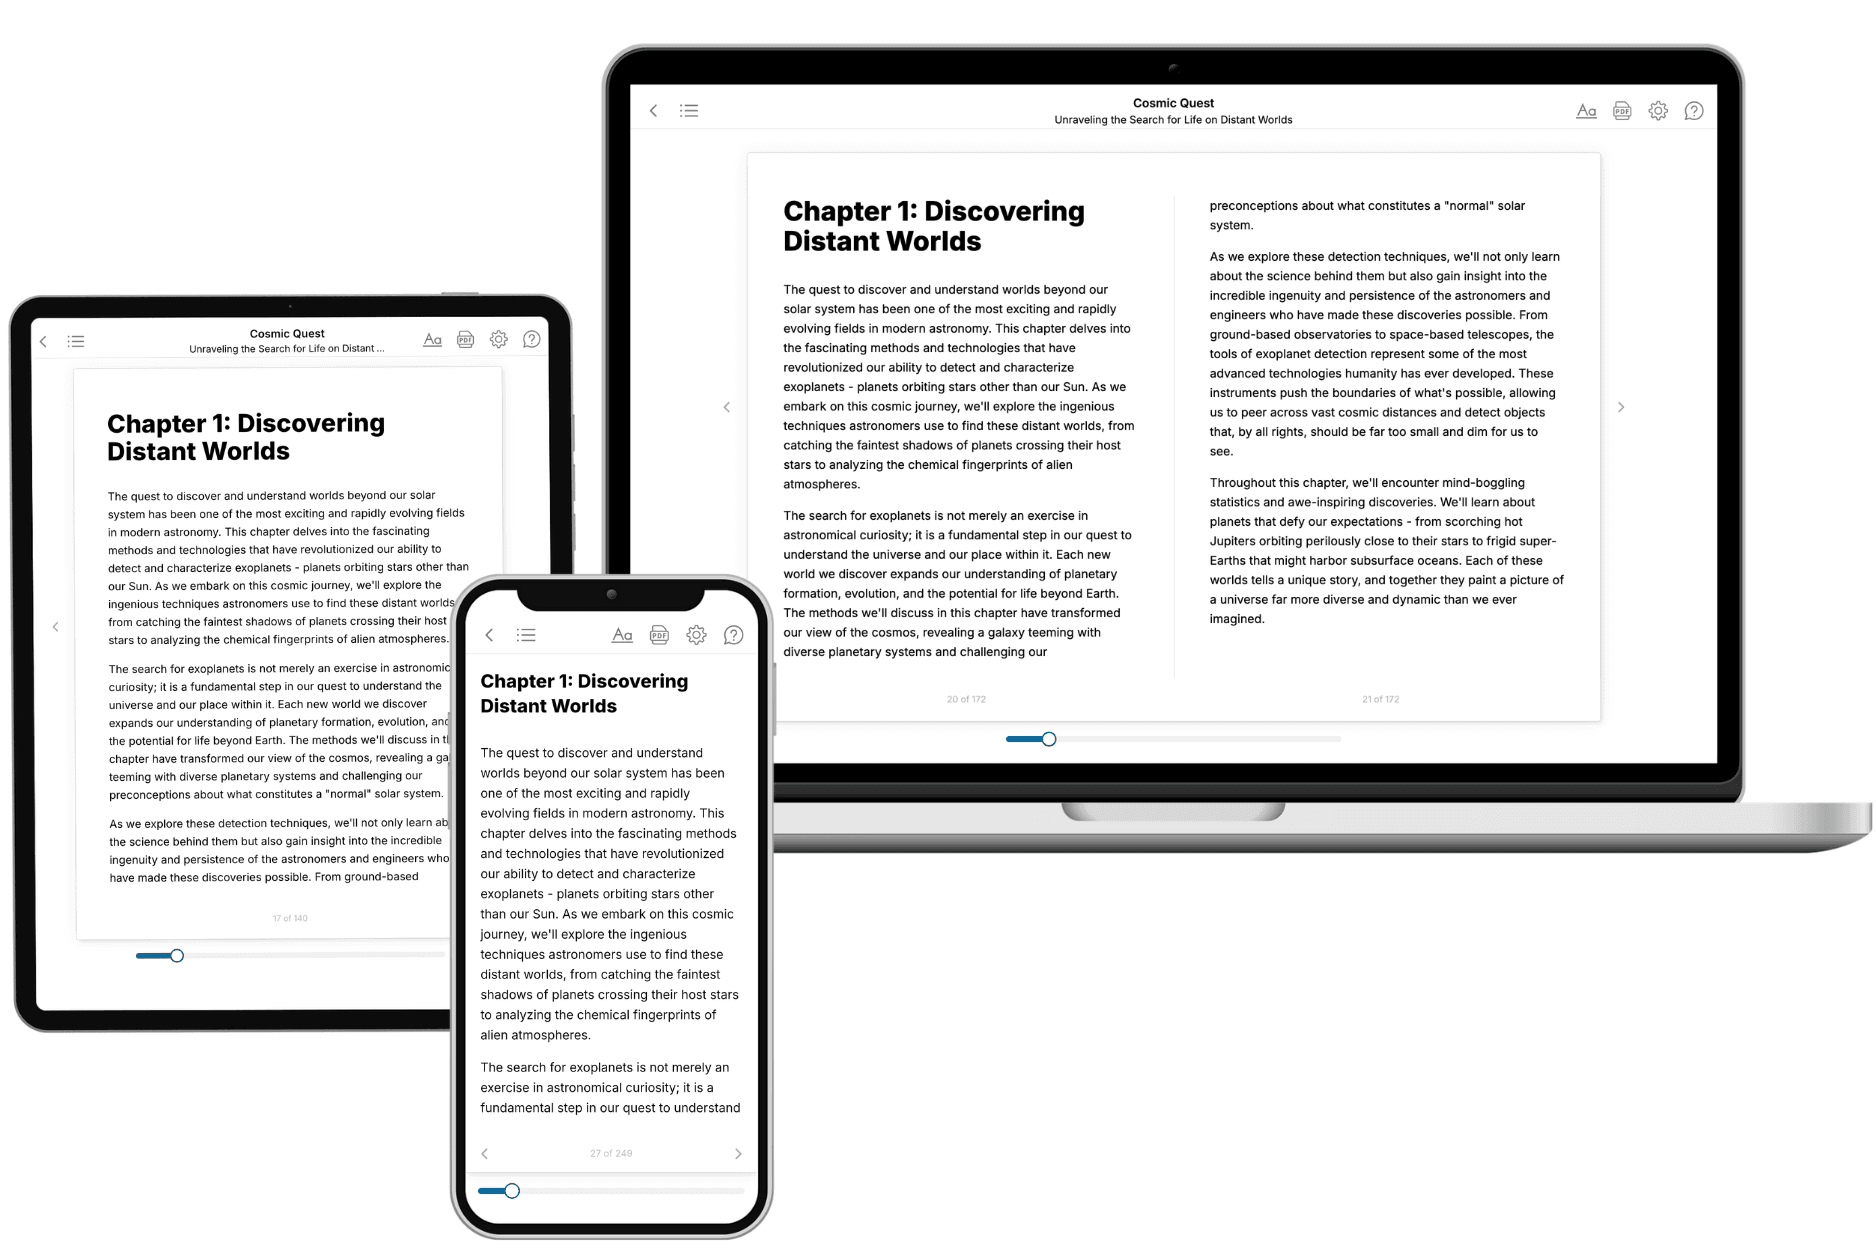
- 3. Get your tailored book
Your book is ready in 10 minutes. Read it online, download as EPUB or PDF, or send to Kindle.
Frequently asked questions
- What is TailoredRead?
TailoredRead creates complete, full-length nonfiction ebooks, written specifically for you. Tell us what you want to learn and why, and TailoredRead writes you a complete ebook on it, with charts, tables, and diagrams throughout. Read it online, on Kindle, or on any e-reader, or download it as a PDF or EPUB. Every book is written fresh the day you order it.
- How is the book tailored to me?
Before anything is written, you answer a few short questions about your goals, your background, and the topics you care about. Your book is then planned around your answers: written at your level, focused on your goals, and covering the topics you chose, instead of the one-size-fits-all book a store sells everyone.
- Will it read like generic AI content?
No. Your book isn't a chat transcript: it's planned chapter by chapter before a single word is written, told in a clear book voice, and explains ideas visually with charts, tables, and diagrams. After writing, every book goes through an editorial pass that polishes chapters so the book reads consistent from start to finish. Judge for yourself: browse thousands of sample books on our Explore Books page.
- How accurate is the content?
Our AI first checks whether your subject needs live research. Niche and fast-moving subjects are researched before writing, and the book plan and chapters are grounded in what it finds. After writing, every book goes through a quality pass that checks its facts and consistency, and researched books list their sources in a Notes section at the back.
- How long is the book?
You choose the length: Comprehensive (250-300 pages), Detailed (150-200 pages), Essential (70-100 pages), or Short (30-50 pages).
- Does the book include visuals?
Yes. Every book includes charts, tables, and diagrams: timelines, checklists, step-by-step guides, decision trees, comparison tables, matrices, and bar charts. A typical book includes dozens of these visual elements.
- Can I read it on Kindle? What formats can I download?
Yes. Every book can be read in our online reader or downloaded as a PDF or EPUB. The EPUB can be opened with Kindle, Apple Books, Kobo, and any e-reader. The Commercial and Author licenses also include an editable Word (DOCX) and Markdown download.
- How much does it cost?
About the price of a regular ebook. The exact price depends on your book's length and complexity, from $2 for the shortest books to $35 for the most comprehensive, and it's shown when you review your book, before you commit to anything. Each book is a one-time purchase, yours to keep, no subscription. Licenses that let you share, teach, or publish your book range from $35.99 to $49.99.
- Can I preview the book before purchasing?
Before you pay, you'll see what your book will cover: the title, a detailed description, the estimated length, and the complete chapter-by-chapter table of contents, so you know what you're getting before you decide. The full text itself is written after you purchase.
- How long does it take to create a book?
About 10 minutes. You can start reading the opening chapters while the rest is still being written.