Decoding Relationships
Mastering Covariance and Correlation in Computer Science and Algorithms
Are you struggling to grasp the true power of covariance and correlation in your data analysis and algorithm design?
300 pages15 chaptersMar 9, 2025Data Science
About this book
This book delves deep into the heart of statistical relationships, unraveling the mysteries of covariance and correlation for computer scientists and data enthusiasts alike. You'll discover how these fundamental concepts shape the way we understand and manipulate data, from basic probability theory to advanced machine learning algorithms. Through clear explanations, practical examples, and hands-on exercises, you'll gain the skills to apply these powerful tools in your own projects. Whether you're optimizing recommendation systems, refining predictive models, or exploring the intricacies of multivariate analysis, this book will equip you with the knowledge to take your understanding of data relationships to the next level. Get ready to see patterns and connections in your data like never before, and unlock new possibilities in your computational work.
Table of contents
- IntroductionThe Importance of Understanding Relationships in Data, Overview of Covariance and Correlation, How This Book Is Structured, Prerequisites and Assumed KnowledgeRead below
- Chapter 1: Foundations of Probability and StatisticsRandom Variables and Probability Distributions, Expected Value and Variance, Joint Probability Distributions, Conditional Probability and Independence
- Chapter 2: Understanding CovarianceDefinition and Interpretation of Covariance, Properties of Covariance, Calculating Covariance from Data, The Covariance Matrix
- Chapter 3: Diving into CorrelationDefinition and Interpretation of Correlation, Properties of Correlation Coefficients, Pearson Correlation Coefficient, Calculating Correlation from Data
- Chapter 4: Types of CorrelationSpearman's Rank Correlation, Kendall's Tau Correlation, Point-Biserial Correlation, Partial Correlation
- Chapter 5: Statistical Inference for CorrelationHypothesis Testing for Correlation, Confidence Intervals for Correlation Coefficients, Effect of Sample Size on Correlation Estimates, Multiple Testing and False Discovery Rate
- Chapter 6: Visualizing Covariance and CorrelationScatter Plots and Correlation, Heat Maps for Correlation Matrices, Pair Plots for Multivariate Data, Interactive Visualizations for Exploring Relationships
- Chapter 7: Multivariate Analysis TechniquesPrincipal Component Analysis (PCA), Factor Analysis, Canonical Correlation Analysis, Multivariate Analysis of Variance (MANOVA)
- Chapter 8: Time Series AnalysisAutocorrelation and Partial Autocorrelation, Cross-Correlation for Time Series, Cointegration in Time Series, Granger Causality
- Chapter 9: Applications in Machine LearningFeature Selection Using Correlation, Regularization and Correlation in Regression Models, Correlation-Based Distance Measures in Clustering, Anomaly Detection Using Correlation Analysis
- Chapter 10: Signal Processing and Image AnalysisSignal Correlation and Convolution, Image Registration Using Correlation, Template Matching in Computer Vision, Spectral Analysis and Correlation
- Chapter 11: Natural Language Processing ApplicationsWord Embeddings and Semantic Similarity, Document Similarity Measures, Topic Modeling and Correlation, Sentiment Analysis and Opinion Mining
- Chapter 12: Network Analysis and Graph TheoryNode Similarity in Graphs, Community Detection Using Correlation, Link Prediction in Social Networks, Graph Embeddings and Node2Vec
- Chapter 13: Covariance and Correlation in Big DataDistributed Computing for Correlation Analysis, Correlation in Streaming Data, Dimensionality Reduction for High-Dimensional Data, Scalable Algorithms for Correlation Computation
- Chapter 14: Common Pitfalls and MisconceptionsCorrelation vs. Causation, Dealing with Nonlinear Relationships, The Influence of Outliers on Correlation, Simpson's Paradox and Aggregation Effects, Common Errors in Interpreting Correlation Results
- Chapter 15: Future Directions and Advanced TopicsQuantum Computing and Correlation Analysis, AI-Driven Correlation Discovery, Advances in Causal Inference, Correlation in Complex Systems and Networks
- ConclusionKey Takeaways, Suggestions for Further Learning
- Glossary
- Further Reading
Introduction
In the vast landscape of computer science and data analysis, few concepts are as fundamental and far-reaching as covariance and correlation. These statistical measures form the bedrock of understanding relationships between variables, guiding everything from basic data exploration to sophisticated machine learning algorithms. As you embark on this journey to master these concepts, you're taking a crucial step towards becoming a more insightful and effective data scientist or computer scientist.
The ability to decipher relationships within data is not just a technical skill; it's a gateway to unlocking deeper insights and making more informed decisions. Whether you're developing recommendation systems, optimizing algorithms, or conducting cutting-edge research, a solid grasp of covariance and correlation will prove invaluable. This book aims to equip you with a comprehensive understanding of these concepts, their mathematical foundations, and their wide-ranging applications in computer science and beyond.
As we delve into the world of statistical relationships, you'll discover that covariance and correlation are more than just formulas to memorize. They are powerful tools that allow you to quantify and visualize how variables interact, revealing patterns that might otherwise remain hidden. From the simplest scatter plot to complex multivariate analyses, these concepts will be your guide in navigating the intricate web of data relationships.
Throughout this book, we'll bridge the gap between theory and practice, ensuring that you not only understand the mathematical underpinnings but also know how to apply these concepts in real-world scenarios. You'll learn to interpret results critically, avoiding common pitfalls and misconceptions that can lead to erroneous conclusions. By the end of this journey, you'll have developed a nuanced understanding of how to leverage covariance and correlation in your work, enhancing your ability to design efficient algorithms, build robust models, and extract meaningful insights from data.
The Importance of Understanding Relationships in Data
In the digital age, data has become the lifeblood of innovation and decision-making across industries. However, raw data alone is often insufficient to drive meaningful progress. The true power of data lies in our ability to uncover and interpret the relationships within it. Understanding these relationships is crucial for several reasons, each of which underscores the importance of mastering concepts like covariance and correlation.
Firstly, relationships in data form the foundation of predictive modeling. By identifying how variables interact and influence each other, you can build models that not only describe current patterns but also forecast future trends. This predictive capability is at the heart of many cutting-edge applications in computer science, from weather forecasting algorithms to stock market prediction models. The ability to anticipate future outcomes based on current data relationships is a powerful tool that can drive strategic decision-making and resource allocation.
Secondly, understanding relationships in data is essential for feature selection and dimensionality reduction in machine learning. In many real-world datasets, you'll encounter a multitude of variables, not all of which are equally relevant to your analysis or model. By examining the relationships between these variables, you can identify which features are most informative and which may be redundant. This process of feature selection, often guided by correlation analysis, helps in building more efficient and interpretable models. It also addresses the curse of dimensionality, a common challenge in machine learning where the performance of algorithms degrades as the number of features increases relative to the number of samples.
Thirdly, relationships in data play a crucial role in anomaly detection and quality control. In many systems, normal behavior is characterized by consistent relationships between variables. Deviations from these expected relationships can signal anomalies or errors that require attention. For instance, in network security, unusual correlations between traffic patterns might indicate a cyber attack. In manufacturing, unexpected changes in the relationship between production inputs and outputs could reveal equipment malfunctions. By continuously monitoring these relationships, you can develop robust systems for detecting and responding to anomalies in real-time.
Furthermore, understanding data relationships is key to scientific discovery and hypothesis generation. In fields ranging from bioinformatics to astrophysics, correlations in data often provide the first hints of underlying causal mechanisms. While correlation does not imply causation, it often points researchers in promising directions for further investigation. By systematically analyzing relationships in large datasets, scientists can uncover patterns that suggest new hypotheses or challenge existing theories, driving the frontiers of knowledge forward.
In the realm of algorithm design, awareness of data relationships can lead to significant optimizations. Many algorithms, particularly in areas like data compression, signal processing, and machine learning, leverage the inherent structure and relationships in data to achieve better performance. For example, compression algorithms exploit correlations between data points to reduce redundancy and achieve higher compression ratios. Similarly, in machine learning, understanding the covariance structure of input features can inform the design of more efficient neural network architectures or kernel functions for support vector machines.
Lastly, the ability to interpret and communicate relationships in data is crucial for data-driven decision making. In many professional contexts, you'll need to present your findings to stakeholders who may not have a technical background. Being able to clearly explain how different variables relate to each other, and what those relationships mean in practical terms, is an invaluable skill. It bridges the gap between technical analysis and actionable insights, enabling more informed and confident decision-making across all levels of an organization.
As you progress through this book, keep in mind that each concept and technique you learn is another tool in your arsenal for uncovering and leveraging these critical data relationships. From basic correlation coefficients to advanced multivariate analyses, each method offers a unique perspective on how variables interact. By mastering these tools, you'll be well-equipped to extract maximum value from the data you encounter, whether you're working on academic research, industry projects, or personal endeavors.
The importance of understanding relationships in data cannot be overstated. It's a fundamental skill that underpins much of modern data science and computer science. As you embark on this journey to master covariance and correlation, you're not just learning statistical techniques; you're developing a mindset that will allow you to see patterns, generate insights, and solve complex problems across a wide range of domains. Embrace this opportunity to enhance your analytical capabilities and open up new possibilities in your work with data.
Overview of Covariance and Correlation
Covariance and correlation are fundamental concepts in statistics that provide powerful tools for understanding and quantifying relationships between variables. While they are closely related, each offers a unique perspective on how variables interact. This overview will introduce you to these concepts, highlighting their similarities, differences, and the crucial roles they play in data analysis and algorithm design.
Covariance is a measure of the joint variability between two variables. In essence, it indicates the extent to which changes in one variable are associated with changes in another. A positive covariance suggests that the variables tend to move in the same direction: as one increases, the other tends to increase as well. Conversely, a negative covariance indicates that the variables tend to move in opposite directions. The magnitude of covariance provides information about the strength of the relationship, but it's important to note that this magnitude is not standardized and depends on the scales of the variables involved.
Mathematically, the covariance between two variables X and Y is defined as the expected value of the product of their deviations from their respective means:
Cov(X,Y) = E[(X - μX)(Y - μY)]
Where E denotes the expected value, and μX and μY are the means of X and Y respectively. This formula encapsulates the essence of covariance: it measures how much the variables vary together.
Correlation, on the other hand, is a standardized measure of the relationship between two variables. It builds upon the concept of covariance but addresses the scale dependency issue by normalizing the measure to a standard range. The most commonly used correlation measure is the Pearson correlation coefficient, which ranges from -1 to +1. A correlation of +1 indicates a perfect positive linear relationship, -1 indicates a perfect negative linear relationship, and 0 indicates no linear relationship.
The Pearson correlation coefficient (ρ) is defined as the covariance of the two variables divided by the product of their standard deviations:
ρ(X,Y) = Cov(X,Y) / (σX * σY)
Where σX and σY are the standard deviations of X and Y respectively. This normalization makes correlation a dimensionless quantity, allowing for direct comparisons between different pairs of variables, regardless of their scales.
The relationship between covariance and correlation highlights a key difference in their applications. Covariance is often used in situations where the scale and units of the variables are important, such as in financial portfolio theory where the actual magnitudes of price movements matter. Correlation, being scale-independent, is more commonly used when comparing the strength of relationships across different pairs of variables or in different datasets.
Both covariance and correlation play crucial roles in various areas of computer science and data analysis. In machine learning, they are fundamental to many algorithms. For instance, Principal Component Analysis (PCA), a widely used dimensionality reduction technique, relies on the covariance matrix of the data to identify the directions of maximum variance. In feature selection, correlation analysis helps identify redundant or highly related features, potentially simplifying models and improving their interpretability.
In the realm of algorithm design, understanding covariance and correlation can lead to significant optimizations. Many algorithms in signal processing, image analysis, and pattern recognition leverage these concepts. For example, matched filtering in signal processing uses correlation to detect known signals in noisy environments. In computer vision, template matching algorithms often employ correlation measures to identify objects or patterns in images.
It's important to note that while covariance and correlation are powerful tools, they have limitations. Both measures primarily capture linear relationships between variables. In cases where relationships are non-linear, these measures may fail to detect significant patterns. Additionally, they are sensitive to outliers, which can sometimes lead to misleading results if not properly addressed.
As you delve deeper into this book, you'll explore these concepts in greater detail, learning not just how to calculate covariance and correlation, but also how to interpret them in various contexts, how to visualize them effectively, and how to apply them in complex analytical tasks. You'll also encounter more advanced topics, such as partial correlation, which allows for controlling the effect of other variables, and non-parametric correlation measures that can capture non-linear relationships.
Understanding covariance and correlation is not just about mastering formulas; it's about developing an intuition for relationships in data. As you progress, you'll find that these concepts provide a foundation for more advanced statistical and machine learning techniques. They offer a way to quantify and communicate patterns that might otherwise remain hidden in complex datasets.
By the end of this book, you'll have a comprehensive understanding of how to leverage covariance and correlation in your work. Whether you're developing algorithms, conducting data analysis, or building machine learning models, these concepts will be invaluable tools in your analytical toolkit. They will enhance your ability to extract insights from data, design efficient algorithms, and make informed decisions based on statistical evidence.
How This Book Is Structured
This book is designed to provide you with a comprehensive and practical understanding of covariance and correlation, tailored specifically for computer science and data science applications. The structure of the book follows a logical progression, starting from foundational concepts and building towards advanced applications and cutting-edge topics. This approach ensures that you develop a solid grasp of the fundamentals before tackling more complex ideas and implementations.
We begin with the "Foundations of Probability and Statistics" in Chapter 1. This chapter serves as a refresher on key statistical concepts that underpin covariance and correlation. It covers topics such as random variables, probability distributions, expected values, and joint distributions. Even if you're familiar with these concepts, this chapter will help ensure that everyone starts on the same footing and introduces the notation and terminology used throughout the book.
Chapters 2 and 3 form the core of the book, focusing on "Understanding Covariance" and "Diving into Correlation" respectively. These chapters provide in-depth explanations of what covariance and correlation are, how they're calculated, and how to interpret them. You'll learn about their properties, the mathematics behind them, and how to compute them efficiently from data. The concept of the covariance matrix is introduced, setting the stage for its applications in later chapters.
Chapter 4 expands your toolkit by exploring "Types of Correlation". Here, you'll learn about alternatives to the Pearson correlation coefficient, such as Spearman's rank correlation and Kendall's tau. This chapter emphasizes the importance of choosing the right correlation measure for different types of data and relationships.
With a solid understanding of the basics, Chapter 5 delves into "Statistical Inference for Correlation". This chapter covers hypothesis testing, confidence intervals, and the effects of sample size on correlation estimates. It also addresses the critical issue of multiple testing, which is particularly relevant in big data scenarios.
Chapter 6 focuses on "Visualizing Covariance and Correlation". Here, you'll learn various techniques for visually representing relationships in data, from simple scatter plots to complex heat maps and interactive visualizations. This chapter emphasizes the importance of visualization in both exploratory data analysis and in communicating results effectively.
The next several chapters explore applications of covariance and correlation in various domains of computer science and data analysis. Chapter 7 covers "Multivariate Analysis Techniques", including Principal Component Analysis (PCA) and factor analysis. Chapter 8 extends these concepts to "Time Series Analysis", discussing autocorrelation, cross-correlation, and concepts like Granger causality.
Chapter 9 focuses on "Applications in Machine Learning", showing how covariance and correlation are used in feature selection, regularization, and anomaly detection. Chapters 10 and 11 explore applications in "Signal Processing and Image Analysis" and "Natural Language Processing" respectively, demonstrating the wide-ranging utility of these concepts.
Chapter 12 takes a graph-theoretic perspective, discussing "Network Analysis and Graph Theory". Here, you'll see how correlation concepts extend to analyzing relationships in complex networks and graphs.
As data sizes continue to grow, Chapter 13 addresses "Covariance and Correlation in Big Data", covering distributed computing approaches and scalable algorithms for correlation analysis in large-scale datasets.
Chapter 14 is crucial for developing a nuanced understanding, focusing on "Common Pitfalls and Misconceptions". This chapter addresses issues like the distinction between correlation and causation, the influence of outliers, and Simpson's paradox. It aims to cultivate a critical mindset when interpreting correlation results.
Finally, Chapter 15 looks towards the future, exploring "Future Directions and Advanced Topics". This includes emerging areas like quantum computing applications in correlation analysis and AI-driven correlation discovery.
Throughout the book, you'll find practical examples, code snippets, and exercises that help reinforce the concepts and demonstrate their application in real-world scenarios. Each chapter builds on the previous ones, but they're also designed to be relatively self-contained, allowing you to focus on specific areas of interest if desired.
The book concludes with a comprehensive glossary and suggestions for further reading, providing resources for continued learning and exploration. By structuring the content in this way, the book aims to take you on a journey from the basics of covariance and correlation to their advanced applications in modern computer science and data analysis. Whether you're looking to strengthen your foundational knowledge or explore cutting-edge applications, this structure ensures that you'll find valuable insights and practical skills to enhance your work with data and algorithms.
Prerequisites and Assumed Knowledge
This book is designed for computer science and data science students and professionals who have an intermediate knowledge of probability and statistics. While we strive to make the content accessible, certain prerequisites will help you get the most out of this exploration of covariance and correlation. This section outlines the assumed knowledge and skills that will serve as a foundation for the concepts covered in the book.
First and foremost, a solid grounding in basic probability theory is essential. You should be comfortable with concepts such as probability distributions, random variables, expected values, and variance. Familiarity with both discrete and continuous probability distributions, particularly the normal (Gaussian) distribution, will be beneficial. If you've taken an introductory course in probability or have practical experience applying probabilistic concepts, you should be well-prepared.
In terms of statistics, you should have a good understanding of descriptive statistics, including measures of central tendency (mean, median, mode) and measures of dispersion (variance, standard deviation). Familiarity with the concepts of sampling, population parameters, and sample statistics will also be helpful. While we'll review some of these concepts, having prior exposure will allow you to focus more on their application to covariance and correlation.
A basic understanding of linear algebra is assumed, particularly concepts related to vectors and matrices. You should be comfortable with operations like matrix multiplication and transposition. While we'll explain more advanced linear algebra concepts as they arise, having a foundation will make these discussions more accessible.
In terms of mathematical skills, you should be comfortable with calculus concepts, particularly differentiation and integration. While the book doesn't delve deeply into complex mathematical proofs, understanding the mathematical foundations of statistical concepts often requires basic calculus skills.
From a computer science perspective, familiarity with basic algorithmic concepts and data structures is assumed. While the book focuses on statistical concepts rather than implementation details, understanding algorithmic efficiency and basic data structures will help in appreciating the computational aspects of covariance and correlation calculations, especially when dealing with large datasets.
Programming experience, while not strictly necessary to understand the concepts, will be beneficial for applying the ideas presented in the book. Many examples and exercises will include code snippets or pseudocode. Familiarity with a programming language commonly used in data analysis (such as Python, R, or MATLAB) will allow you to more easily translate the concepts into practical implementations.
Experience with data analysis tools and libraries (such as NumPy, Pandas, or scikit-learn in Python) is not assumed but can be helpful. If you have such experience, you'll find it easier to connect the theoretical concepts with practical applications. However, the book focuses on explaining the underlying principles rather than specific tool usage, so lack of experience with these libraries is not a barrier.
A basic understanding of machine learning concepts, while not essential, can provide helpful context for some of the more advanced applications discussed in the later chapters. If you're familiar with concepts like supervised and unsupervised learning, feature selection, and dimensionality reduction, you'll find it easier to appreciate how covariance and correlation fit into the broader landscape of data science and machine learning.
It's important to note that while these prerequisites provide a helpful foundation, the book is designed to be accessible to a range of readers. Key concepts are explained thoroughly, and more advanced topics are introduced gradually. If you find that you're lacking in some areas of the assumed knowledge, don't be discouraged. The book includes references and suggestions for further reading that can help fill any gaps.
Ultimately, the most important prerequisite is a curiosity about understanding relationships in data and a willingness to engage with both the mathematical foundations and practical applications of covariance and correlation. With this mindset, you'll be well-prepared to tackle the concepts presented in this book and apply them to your own work in computer science and data analysis.
This is the end of the free sample. The full book has 15 chapters.
Want this book written for you?
Tell us your goals and background, and get your own version of this book, tailored by AI to you.


Benefits of AI-tailored books
- Read one book, not ten:
- all the Data Science knowledge you need, gathered into a single book.
- Save days of learning:
- tell us your goals, choose your topics, and the whole book is built around them.
- Learn effortlessly:
- Data Science book written for your specific background and expertise.
- Understand at a glance:
- includes charts, tables, timelines, checklists, decision trees, and more.
- Stay current:
- written the day you order it, not years ago.
- Trust what you read:
- every book is checked for accuracy, with real research when your subject needs it.
Create your unique book in 3 steps
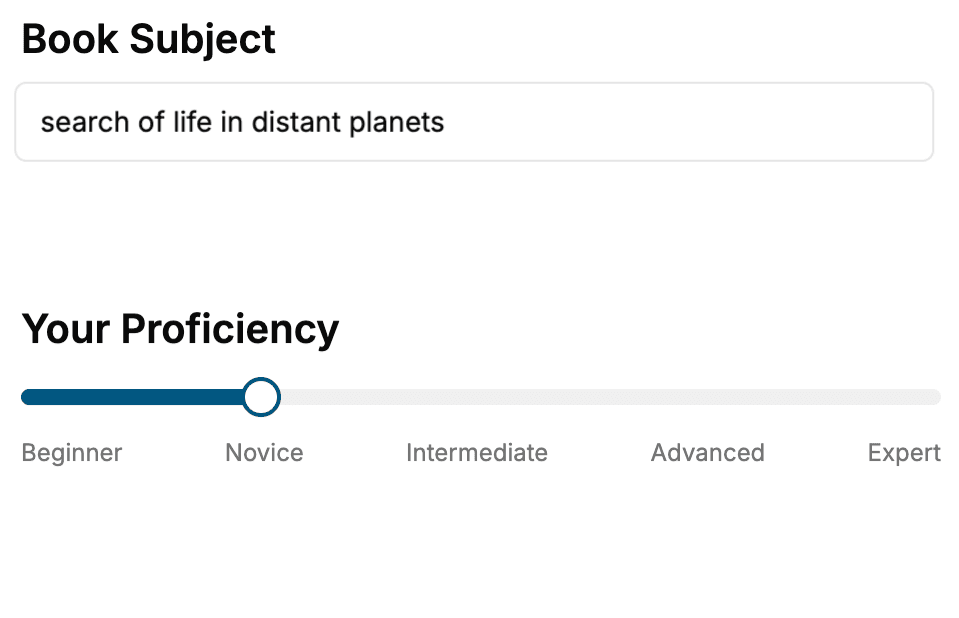
- 1. Select your focus
Select the focus of your Data Science book and share your background
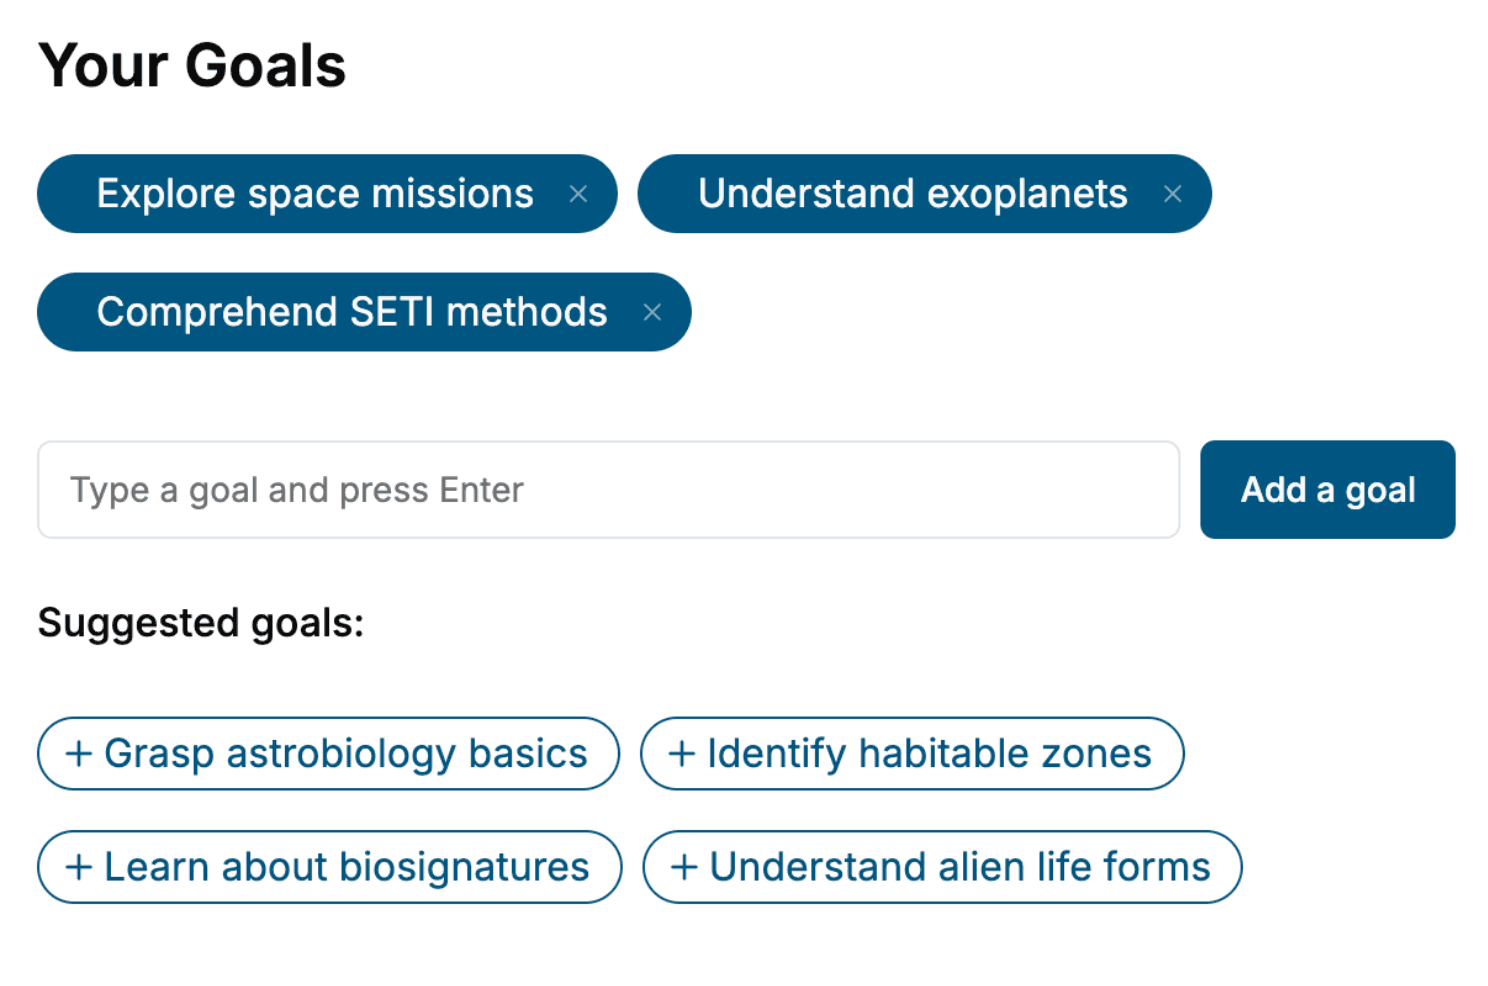
- 2. Personalize your book
Specify your goals and choose sub-topics to include
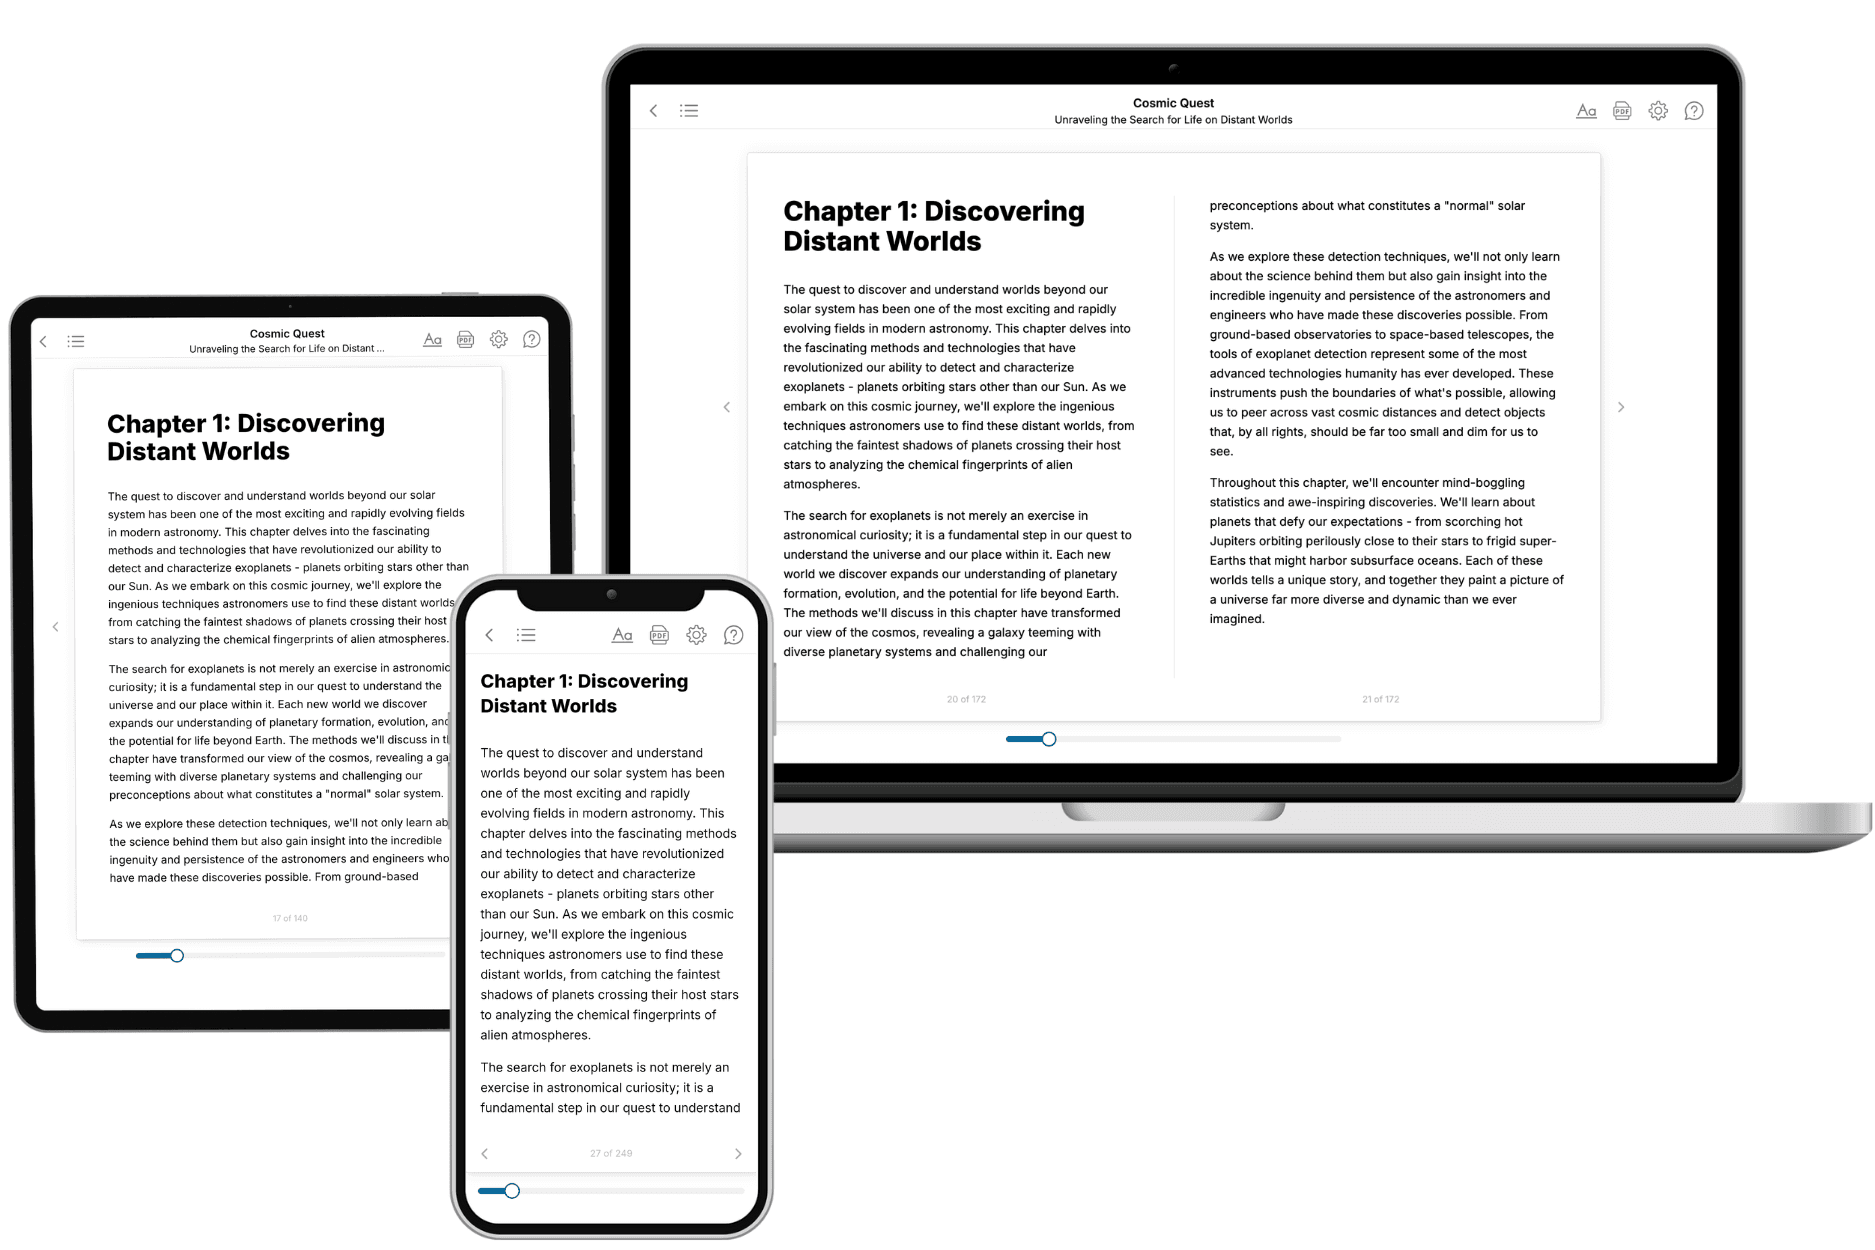
- 3. Get your tailored book
Your book is ready in 10 minutes. Read it online, download as EPUB or PDF, or send to Kindle.
Frequently asked questions
- What is TailoredRead?
TailoredRead creates complete, full-length nonfiction ebooks, written specifically for you. Tell us what you want to learn and why, and TailoredRead writes you a complete ebook on it, with charts, tables, and diagrams throughout. Read it online, on Kindle, or on any e-reader, or download it as a PDF or EPUB. Every book is written fresh the day you order it.
- How is the book tailored to me?
Before anything is written, you answer a few short questions about your goals, your background, and the topics you care about. Your book is then planned around your answers: written at your level, focused on your goals, and covering the topics you chose, instead of the one-size-fits-all book a store sells everyone.
- Will it read like generic AI content?
No. Your book isn't a chat transcript: it's planned chapter by chapter before a single word is written, told in a clear book voice, and explains ideas visually with charts, tables, and diagrams. After writing, every book goes through an editorial pass that polishes chapters so the book reads consistent from start to finish. Judge for yourself: browse thousands of sample books on our Explore Books page.
- How accurate is the content?
Our AI first checks whether your subject needs live research. Niche and fast-moving subjects are researched before writing, and the book plan and chapters are grounded in what it finds. After writing, every book goes through a quality pass that checks its facts and consistency, and researched books list their sources in a Notes section at the back.
- How long is the book?
You choose the length: Comprehensive (250-300 pages), Detailed (150-200 pages), Essential (70-100 pages), or Short (30-50 pages).
- Does the book include visuals?
Yes. Every book includes visual elements such as timelines, checklists, step-by-step guides, decision trees, comparison tables, and matrices, and many include bar charts. A typical book includes dozens of these visual elements.
- Can I read it on Kindle? What formats can I download?
Yes. Every book can be read in our online reader or downloaded as a PDF or EPUB. The EPUB can be opened with Kindle, Apple Books, Kobo, and any e-reader. The Commercial and Author licenses also include an editable Word (DOCX) and Markdown download.
- How much does it cost?
About the price of a regular ebook. The exact price depends on your book's length and complexity, from $2 for the shortest books to $35 for the most comprehensive, and it's shown when you review your book, before you commit to anything. Each book is a one-time purchase, yours to keep, no subscription. Licenses that let you share, teach, or publish your book range from $35.99 to $49.99.
- Can I preview the book before purchasing?
Before you pay, you'll see what your book will cover: the title, a detailed description, the estimated length, and the complete chapter-by-chapter table of contents, so you know what you're getting before you decide. The full text itself is written after you purchase.
- How long does it take to create a book?
About 10 minutes. You can start reading the opening chapters while the rest is still being written.