Dimension Reduction Methods
A Practical Guide to Simplifying Complex Data
Picture yourself confidently navigating complex datasets, extracting meaningful patterns from high-dimensional data, and communicating your findings with clarity and precision.
269 pages13 chaptersOct 28, 2025Data Science
About this book
You're no longer overwhelmed by the curse of dimensionality or paralyzed by computational constraints. Instead, you wield a sophisticated toolkit of dimension reduction techniques that transform unwieldy data into actionable insights. This comprehensive guide takes you beyond the basics of PCA and into the rich landscape of modern dimension reduction methods. You'll discover when to apply linear versus nonlinear techniques, how to preserve the most critical information while discarding noise, and why certain methods excel in specific contexts. Through clear explanations grounded in statistical theory and practical examples that illuminate real-world applications, you'll develop an intuitive understanding of how these methods work and when to deploy them. Whether you're analyzing genomic data, processing images, or exploring customer behavior patterns, you'll gain the analytical framework to choose the right approach for your specific challenge. This book bridges the gap between mathematical rigor and practical implementation, giving you both the conceptual foundation and the applied knowledge to make dimension reduction a powerful asset in your analytical arsenal.
Table of contents
- IntroductionThe High-Dimensional Data Challenge, What Is Dimension Reduction?, How to Use This BookRead below
- Chapter 1: The Curse of DimensionalityUnderstanding the Curse, Geometric Intuition in High Dimensions, Statistical Implications, When Dimension Reduction Helps
- Chapter 2: Mathematical FoundationsLinear Algebra Essentials, Eigenvalues and Eigenvectors, Singular Value Decomposition, Optimization Principles
- Chapter 3: Principal Component AnalysisThe Core Intuition Behind PCA, Mathematical Derivation, Computing Principal Components, Interpreting PCA Results
- Chapter 4: PCA in PracticeChoosing the Number of Components, Scaling and Centering Decisions, Diagnostics and Validation, Common Pitfalls and Solutions
- Chapter 5: Factor AnalysisFactor Analysis Versus PCA, The Latent Variable Model, Estimation and Rotation Methods, When to Use Factor Analysis
- Chapter 6: Multidimensional ScalingCore Principles of MDS, Classical MDS, Metric and Non-Metric MDS, Stress and Goodness of Fit
- Chapter 7: Nonlinear Dimension ReductionWhy Nonlinear Methods Matter, The Manifold Hypothesis, Kernel PCA, Isomap and Locally Linear Embedding
- Chapter 8: Modern Techniquest-SNE: Preserving Local Structure, UMAP: Uniform Manifold Approximation, Autoencoders and Deep Learning, Comparing Modern Methods
- Chapter 9: Supervised Dimension ReductionLinear Discriminant Analysis, Partial Least Squares, Supervised Versus Unsupervised Approaches
- Chapter 10: Feature Selection MethodsSelection Versus Extraction, Filter Methods, Wrapper and Embedded Methods, Regularization Approaches
- Chapter 11: Evaluation and ValidationQuality Metrics for Dimension Reduction, Reconstruction Error, Downstream Task Performance, Visualization as Diagnostic Tool
- Chapter 12: Practical ApplicationsImage and Computer Vision Data, Genomic and Biological Data, Text and Natural Language Processing, Time Series and Spatial Data
- Chapter 13: Choosing the Right MethodA Decision Framework, Matching Methods to Data Characteristics, Computational Considerations, Interpretability Trade-offs
- ConclusionKey Takeaways, Future Directions in Dimension Reduction, Continuing Your Learning Journey
- Glossary
- Further Reading
Introduction
Modern data analysis presents a paradox that grows more acute with each passing year. As our ability to collect and store data expands exponentially, the complexity of that data threatens to overwhelm our capacity to extract meaningful insights from it. A genomic study might track the expression levels of twenty thousand genes across hundreds of patients. An image recognition system processes millions of pixel values for each photograph. A customer analytics platform monitors thousands of behavioral variables for each user. This abundance of information, rather than clarifying our understanding, often obscures the patterns we seek to discover.
The challenge isn't simply that we have more data to process. High-dimensional data fundamentally behaves differently than the low-dimensional data our intuitions are built upon. Distance measures become unreliable. Statistical models require exponentially more observations to achieve the same level of confidence. Visualization becomes impossible when your data exists in spaces with hundreds or thousands of dimensions. These aren't minor inconveniences—they represent fundamental obstacles that can render standard analytical approaches ineffective or misleading. This phenomenon, known as the curse of dimensionality, affects everything from machine learning algorithms to basic statistical inference.
Dimension reduction methods offer a principled approach to this challenge. Rather than attempting to work directly with data in its original high-dimensional form, these techniques identify lower-dimensional representations that preserve the most important characteristics of the data. The goal isn't merely to make datasets smaller or computations faster, though these are valuable benefits. The deeper purpose is to reveal structure that exists in the data but remains hidden in the noise and complexity of high-dimensional space. When applied thoughtfully, dimension reduction transforms intractable problems into manageable ones and uncovers patterns that would otherwise remain invisible.
This book provides you with a comprehensive understanding of dimension reduction methods, from foundational techniques like Principal Component Analysis to modern approaches like UMAP and autoencoders. You'll develop both the theoretical knowledge to understand how these methods work and the practical judgment to choose the right technique for your specific analytical challenge. Whether you're working with genomic sequences, customer behavior data, image collections, or any other high-dimensional dataset, you'll gain the tools and insights needed to extract meaningful patterns and communicate your findings effectively.
The journey ahead requires engagement with mathematical concepts, but the emphasis throughout remains on building intuition and practical understanding. Each method is presented not as an abstract algorithm but as a solution to specific analytical problems. You'll see concrete examples of when each approach excels and when it falls short. You'll learn to recognize the assumptions underlying different techniques and understand the trade-offs involved in choosing one method over another. By the end, you'll possess not just a collection of techniques but a coherent framework for thinking about dimension reduction in your own work.
The High-Dimensional Data Challenge
High-dimensional data has become ubiquitous across virtually every field that relies on quantitative analysis. In genomics, a single microarray experiment might measure the expression of 20,000 genes simultaneously. In computer vision, even a modest 256×256 pixel grayscale image represents a point in 65,536-dimensional space. In marketing analytics, customer profiles routinely include hundreds or thousands of behavioral variables, demographic attributes, and interaction histories. This proliferation of dimensions isn't accidental—it reflects our growing ability to measure and record detailed information about complex phenomena. Yet this capability comes with profound analytical challenges that aren't immediately obvious.
Consider a seemingly simple task: finding similar observations in your dataset. In two or three dimensions, this is straightforward—you calculate distances and identify nearby points. But as dimensionality increases, something counterintuitive happens. The ratio between the distances to the nearest and farthest neighbors approaches one, meaning that in high-dimensional space, all points become approximately equidistant from each other[1]. This phenomenon undermines distance-based methods that work perfectly well in lower dimensions. Clustering algorithms struggle to identify meaningful groups. Nearest neighbor classifiers lose their discriminative power. The very notion of proximity becomes problematic.
The statistical implications extend far beyond distance measures. In high-dimensional space, data becomes increasingly sparse. Imagine sampling 100 points uniformly in a unit interval—you'd have reasonably dense coverage. Now imagine sampling 100 points in a 10-dimensional unit hypercube. Those same 100 points are now scattered across a vastly larger space, leaving most of the volume empty. To achieve the same density you had in one dimension, you'd need 100 to the power of 10 observations—an impossibly large number. This sparsity means that statistical estimates become unreliable, models overfit easily, and the amount of data required to make confident inferences grows exponentially with dimension.
Visualization presents another fundamental challenge. Humans excel at perceiving patterns in two or three dimensions, but we cannot directly visualize higher-dimensional spaces. When your data has 50 dimensions, you cannot simply plot it and look for structure. Standard approaches like creating multiple two-dimensional scatter plots quickly become unwieldy—50 dimensions yield 1,225 possible pairwise plots. Even if you examined them all, you'd miss patterns that only emerge when considering multiple dimensions simultaneously. This limitation isn't merely inconvenient; it cuts us off from one of our most powerful tools for understanding data: visual pattern recognition.
Computational costs escalate rapidly with dimension as well. Many algorithms have complexity that grows polynomially or exponentially with the number of dimensions. A clustering algorithm that runs in seconds on 10-dimensional data might take hours on 100-dimensional data and become completely impractical at 1,000 dimensions. Memory requirements similarly explode—storing pairwise distances for 10,000 observations in 1,000 dimensions requires gigabytes of memory. These aren't just engineering challenges to be solved with faster computers; they represent fundamental scaling problems that demand algorithmic solutions.
Perhaps most insidiously, high dimensionality enables overfitting in ways that can be difficult to detect. With enough dimensions, you can find spurious patterns that appear statistically significant but reflect nothing more than random noise. A classic example: if you measure 100 variables on 50 patients, you can always find some combination of variables that perfectly separates any two groups, even if those groups were assigned randomly. The model appears to work perfectly on your data but fails completely on new observations. This isn't a failure of the modeling technique—it's an inevitable consequence of having more dimensions than observations.
Real-world examples illustrate these challenges vividly. In genomic studies, researchers often face the "large p, small n" problem—thousands of genes measured on dozens of patients. Standard statistical tests break down in this regime, producing false discoveries at alarming rates. In image processing, working directly with raw pixel values makes even simple tasks computationally prohibitive and statistically unstable. In text analysis, representing documents as vectors of word frequencies creates extremely high-dimensional, sparse representations where most entries are zero. Each field has developed domain-specific approaches to these challenges, but the underlying problem remains the same: high-dimensional data requires fundamentally different analytical strategies than low-dimensional data.
The good news is that high-dimensional data often contains substantial redundancy. Those 20,000 genes don't all vary independently—many are correlated because they participate in common biological pathways. The millions of pixels in an image aren't random—they exhibit spatial structure and correlations. Customer behaviors cluster around common patterns rather than varying arbitrarily across all possible dimensions. This redundancy suggests that the data, while represented in high-dimensional space, may actually lie on or near a lower-dimensional structure. Dimension reduction methods exploit this insight, seeking to identify and extract the lower-dimensional representation that captures the essential characteristics of the data while discarding redundant or noisy dimensions.
What Is Dimension Reduction?
Dimension reduction refers to the process of transforming high-dimensional data into a lower-dimensional representation while preserving important properties of the original data. Rather than working with all available dimensions, you create a smaller set of new dimensions—often called components, factors, or embeddings—that capture the most significant patterns in your data. This isn't simply about selecting a subset of the original variables, though that's one approach. More commonly, dimension reduction creates entirely new variables that combine information from multiple original dimensions in ways that maximize the retention of important structure.
The fundamental premise underlying dimension reduction is that high-dimensional data often has intrinsic dimensionality much lower than its ambient dimensionality. Ambient dimensionality refers to the number of dimensions in which the data is represented—the number of columns in your data matrix. Intrinsic dimensionality refers to the minimum number of dimensions needed to represent the data without substantial loss of information. For example, imagine data points that lie on a two-dimensional plane embedded in three-dimensional space. The ambient dimensionality is three, but the intrinsic dimensionality is two. Dimension reduction methods attempt to discover and extract this lower-dimensional structure.
Different dimension reduction methods preserve different properties of the original data, and understanding these differences is crucial for choosing appropriate techniques. Some methods, like Principal Component Analysis, focus on preserving variance—they seek low-dimensional representations that capture as much of the variability in the original data as possible. Other methods, like Multidimensional Scaling, prioritize preserving distances or dissimilarities between observations. Still others, like t-SNE, emphasize preserving local neighborhood structure, ensuring that points close together in high-dimensional space remain close in the low-dimensional representation. No single method preserves all properties simultaneously, so the choice depends on what aspects of your data matter most for your analysis.
Dimension reduction serves multiple analytical purposes beyond simply making datasets smaller. First, it enables visualization by reducing data to two or three dimensions that can be plotted and examined visually. This allows you to leverage human pattern recognition capabilities to identify clusters, outliers, and trends that might be invisible in high-dimensional space. Second, it provides noise reduction by separating signal from noise. If the true underlying structure is lower-dimensional, then the additional dimensions in your data likely represent measurement error, irrelevant variation, or noise. By projecting onto the lower-dimensional structure, you filter out this noise.
Third, dimension reduction facilitates feature extraction, creating new variables that may be more informative or interpretable than the original measurements. In image processing, for example, the raw pixels are rarely the most useful representation—dimension reduction can extract higher-level features like edges, textures, or shapes. Fourth, it enables computational efficiency by reducing the size of datasets and the complexity of subsequent analyses. Training a machine learning model on 10 dimensions is vastly faster than training on 1,000 dimensions. Finally, dimension reduction helps address statistical challenges like multicollinearity and overfitting by reducing the number of variables relative to the number of observations.
Dimension reduction methods can be categorized along several important dimensions. Linear versus nonlinear methods differ in the types of relationships they can capture. Linear methods like PCA assume that the important structure in the data can be captured through linear combinations of the original variables. Nonlinear methods like t-SNE or autoencoders can capture more complex, curved structures. Supervised versus unsupervised methods differ in whether they use outcome or label information. Unsupervised methods like PCA work with the feature data alone, while supervised methods like Linear Discriminant Analysis incorporate information about class labels or outcomes to find dimensions that best separate different groups.
Another important distinction is between feature extraction and feature selection. Feature extraction methods create new variables as combinations of the original variables—PCA components are weighted sums of the original features. Feature selection methods choose a subset of the original variables to retain, discarding the rest. Feature extraction typically achieves greater dimension reduction and noise filtering, but feature selection maintains interpretability by working with the original variables. Some applications require feature selection because the original variables have direct meaning—in genomics, for instance, identifying which specific genes are important is often more valuable than creating abstract combinations of genes.
The mathematical frameworks underlying dimension reduction vary considerably. Some methods, like PCA, have elegant closed-form solutions based on eigenvalue decomposition or singular value decomposition. Others, like t-SNE, require iterative optimization procedures that minimize a cost function. Some methods make explicit probabilistic assumptions about the data-generating process, while others are purely algorithmic. Understanding these mathematical foundations helps you recognize when methods are likely to work well and when they might struggle. It also enables you to diagnose problems and make informed decisions about parameter settings and preprocessing steps.
Practical application of dimension reduction requires careful attention to several considerations. Preprocessing decisions like whether to center or scale your variables can dramatically affect results. Parameter selection—choosing the number of dimensions to retain, setting algorithmic parameters—involves trade-offs between information preservation and simplification. Validation requires assessing whether the reduced representation adequately captures important structure in your data. Interpretation demands understanding what the new dimensions represent and how they relate to the original variables. Each of these steps requires judgment informed by both statistical principles and domain knowledge about your specific data and analytical goals.
How to Use This Book
This book is structured to build your understanding progressively, from foundational concepts through classical methods to modern techniques. Each chapter builds on previous material, but the organization also allows you to focus on specific methods relevant to your immediate needs. If you're already comfortable with the curse of dimensionality and mathematical foundations, you might skim the early chapters and dive directly into specific techniques. If you're encountering dimension reduction for the first time, working through the chapters sequentially will provide the most coherent learning experience. The goal throughout is to develop both theoretical understanding and practical judgment.
The early chapters establish essential foundations. Chapter 1 explores the curse of dimensionality in depth, providing geometric intuition and statistical understanding of why high-dimensional data behaves so differently from low-dimensional data. This chapter helps you recognize when dimension reduction is necessary and what problems it can solve. Chapter 2 covers the mathematical foundations—linear algebra, eigenvalue decomposition, singular value decomposition, and optimization principles—that underpin most dimension reduction methods. If you're rusty on these topics, this chapter provides focused review. If you're comfortable with the mathematics, you can use it as reference material when needed.
The middle chapters cover classical dimension reduction methods in detail. Chapters 3 and 4 provide comprehensive coverage of Principal Component Analysis, the most widely used dimension reduction technique. Chapter 3 develops the mathematical theory and intuition, while Chapter 4 focuses on practical application, including how to choose the number of components, handle preprocessing decisions, and avoid common pitfalls. Chapter 5 covers Factor Analysis, explaining how it differs from PCA and when each approach is more appropriate. Chapter 6 introduces Multidimensional Scaling, which takes a fundamentally different approach by working with dissimilarities rather than raw data.
Later chapters explore nonlinear and modern methods. Chapter 7 introduces nonlinear dimension reduction, explaining the manifold hypothesis and covering techniques like kernel PCA, Isomap, and Locally Linear Embedding. Chapter 8 examines modern techniques including t-SNE, UMAP, and autoencoders, which have become increasingly important for complex data types. These chapters help you understand when linear methods are insufficient and how to choose among the growing array of nonlinear alternatives. Chapter 9 covers supervised dimension reduction methods like Linear Discriminant Analysis and Partial Least Squares, which incorporate outcome information to find dimensions that maximize predictive power or group separation.
The final chapters address practical considerations and applications. Chapter 10 discusses feature selection methods, which complement feature extraction approaches by identifying important subsets of original variables. Chapter 11 covers evaluation and validation, providing metrics and diagnostic tools for assessing dimension reduction quality. Chapter 12 explores practical applications across different domains—images, genomics, text, time series—showing how dimension reduction principles adapt to different data types. Chapter 13 provides a decision framework for choosing among methods based on data characteristics, computational constraints, and analytical goals.
Throughout the book, you'll find several recurring elements designed to deepen understanding:
- Mathematical derivations show where methods come from and what assumptions they make, building intuition about when they'll work well
- Concrete examples illustrate concepts with specific datasets and scenarios, making abstract ideas tangible
- Practical guidance addresses implementation decisions, parameter choices, and common challenges you'll encounter in real applications
- Comparative discussions highlight differences between related methods, helping you understand trade-offs and choose appropriate techniques
- Diagnostic approaches provide tools for validating results and identifying problems with dimension reduction outcomes
The mathematical level assumes comfort with basic linear algebra, probability, and statistics. You should be familiar with concepts like matrices, vectors, means, variances, and covariances. When more advanced mathematics is required, the book provides sufficient background or intuitive explanations to make the material accessible. The emphasis is always on understanding what methods do and why, not on mathematical rigor for its own sake. Proofs are included when they provide insight, but you don't need to master every mathematical detail to apply these methods effectively.
To get the most from this book, consider supplementing your reading with hands-on practice. While the book doesn't include code, applying the methods to your own data or publicly available datasets will solidify your understanding. Start with simple, well-understood datasets where you can verify that methods behave as expected. Experiment with different parameter settings and preprocessing choices to see how they affect results. Compare multiple methods on the same data to develop intuition about their different characteristics. This practical experience, combined with the conceptual understanding developed in the book, will make you a sophisticated user of dimension reduction techniques.
The field of dimension reduction continues to evolve, with new methods and refinements appearing regularly. This book focuses on established techniques with proven track records, but it also introduces modern methods that have gained widespread adoption. The goal is to provide you with a foundation that will remain relevant even as specific techniques evolve. By understanding the principles underlying different approaches—what they optimize, what assumptions they make, what properties they preserve—you'll be equipped to evaluate new methods as they emerge and make informed decisions about when to adopt them.
Finally, remember that dimension reduction is a means to an end, not an end in itself. The ultimate goal is always to gain insight into your data, answer scientific questions, or build effective predictive models. Dimension reduction serves these goals by making high-dimensional data tractable and revealing hidden structure. As you work through this book, keep your analytical objectives in mind. The best dimension reduction method is the one that helps you achieve your specific goals most effectively, whether that's creating interpretable visualizations, improving prediction accuracy, identifying important features, or simply making computations feasible. This book provides the knowledge and judgment to make those choices confidently.
Notes
Introduction
- 1. K. Beyer and others, "When is 'nearest neighbor' meaningful?," International conference on database theory (). Springer, 1999
This is the end of the free sample. The full book has 13 chapters.
Want this book written for you?
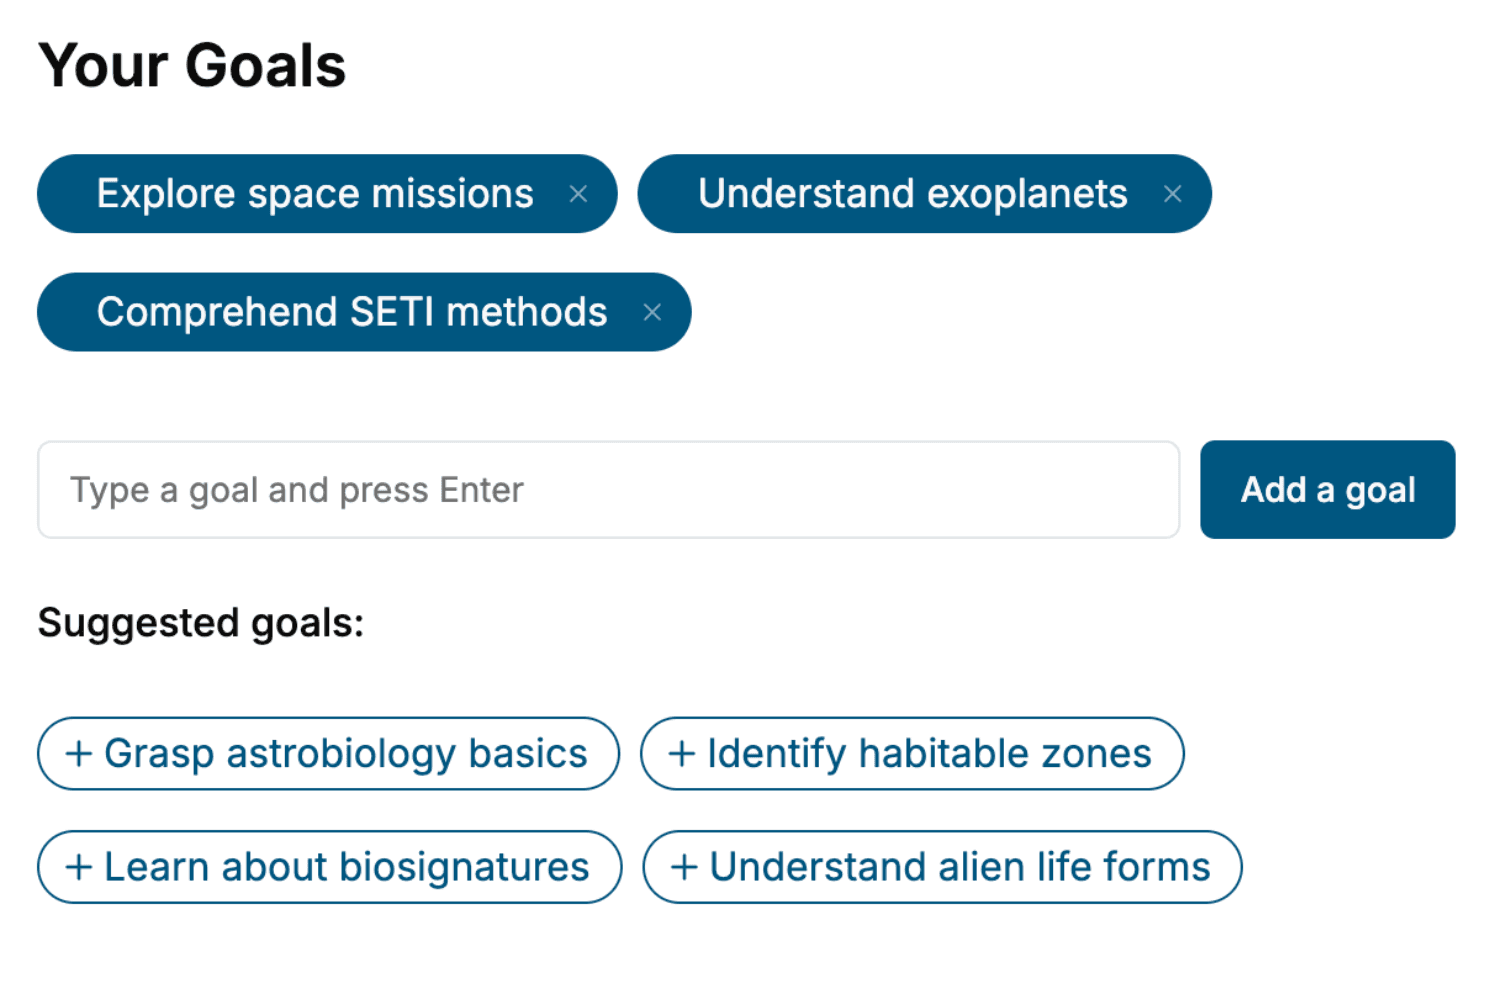
Tell us your goals and background, and get your own version of this book, tailored by AI to you.


Benefits of AI-tailored books
- Read one book, not ten:
- all the Data Science knowledge you need, gathered into a single book.
- Save days of learning:
- tell us your goals, choose your topics, and the whole book is built around them.
- Learn effortlessly:
- Data Science book written for your specific background and expertise.
- Understand at a glance:
- includes charts, tables, timelines, checklists, decision trees, and more.
- Stay current:
- written the day you order it, not years ago.
- Trust what you read:
- every book is checked for accuracy, with real research when your subject needs it.
Create your unique book in 3 steps
- 1. Select your focus
Select the focus of your Data Science book and share your background
- 2. Personalize your book
Specify your goals and choose sub-topics to include
- 3. Get your tailored book
Your book is ready in 10 minutes. Read it online, download as EPUB or PDF, or send to Kindle.


Frequently asked questions
- What is TailoredRead?
TailoredRead creates complete, full-length nonfiction ebooks, written specifically for you. Tell us what you want to learn and why, and TailoredRead writes you a complete ebook on it, with charts, tables, and diagrams throughout. Read it online, on Kindle, or on any e-reader, or download it as a PDF or EPUB. Every book is written fresh the day you order it.
- How is the book tailored to me?
Before anything is written, you answer a few short questions about your goals, your background, and the topics you care about. Your book is then planned around your answers: written at your level, focused on your goals, and covering the topics you chose, instead of the one-size-fits-all book a store sells everyone.
- Will it read like generic AI content?
No. Your book isn't a chat transcript: it's planned chapter by chapter before a single word is written, told in a clear book voice, and explains ideas visually with charts, tables, and diagrams. After writing, every book goes through an editorial pass that polishes chapters so the book reads consistent from start to finish. Judge for yourself: browse thousands of sample books on our Explore Books page.
- How accurate is the content?
Our AI first checks whether your subject needs live research. Niche and fast-moving subjects are researched before writing, and the book plan and chapters are grounded in what it finds. After writing, every book goes through a quality pass that checks its facts and consistency, and researched books list their sources in a Notes section at the back.
- How long is the book?
You choose the length: Comprehensive (250-300 pages), Detailed (150-200 pages), Essential (70-100 pages), or Short (30-50 pages).
- Does the book include visuals?
Yes. Every book includes charts, tables, and diagrams: timelines, checklists, step-by-step guides, decision trees, comparison tables, matrices, and bar charts. A typical book includes dozens of these visual elements.
- Can I read it on Kindle? What formats can I download?
Yes. Every book can be read in our online reader or downloaded as a PDF or EPUB. The EPUB can be opened with Kindle, Apple Books, Kobo, and any e-reader. The Commercial and Author licenses also include an editable Word (DOCX) and Markdown download.
- How much does it cost?
About the price of a regular ebook. The exact price depends on your book's length and complexity, from $2 for the shortest books to $35 for the most comprehensive, and it's shown when you review your book, before you commit to anything. Each book is a one-time purchase, yours to keep, no subscription. Licenses that let you share, teach, or publish your book range from $35.99 to $49.99.
- Can I preview the book before purchasing?
Before you pay, you'll see what your book will cover: the title, a detailed description, the estimated length, and the complete chapter-by-chapter table of contents, so you know what you're getting before you decide. The full text itself is written after you purchase.
- How long does it take to create a book?
About 10 minutes. You can start reading the opening chapters while the rest is still being written.