Electrochemical Impedance Essentials
Master EIS for Biosensing and Electronics Applications
Electrochemical impedance spectroscopy (EIS) is the gold standard for characterizing electrochemical systems, yet many practitioners struggle to move beyond basic measurements to genuine understanding.
222 pages10 chaptersAug 1, 2026Electrochemistry
About this book
This book bridges that gap by combining rigorous fundamentals with practical application in biosensing and electronics. You'll learn how impedance measurements reveal the hidden dynamics of electrode interfaces, how to design experiments that yield reliable data, and how to extract meaningful physical parameters from complex spectra. Whether you're developing biosensors for medical diagnostics, optimizing battery performance, or investigating corrosion mechanisms, this guide provides the conceptual framework and hands-on techniques you need. Each chapter builds systematically from core principles through advanced interpretation strategies, with real-world examples demonstrating how EIS solves actual engineering challenges. By the end, you'll confidently design EIS experiments, interpret results accurately, and troubleshoot common problems that derail less experienced practitioners.
Table of contents
- IntroductionWhy Electrochemical Impedance Matters, EIS in Biosensing and Electronics, How to Use This BookRead below
- Chapter 1: Electrochemical FundamentalsCore Electrochemistry Concepts, What Is Impedance?, AC Perturbation and Linear Response
- Chapter 2: Electrochemical Impedance Spectroscopy PrinciplesHow EIS Measurements Work, Frequency-Dependent Behavior, Complex Impedance and Phase Angle
- Chapter 3: Nyquist Plots and Bode DiagramsReading and Interpreting Nyquist Plots, Bode Magnitude and Phase Diagrams, Comparing Nyquist and Bode Representations
- Chapter 4: Equivalent Circuit ModelsFundamental Circuit Elements in EIS, Building Equivalent Circuit Models, Extracting Physical Parameters from Fits
- Chapter 5: EIS in BiosensingHow Biosensors Use Impedance Changes, Electrode-Electrolyte Interfaces in Biosensing, Detecting Biological Molecules with EIS
- Chapter 6: EIS in Electronics and MaterialsBattery and Energy Storage Systems, Corrosion and Coating Evaluation, Characterizing Material Properties
- Chapter 7: Experimental Design and Best PracticesElectrode Preparation and Conditioning, Choosing Frequency Ranges and Intervals, Selecting Perturbation Amplitude and Potential
- Chapter 8: Ensuring Data Quality and ReliabilityIdentifying Noise and Artifacts, Validation Checks and Quality Metrics, Troubleshooting Common Measurement Problems
- Chapter 9: Advanced Analysis TechniquesDistribution of Relaxation Times, Advanced Impedance Modeling Approaches, Extracting Kinetic and Thermodynamic Parameters
- Chapter 10: Common Pitfalls and How to Avoid ThemOver-Parameterization and Model Overfitting, Ignoring Parasitic Elements and Artifacts, Misinterpreting Results and Drawing Wrong Conclusions
- ConclusionYour Path to EIS Mastery, Future Directions in EIS Research
- Glossary of Terms
- Further Reading and Resources
Introduction
A corroding pipeline, a failing lithium-ion battery, and a biosensor detecting a cancer biomarker at femtomolar concentrations share something unexpected: all three can be characterized, diagnosed, and optimized using the same fundamental measurement technique. Electrochemical Impedance Spectroscopy applies a small AC perturbation across a range of frequencies and listens carefully to how the system responds. The resulting data encodes the physics of charge transfer, ion diffusion, and interfacial capacitance in a form that no DC measurement can replicate. That breadth of application, combined with the depth of information it provides, is what makes EIS the preferred diagnostic tool across electrochemistry, materials science, and biomedical engineering.
Despite its reach, EIS has a reputation for being difficult to learn. The mathematics involves complex numbers and frequency-domain thinking. The graphical outputs, Nyquist plots and Bode diagrams, look unfamiliar at first. Equivalent circuit models require physical intuition as much as mathematical skill. And the gap between collecting a spectrum and actually understanding what it means can feel wide. Many practitioners learn just enough to run measurements and fit a standard Randles cell, then stop there, leaving a significant portion of the technique's diagnostic power unused.
This book is designed to close that gap. The goal is not to turn you into a theoretician but to give you the conceptual framework and practical skills to design sound EIS experiments, read spectra with confidence, build appropriate equivalent circuit models, and avoid the interpretive mistakes that lead experienced researchers astray. The chapters move from foundational electrochemistry through measurement principles, graphical interpretation, modeling, and application-specific guidance in biosensing and electronics, before addressing data quality, advanced analysis, and common pitfalls. Each topic builds on the one before it, so the sequence matters, but the structure also allows you to navigate directly to the areas most relevant to your current work.
The examples throughout this book are drawn from real application domains: impedimetric biosensors for clinical diagnostics, battery state of health monitoring, and corrosion evaluation of protective coatings. These are not hypothetical scenarios. They represent the kinds of problems EIS practitioners actually face, and the solutions illustrate principles that transfer across contexts. Whether your immediate interest is in electrode-electrolyte interfaces for biosensing or in characterizing solid electrolyte interphase formation in energy storage, the underlying logic is the same.
Why Electrochemical Impedance Matters
Most electrochemical measurements capture a single snapshot. A cyclic voltammogram sweeps potential and records current. A chronoamperometry experiment holds potential fixed and watches current decay. These are valuable, but they compress the system's behavior into a single dimension. Electrochemical Impedance Spectroscopy works differently. By probing the system across a wide range of AC frequencies, typically from a few millihertz up to several megahertz, it separates electrochemical processes that operate on different timescales. Fast processes like electron transfer appear at high frequencies. Slow processes like diffusion dominate at low frequencies. This separation is what makes EIS uniquely informative.
The physical quantity at the center of EIS is complex impedance, which has both a real part (resistance) and an imaginary part (reactance). The real part captures energy dissipation, while the imaginary part captures energy storage. Together, they describe how a system responds to an oscillating electrical signal at each frequency. This two-dimensional character of impedance is why Nyquist plots and Bode plots look the way they do, and why they carry so much more information than a simple resistance measurement.
Consider what happens at an electrode surface when a biosensor is functionalized with antibodies. Before any target molecule binds, the electrode has a certain double-layer capacitance and charge-transfer resistance. When target molecules bind to the antibodies, they physically block the electrode surface and alter the local dielectric environment. These changes shift the impedance spectrum in measurable, reproducible ways. A single DC resistance measurement might detect a large change, but it cannot distinguish between a change in capacitance and a change in charge-transfer resistance. EIS can, because those two parameters appear at different frequencies in the spectrum.
The same logic applies in battery research. As a lithium-ion cell ages, the solid electrolyte interphase layer on the anode grows thicker and more resistive. The charge-transfer resistance at the electrode-electrolyte interface increases. Diffusion of lithium ions through the electrode material slows. Each of these degradation mechanisms has a distinct impedance signature at a distinct frequency range. Tracking how those signatures evolve over charge-discharge cycles gives a far more detailed picture of battery state of health than capacity fade alone.[1]
Impedance also captures information that is genuinely invisible to other techniques. The double-layer capacitance at an electrode surface, for example, is not directly accessible from DC measurements. Neither is the Warburg impedance, which describes the frequency-dependent response of diffusion-limited processes. These parameters are not abstract mathematical constructs. They correspond to real physical phenomena: the arrangement of ions at an interface, the geometry of diffusion pathways, the kinetics described by Butler-Volmer kinetics. Understanding what each parameter means physically is what separates a practitioner who can interpret EIS from one who can only collect it.
There is also a practical argument for EIS that goes beyond information content. Because EIS uses a small AC perturbation, typically 5 to 10 millivolts in amplitude, it is a non-destructive technique. The system under study is not driven far from equilibrium. This matters enormously when characterizing fragile biological interfaces, expensive prototype devices, or systems that must remain functional after measurement. The ability to measure repeatedly without perturbing the system's state is one reason EIS has become standard practice in both research and industrial quality control.
Finally, EIS is quantitative in a way that many electrochemical techniques are not. When you fit an equivalent circuit model to an impedance spectrum and extract a charge-transfer resistance value, that number has a direct physical interpretation rooted in Butler-Volmer kinetics. When you track how that value changes as a function of analyte concentration in a biosensor, you are building a calibration curve grounded in a physical model, not just an empirical correlation. That quantitative grounding is what allows EIS results to be compared across laboratories, across instrument platforms, and across time.
EIS does not just measure how much a system resists current. It measures how and why it resists, at every timescale simultaneously. That distinction is the source of its diagnostic power.
EIS in Biosensing and Electronics
The two application domains that anchor this book, biosensing and electronics, represent EIS at its most practically consequential. In biosensing, EIS enables label-free detection of biological molecules at concentrations relevant to clinical diagnostics. In electronics and materials science, it characterizes the internal state of batteries, the integrity of protective coatings, and the bulk properties of novel materials. These are not niche applications. They represent active areas of research and product development where EIS is already embedded in standard workflows.
An impedimetric biosensor works by transducing a biological recognition event into a measurable change in impedance. The electrode surface is functionalized with a recognition element, typically an antibody, aptamer, or molecularly imprinted polymer, that selectively binds the target analyte. When binding occurs, the local environment at the electrode surface changes. The double-layer capacitance shifts because the dielectric properties of the interface change. The charge-transfer resistance increases because bound molecules physically block the electrode surface and impede electron transfer from a redox probe in solution. These changes are quantified by comparing impedance spectra before and after incubation with the analyte.
The practical appeal of this approach is significant. Label-free detection eliminates the need for fluorescent tags or enzyme conjugates, simplifying assay design and reducing cost. EIS measurements can be performed in complex biological matrices like serum or whole blood with appropriate surface chemistry. And the limit of detection achievable with well-designed impedimetric biosensors can reach into the femtomolar range for small molecules and proteins, making EIS competitive with optical techniques for many diagnostic targets.[2]
In electronics, the most prominent application of EIS is battery characterization. The technique is used at every stage of the battery development and deployment lifecycle: during cell design to understand how electrode materials and electrolyte formulations affect interfacial kinetics, during aging studies to track how the solid electrolyte interphase evolves, and in deployed systems to estimate state of health without disassembly. The ability to separate ohmic resistance, charge-transfer resistance, and diffusion-related impedance in a single measurement makes EIS far more informative than simple capacity or voltage measurements for diagnosing degradation mechanisms.
Corrosion science represents another major application area. When a metal surface is coated with a protective layer, EIS can characterize the coating's barrier properties by measuring its capacitance and resistance. As the coating degrades, water and ions penetrate, and the impedance spectrum changes in characteristic ways. The coating capacitance increases as water uptake raises the dielectric constant of the film. Resistance decreases as conductive pathways form through the coating. Tracking these changes over time provides an early warning of coating failure long before visible corrosion appears.[3]
Beyond batteries and corrosion, EIS is used to characterize the dielectric properties of thin films, the ionic conductivity of solid electrolytes, the performance of fuel cell membranes, and the electrical properties of semiconductor interfaces. In each case, the approach is the same: apply a small AC perturbation, measure the complex impedance response across a range of frequencies, and interpret the resulting spectrum using an appropriate physical model. The specific model changes with the application, but the measurement logic and the interpretive framework remain consistent.
One practical challenge that cuts across all these applications is the gap between measurement and interpretation. Modern potentiostats make it straightforward to collect an impedance spectrum. The instrument handles the frequency sweep, the lock-in detection, and the data output automatically. What the instrument cannot do is tell you which equivalent circuit model is appropriate, whether your data quality is sufficient for reliable fitting, or whether the parameter values you extracted are physically reasonable. Those judgments require understanding, and building that understanding is the purpose of this book.
A concrete example illustrates the stakes. Suppose you are developing an impedimetric biosensor for a cardiac biomarker and you observe a large increase in charge-transfer resistance after incubating with patient serum. Before concluding that the sensor detected the target, you need to ask several questions. Did the Kramers-Kronig relations hold for your data, confirming that the system was linear and stable during measurement? Did the equivalent circuit model fit the data with an acceptable chi-squared goodness of fit? Could the impedance change be explained by non-specific adsorption rather than specific binding? Each of these questions requires both technical knowledge and physical intuition. The chapters that follow provide both.
How to Use This Book
The book is organized as a progressive sequence, but it is also designed to be navigable by topic. If you are new to EIS, reading from the beginning is the most efficient path. The chapter on electrochemical fundamentals establishes the vocabulary and physical concepts that every later chapter assumes. The chapter on EIS principles explains how measurements are actually executed and what the raw data represents. From there, the chapters on Nyquist plots and Bode diagrams, and on equivalent circuit models, build the interpretive framework you will use throughout the rest of the book.
If you already have a working knowledge of EIS fundamentals and are primarily interested in a specific application, you can navigate more selectively. The chapter on EIS in biosensing covers electrode-electrolyte interfaces, surface functionalization strategies, and the transduction of binding events into impedance signals. The chapter on EIS in electronics and materials addresses battery characterization, corrosion monitoring, and material property measurement. These chapters are written to be accessible without requiring you to have read every preceding chapter, though they do assume familiarity with the core concepts of complex impedance, Nyquist plots, and equivalent circuit models.
The chapters on experimental design and data quality are relevant to everyone, regardless of application domain. Electrode preparation and conditioning, frequency range selection, and perturbation amplitude choices directly determine whether your data is interpretable. The chapter on data quality covers how to identify noise and artifacts, how to apply validation checks including the Kramers-Kronig relations, and how to troubleshoot the most common measurement problems. These are not optional topics. Skipping them is one of the most reliable ways to generate data that looks plausible but leads to wrong conclusions.
The advanced analysis chapter introduces techniques that go beyond standard equivalent circuit fitting. The distribution of relaxation times is a model-free approach that can reveal overlapping processes that a simple circuit model would miss. Nonlinear EIS extends the technique beyond the linear response regime. Methods for extracting kinetic and thermodynamic parameters from impedance data connect EIS results to the broader framework of electrochemical kinetics. These topics are genuinely advanced, and they are presented as extensions of the core framework rather than replacements for it.
The final chapter on common pitfalls deserves particular attention. Over-parameterization, the practice of adding circuit elements until a model fits without physical justification, is one of the most pervasive problems in EIS practice. Ignoring parasitic inductance at high frequencies leads to systematic errors in parameter extraction. Misreading the shape of a Nyquist plot can lead to the wrong equivalent circuit model entirely. Each of these pitfalls is described with concrete examples of what the error looks like in practice and how to avoid it. Reading this chapter alongside the chapters on equivalent circuit models and data quality will reinforce the interpretive habits that separate reliable EIS practice from unreliable EIS practice.
Throughout the book, key terms are introduced in bold when they first appear and are defined in context. The glossary at the back collects all canonical terms with concise definitions for quick reference. The further reading section points to primary literature and reference texts for topics where deeper treatment is warranted. The canonical terms used throughout this book, including terms like constant phase element, Warburg impedance, and Tikhonov regularization, are used consistently and precisely. When you encounter these terms in the primary literature, the definitions and usage here will map directly onto what you find there.
A note on the mathematical level: this book uses complex number notation and frequency-domain mathematics because those tools are necessary for working with EIS data. However, the emphasis throughout is on physical interpretation rather than mathematical derivation. Equations are presented with explanations of what each term represents physically, not just algebraically. Where derivations are needed to understand a result, they are included. Where they are not, the result is stated and its physical meaning is explained. The goal is to make you comfortable working with the mathematics of EIS, not to make the mathematics the point.
The most important habit to develop as you work through this material is the practice of connecting every mathematical result back to a physical picture. When you see a semicircle in a Nyquist plot, ask what physical process it represents and why it has that shape. When you extract a charge-transfer resistance from a fit, ask what that value implies about the kinetics at the electrode surface. When a Bode plot shows a phase angle minimum at a particular frequency, ask what that frequency tells you about the timescale of the dominant process. EIS rewards this kind of thinking. The technique's depth comes not from the measurement itself but from the physical understanding you bring to interpreting it.
The structure of this book reflects a conviction that EIS is learnable by anyone with a solid foundation in electrochemistry and a willingness to engage with both the mathematics and the physical reasoning. The technique is not inherently mysterious. Its apparent complexity dissolves when the underlying concepts are explained clearly and connected to concrete examples. That is what the chapters that follow are designed to do, one concept at a time, building toward the kind of integrated understanding that makes EIS genuinely useful in practice.
Notes
Introduction
- 1. Mark Orazem and Bernard Tribollet, Electrochemical Impedance Spectroscopy, Wiley, 2008
- 2. Alicia Calvo-Marzal and others, "Impedimetric aptasensor for label-free detection of cocaine," Chemical Communications, 2010
- 3. Florian Mansfeld, "Use of electrochemical impedance spectroscopy for the study of corrosion protection by polymer coatings," Journal of Applied Electrochemistry, 1995
This is the end of the free sample. The full book has 10 chapters.
Want this book written for you?
Tell us your goals and background, and get your own version of this book, tailored by AI to you.


Benefits of AI-tailored books
- Read one book, not ten:
- all the Electrochemistry knowledge you need, gathered into a single book.
- Save days of learning:
- tell us your goals, choose your topics, and the whole book is built around them.
- Learn effortlessly:
- Electrochemistry book written for your specific background and expertise.
- Understand at a glance:
- includes charts, tables, timelines, checklists, decision trees, and more.
- Stay current:
- written the day you order it, not years ago.
- Trust what you read:
- every book is checked for accuracy, with real research when your subject needs it.
Create your unique book in 3 steps
- 1. Select your focus
Select the focus of your Electrochemistry book and share your background
- 2. Personalize your book
Specify your goals and choose sub-topics to include
- 3. Get your tailored book
Your book is ready in 10 minutes. Read it online, download as EPUB or PDF, or send to Kindle.


Frequently asked questions
- What is TailoredRead?
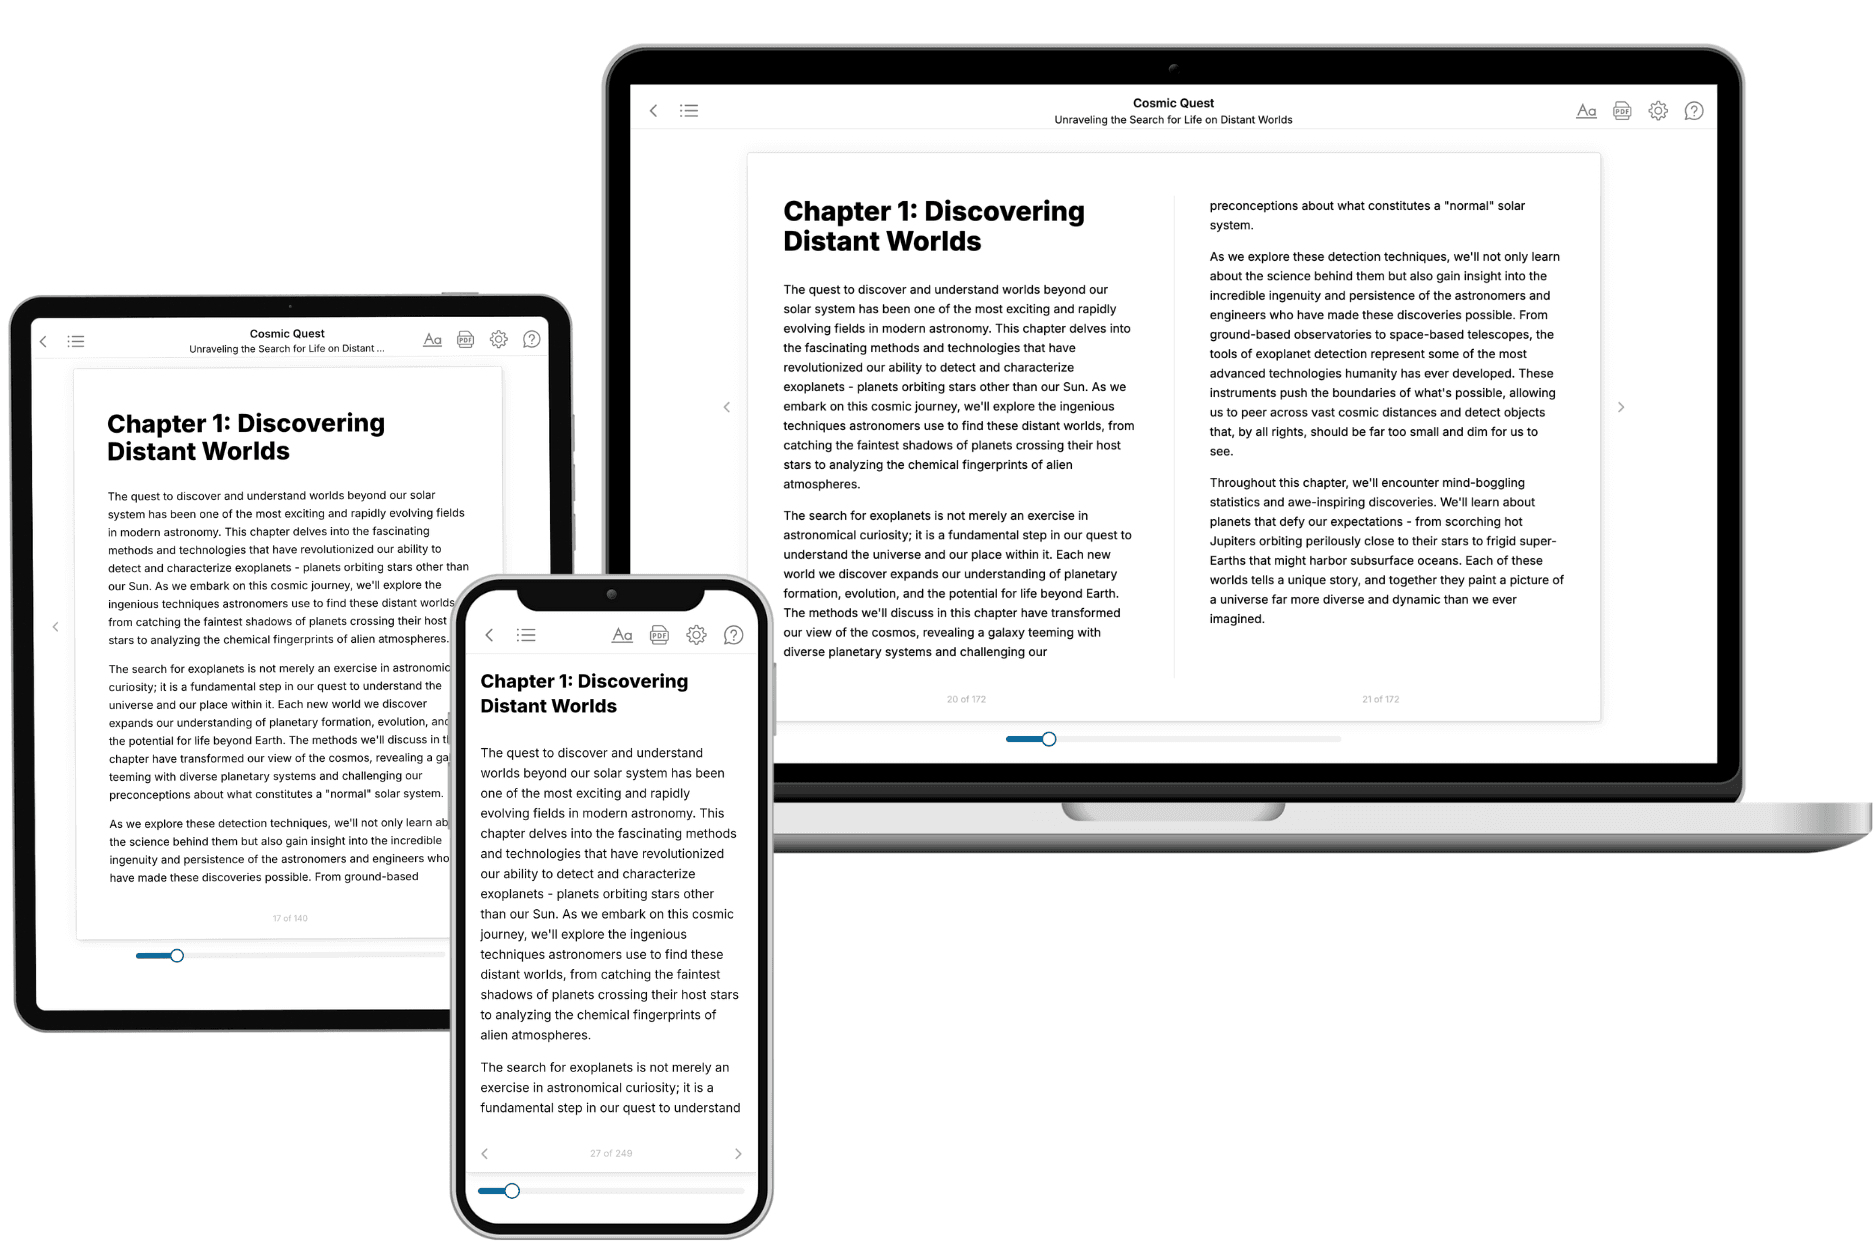
TailoredRead creates complete, full-length nonfiction ebooks, written specifically for you. Tell us what you want to learn and why, and TailoredRead writes you a complete ebook on it, with charts, tables, and diagrams throughout. Read it online, on Kindle, or on any e-reader, or download it as a PDF or EPUB. Every book is written fresh the day you order it.
- How is the book tailored to me?
Before anything is written, you answer a few short questions about your goals, your background, and the topics you care about. Your book is then planned around your answers: written at your level, focused on your goals, and covering the topics you chose, instead of the one-size-fits-all book a store sells everyone.
- Will it read like generic AI content?
No. Your book isn't a chat transcript: it's planned chapter by chapter before a single word is written, told in a clear book voice, and explains ideas visually with charts, tables, and diagrams. After writing, every book goes through an editorial pass that polishes chapters so the book reads consistent from start to finish. Judge for yourself: browse thousands of sample books on our Explore Books page.
- How accurate is the content?
Our AI first checks whether your subject needs live research. Niche and fast-moving subjects are researched before writing, and the book plan and chapters are grounded in what it finds. After writing, every book goes through a quality pass that checks its facts and consistency, and researched books list their sources in a Notes section at the back.
- How long is the book?
You choose the length: Comprehensive (250-300 pages), Detailed (150-200 pages), Essential (70-100 pages), or Short (30-50 pages).
- Does the book include visuals?
Yes. Every book includes charts, tables, and diagrams: timelines, checklists, step-by-step guides, decision trees, comparison tables, matrices, and bar charts. A typical book includes dozens of these visual elements.
- Can I read it on Kindle? What formats can I download?
Yes. Every book can be read in our online reader or downloaded as a PDF or EPUB. The EPUB can be opened with Kindle, Apple Books, Kobo, and any e-reader. The Commercial and Author licenses also include an editable Word (DOCX) and Markdown download.
- How much does it cost?
About the price of a regular ebook. The exact price depends on your book's length and complexity, from $2 for the shortest books to $35 for the most comprehensive, and it's shown when you review your book, before you commit to anything. Each book is a one-time purchase, yours to keep, no subscription. Licenses that let you share, teach, or publish your book range from $35.99 to $49.99.
- Can I preview the book before purchasing?
Before you pay, you'll see what your book will cover: the title, a detailed description, the estimated length, and the complete chapter-by-chapter table of contents, so you know what you're getting before you decide. The full text itself is written after you purchase.
- How long does it take to create a book?
About 10 minutes. You can start reading the opening chapters while the rest is still being written.