Excel Pivot Tables Mastery
Transforming Raw Data into Powerful Insights
Harness the full potential of your data with Excel Pivot Tables Mastery.
284 pages14 chaptersDec 15, 2024Data Analytics
About this book
This comprehensive guide takes you beyond basic spreadsheet functions, equipping you with the skills to effortlessly analyze complex datasets and create impactful reports. You'll learn how to structure your data effectively, design dynamic Pivot Tables, and customize your analysis to extract meaningful insights that drive decision-making. From basic concepts to advanced techniques, this book covers everything you need to know about Pivot Tables. You'll discover how to group and filter data with precision, create calculated fields for deeper analysis, and visualize your findings with eye-catching charts and graphs. With practical examples and step-by-step instructions, you'll quickly gain the confidence to tackle any data challenge. Whether you're a business analyst, manager, or data enthusiast, Excel Pivot Tables Mastery will revolutionize the way you work with data. By the end of this book, you'll be able to uncover hidden patterns, identify trends, and present your findings with clarity and impact. Get ready to become the go-to Excel expert in your organization and take your data analysis skills to new heights.
Table of contents
- IntroductionThe Power of Pivot Tables, Book Overview and How to Use It, Excel Versions and Pivot Table AvailabilityRead below
- Chapter 1: Understanding Pivot Table BasicsWhat Are Pivot Tables?, When to Use Pivot Tables, Anatomy of a Pivot Table, Data Requirements for Pivot Tables
- Chapter 2: Preparing Your Data for Pivot TablesStructuring Your Data Correctly, Cleaning and Formatting Data, Naming Ranges and Tables, Data Validation Techniques
- Chapter 3: Creating Your First Pivot TableInserting a Pivot Table, Selecting and Defining the Data Source, Understanding Pivot Table Fields, Arranging Fields in the Pivot Table
- Chapter 4: Customizing Pivot Table Layout and DesignUsing the Pivot Table Design Tab, Applying Styles and Formatting, Configuring Grand Totals and Subtotals, Adjusting Field Settings
- Chapter 5: Grouping and Sorting Data in Pivot TablesGrouping Data in Pivot Tables, Working with Date and Time Grouping, Creating Custom Groups, Sorting Options in Pivot Tables
- Chapter 6: Filtering Data in Pivot TablesUnderstanding Different Filter Types, Using Report Filters, Implementing Slicers for Interactive Filtering, Using Timelines for Date-Based Filtering
- Chapter 7: Working with Calculated Fields and ItemsIntroduction to Calculated Fields, Creating and Editing Calculated Fields, Understanding Calculated Items, Complex Calculations in Pivot Tables
- Chapter 8: Creating and Customizing Pivot ChartsIntroduction to Pivot Charts, Creating a Pivot Chart from a Pivot Table, Choosing the Right Chart Type, Formatting and Styling Pivot Charts
- Chapter 9: Advanced Pivot Table TechniquesWorking with Multiple Data Sources, Exploring PivotTable Options, Using the GETPIVOTDATA Function, Automating Pivot Tables with Macros
- Chapter 10: Data Modeling for Pivot TablesUnderstanding Relational Data Models, Creating a Data Model in Excel, Defining Relationships Between Tables, Introduction to DAX (Data Analysis Expressions)
- Chapter 11: Introduction to Power PivotPower Pivot Overview, Importing Data into Power Pivot, Creating Relationships in Power Pivot, Creating Measures in Power Pivot
- Chapter 12: Refreshing and Maintaining Pivot TablesManual Refresh Techniques, Setting Up Automatic Refresh, Changing the Data Source, Understanding and Managing the Pivot Cache
- Chapter 13: Troubleshooting Common Pivot Table IssuesUnderstanding Error Messages, Dealing with Performance Issues, Resolving Formatting Problems, Fixing Calculation Errors
- Chapter 14: Best Practices and Tips for Pivot TablesNaming Conventions and Organization, Ensuring Data Integrity, Pivot Table Design Principles, Documenting Your Pivot Tables
- ConclusionRecap of Key Concepts, Future Learning and Resources
- Glossary
- Appendix: Keyboard Shortcuts for Pivot Tables
Introduction
Welcome to the world of Excel Pivot Tables, a powerful tool that can transform the way you analyze and present data. In today's data-driven business environment, the ability to quickly extract meaningful insights from large datasets is not just a valuable skill—it's essential. Whether you're a business analyst, manager, or data enthusiast, mastering Pivot Tables will revolutionize your approach to data analysis and reporting.
This book is designed to take you on a journey from the basics of Pivot Tables to advanced techniques that will set you apart as an Excel expert. By the time you finish this guide, you'll be equipped with the knowledge and skills to tackle complex data challenges with confidence and efficiency. You'll learn how to uncover hidden patterns, identify trends, and present your findings with clarity and impact.
Throughout this book, we'll explore real-world scenarios and provide practical examples that you can apply directly to your work. Whether you're dealing with sales data, financial reports, or any other type of information, the techniques you'll learn here will be invaluable. Let's begin by diving into the power of Pivot Tables and how they can transform your data analysis capabilities.
The Power of Pivot Tables
Pivot Tables are arguably one of the most powerful features in Microsoft Excel, yet they remain underutilized by many professionals. At their core, Pivot Tables are data summarization tools that allow you to extract the significance from a large, detailed data set. They provide a way to reorganize and summarize selected columns and rows of data to obtain a desired report, without changing the original dataset.
The true power of Pivot Tables lies in their flexibility and speed. With just a few clicks, you can transform thousands of rows of data into a compact, meaningful summary. This capability is particularly crucial in today's fast-paced business environment, where quick decision-making based on data insights can provide a competitive edge. A task that might take hours to complete manually can be accomplished in minutes with a well-constructed Pivot Table.
One of the key strengths of Pivot Tables is their ability to answer multiple questions about your data simultaneously. For instance, you can quickly see sales by product, region, and time period all in one view. This multidimensional analysis capability allows you to spot trends and patterns that might otherwise remain hidden in the raw data. According to a study by IDC, companies that use data analytics tools like Pivot Tables effectively are 23 times more likely to acquire customers than their less data-savvy competitors[1].
Pivot Tables also excel in their interactivity. Once you've created a Pivot Table, you can easily modify it to view your data from different angles. This dynamic nature allows for on-the-fly data exploration, enabling you to follow your analytical instincts and dig deeper into areas of interest. For example, if you notice an unusual spike in sales for a particular product, you can quickly drill down to see which regions or sales representatives contributed to this increase.
Another powerful aspect of Pivot Tables is their ability to handle large volumes of data efficiently. While Excel has a limit of just over 1 million rows in a single worksheet, Pivot Tables can summarize millions of rows of data from multiple worksheets or even external data sources. This scalability makes Pivot Tables an essential tool for businesses dealing with ever-growing datasets.
Pivot Tables also integrate seamlessly with other Excel features, amplifying their analytical potential. For instance, you can create calculated fields within your Pivot Table to perform complex calculations across your data. You can also connect your Pivot Table to interactive charts and graphs, creating dynamic dashboards that update automatically as you filter and slice your data.
The visual presentation capabilities of Pivot Tables are another key strength. With features like conditional formatting, you can quickly highlight important data points, making it easier to spot trends or anomalies. This visual aspect is crucial for effective data communication, as it allows you to present complex data in a format that's easily digestible for stakeholders at all levels of the organization.
Furthermore, Pivot Tables serve as an excellent starting point for more advanced data analysis techniques. As you become more proficient with Pivot Tables, you'll find that they provide a natural bridge to more sophisticated tools like Power Pivot and Power BI. These advanced tools build upon the concepts you'll learn with Pivot Tables, allowing you to handle even larger datasets and perform more complex analyses.
In essence, mastering Pivot Tables is about more than just learning a new Excel feature—it's about developing a new way of thinking about and interacting with your data. As you progress through this book, you'll discover how Pivot Tables can help you ask better questions of your data, leading to more insightful analyses and better-informed decisions.
The skills you'll develop in this book will not only make you more efficient in your current role but will also open up new career opportunities. According to a recent survey by the Global Knowledge IT Skills and Salary Report, Excel skills, particularly advanced features like Pivot Tables, are among the top 10 most in-demand tech skills[2]. By mastering Pivot Tables, you're not just learning a new skill—you're investing in your professional future.
Book Overview and How to Use It
This book is structured to take you on a comprehensive journey through the world of Excel Pivot Tables. Whether you're a beginner just starting out with Pivot Tables or an intermediate user looking to enhance your skills, you'll find valuable insights and practical techniques in the following chapters. The content is designed to be both educational and immediately applicable to real-world scenarios you might encounter in your professional life.
We begin with the fundamentals, ensuring that you have a solid foundation in Pivot Table concepts. From there, we progressively move into more advanced topics, building your skills step by step. Each chapter is designed to be both self-contained and part of a larger learning journey. This means you can either work through the book from start to finish or jump to specific chapters that address your immediate needs.
Here's a brief overview of what you can expect in each chapter:
- Chapter 1: Understanding Pivot Table Basics - This chapter lays the groundwork, explaining what Pivot Tables are, when to use them, and the basic anatomy of a Pivot Table.
- Chapter 2: Preparing Your Data for Pivot Tables - Here, you'll learn the crucial steps of data preparation, including how to structure, clean, and validate your data for optimal Pivot Table performance.
- Chapter 3: Creating Your First Pivot Table - This hands-on chapter guides you through the process of creating a Pivot Table from scratch, covering data selection and field arrangement.
- Chapter 4: Customizing Pivot Table Layout and Design - Learn how to make your Pivot Tables not just functional, but visually appealing and easy to interpret.
- Chapter 5: Grouping and Sorting Data in Pivot Tables - Discover techniques for organizing your data effectively within Pivot Tables.
- Chapter 6: Filtering Data in Pivot Tables - Master the art of focusing on specific data subsets using various filtering techniques.
- Chapter 7: Working with Calculated Fields and Items - Take your analysis to the next level by creating custom calculations within your Pivot Tables.
- Chapter 8: Creating and Customizing Pivot Charts - Learn how to visually represent your Pivot Table data for impactful reporting.
- Chapter 9: Advanced Pivot Table Techniques - Explore sophisticated features like working with multiple data sources and automating Pivot Tables.
- Chapter 10: Data Modeling for Pivot Tables - Understand how to structure complex data relationships for more powerful analyses.
- Chapter 11: Introduction to Power Pivot - Get a taste of how Pivot Table concepts extend to more advanced tools in the Excel ecosystem.
- Chapter 12: Refreshing and Maintaining Pivot Tables - Learn best practices for keeping your Pivot Tables up-to-date and performing optimally.
- Chapter 13: Troubleshooting Common Pivot Table Issues - Equip yourself with strategies to overcome common challenges and errors.
- Chapter 14: Best Practices and Tips for Pivot Tables - Wrap up with a collection of expert tips to elevate your Pivot Table skills.
To get the most out of this book, it's recommended that you have Excel open as you read, allowing you to follow along with the examples and practice the techniques in real-time. Each chapter includes practical exercises and real-world scenarios to help reinforce your learning. Don't hesitate to experiment with your own data as well—applying these techniques to your specific work context will help solidify your understanding.
Throughout the book, you'll find callout boxes with tips, warnings, and additional insights. Pay special attention to these as they often contain valuable nuggets of information that can significantly enhance your Pivot Table skills. Additionally, each chapter concludes with a summary of key points and a set of practice exercises. Taking the time to review these and complete the exercises will greatly reinforce your learning.
Remember, mastering Pivot Tables is not just about memorizing steps—it's about developing a data-driven mindset. As you work through this book, try to think about how each technique could be applied to your own work. Consider the types of questions you could answer with your data using these tools. This approach will not only make the learning process more engaging but will also help you derive immediate value from your new skills.
Don't be discouraged if some concepts seem challenging at first. Pivot Tables are a powerful tool with many facets, and it's normal for some aspects to take time to fully grasp. The key is consistent practice. Try to apply what you learn in each chapter to your own data or work projects. This practical application will help solidify your understanding and reveal areas where you might need more practice.
Finally, while this book provides a comprehensive guide to Pivot Tables, remember that Excel is constantly evolving. Microsoft regularly updates Excel with new features and improvements. As such, consider this book a foundation upon which you can continue to build your Excel expertise. Stay curious, keep experimenting with your data, and don't hesitate to explore additional resources as you continue your journey to becoming a Pivot Table master.
Excel Versions and Pivot Table Availability
Before we dive deeper into the world of Pivot Tables, it's important to understand the landscape of Excel versions and how they relate to Pivot Table functionality. Microsoft Excel has evolved significantly over the years, with each new version bringing enhancements to Pivot Tables. While the core functionality of Pivot Tables has remained consistent, newer versions have introduced features that make data analysis more powerful and user-friendly.
Pivot Tables have been a part of Excel since Excel 5.0, which was released in 1993. However, the Pivot Tables we know and use today started taking shape with Excel 97. Since then, each new version of Excel has brought improvements and new features to Pivot Tables. Let's take a brief look at how Pivot Tables have evolved across major Excel versions:
- Excel 2003 and earlier: These versions included basic Pivot Table functionality. While they could handle data summarization and some basic calculations, they lacked many of the advanced features and user-friendly interfaces of later versions.
- Excel 2007: This version introduced a significant overhaul of the Excel interface, including the Ribbon. For Pivot Tables, it brought improved performance, the ability to handle larger datasets, and a more intuitive interface for creating and modifying Pivot Tables.
- Excel 2010: This version introduced Slicers, a game-changing feature for Pivot Tables that allowed for more interactive filtering. It also improved the overall performance and added new calculation options.
- Excel 2013: This version introduced the Data Model, which allowed for relationships between tables, significantly enhancing the power of Pivot Tables. It also introduced Timelines for easier date-based filtering.
- Excel 2016: This version brought further improvements to the Data Model and introduced new chart types that work well with Pivot Tables, such as Treemap and Sunburst charts.
- Excel 2019 and Microsoft 365: These latest versions have continued to refine Pivot Table functionality, with improvements in areas like data refresh performance, new data source connections, and enhanced integration with Power BI.
It's worth noting that while this book will cover features available in the latest versions of Excel, many of the core concepts and techniques are applicable across versions. However, if you're using an older version of Excel, you may find that some advanced features discussed in later chapters are not available to you.
For the best experience with Pivot Tables, it's recommended to use Excel 2016 or later, preferably Microsoft 365, which receives regular updates and new features. If you're using an older version, you may want to consider upgrading to access the full range of Pivot Table capabilities. According to a survey by Spiceworks, as of 2021, about 79% of organizations are using Office 365, which includes the latest version of Excel[3].
It's also important to note that Pivot Table functionality can vary between the desktop and online versions of Excel. While Microsoft has made significant strides in bringing Pivot Table features to Excel Online, the desktop version still offers the most comprehensive set of tools for advanced Pivot Table work. If you're primarily using Excel Online, you may find some limitations when trying to implement more complex Pivot Table techniques.
Another consideration is the difference between Windows and Mac versions of Excel. While Microsoft has worked to bring feature parity between these versions, there can still be some differences, particularly with newer features. If you're using Excel on a Mac, you may find that some advanced Pivot Table features are not available or work slightly differently compared to the Windows version.
For those working in corporate environments, it's worth checking with your IT department about which version of Excel is standard in your organization. Some companies may use older versions due to compatibility requirements with other systems or software. Understanding the version you're working with will help you set realistic expectations about the Pivot Table features available to you.
Regardless of the version you're using, the fundamental principles of Pivot Tables remain the same. The skills you'll learn in this book will be valuable across versions, even if some specific features may not be available in older editions. As you progress through the book, we'll make note of any features that are version-specific, allowing you to adapt the techniques to your particular Excel environment.
Remember, while having the latest version of Excel can provide access to the most advanced features, the real power of Pivot Tables lies in how you use them to analyze and present your data. Even with an older version, a well-constructed Pivot Table can provide valuable insights and significantly improve your data analysis capabilities.
As we move forward, keep in mind that the Excel landscape is continually evolving. Microsoft regularly updates Excel, particularly for Microsoft 365 subscribers, often introducing new features that enhance Pivot Table functionality. Staying informed about these updates can help you continually improve your Pivot Table skills and take advantage of new capabilities as they become available.
Notes
Introduction
This is the end of the free sample. The full book has 14 chapters.
Want this book written for you?
Tell us your goals and background, and get your own version of this book, tailored by AI to you.


Benefits of AI-tailored books
- Read one book, not ten:
- all the Data Analytics knowledge you need, gathered into a single book.
- Save days of learning:
- tell us your goals, choose your topics, and the whole book is built around them.
- Learn effortlessly:
- Data Analytics book written for your specific background and expertise.
- Understand at a glance:
- includes charts, tables, timelines, checklists, decision trees, and more.
- Stay current:
- written the day you order it, not years ago.
- Trust what you read:
- every book is checked for accuracy, with real research when your subject needs it.
Create your unique book in 3 steps
- 1. Select your focus
Select the focus of your Data Analytics book and share your background
- 2. Personalize your book
Specify your goals and choose sub-topics to include
- 3. Get your tailored book
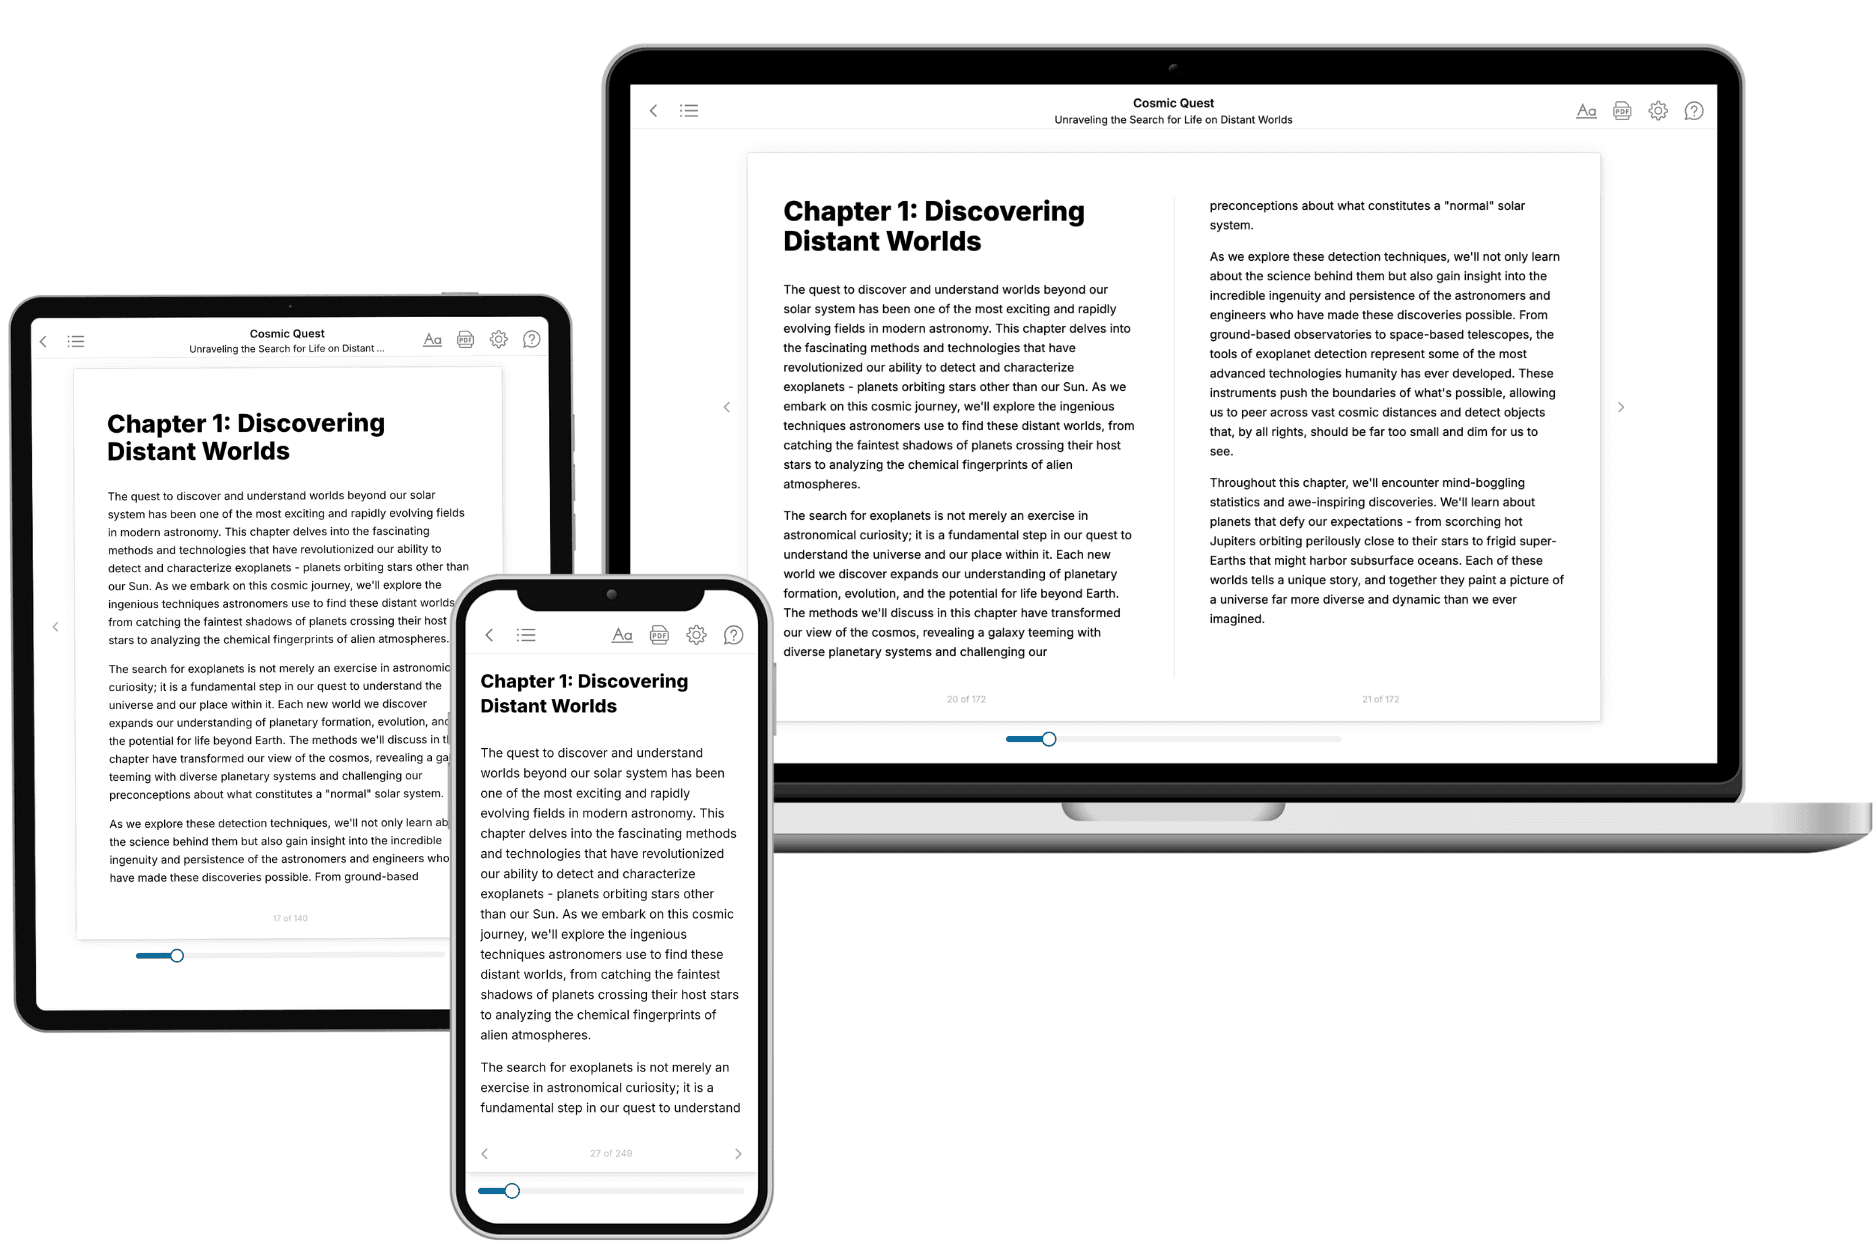
Your book is ready in 10 minutes. Read it online, download as EPUB or PDF, or send to Kindle.
Frequently asked questions
- What is TailoredRead?
TailoredRead creates complete, full-length nonfiction ebooks, written specifically for you. Tell us what you want to learn and why, and TailoredRead writes you a complete ebook on it, with charts, tables, and diagrams throughout. Read it online, on Kindle, or on any e-reader, or download it as a PDF or EPUB. Every book is written fresh the day you order it.
- How is the book tailored to me?
Before anything is written, you answer a few short questions about your goals, your background, and the topics you care about. Your book is then planned around your answers: written at your level, focused on your goals, and covering the topics you chose, instead of the one-size-fits-all book a store sells everyone.
- Will it read like generic AI content?
No. Your book isn't a chat transcript: it's planned chapter by chapter before a single word is written, told in a clear book voice, and explains ideas visually with charts, tables, and diagrams. After writing, every book goes through an editorial pass that polishes chapters so the book reads consistent from start to finish. Judge for yourself: browse thousands of sample books on our Explore Books page.
- How accurate is the content?
Our AI first checks whether your subject needs live research. Niche and fast-moving subjects are researched before writing, and the book plan and chapters are grounded in what it finds. After writing, every book goes through a quality pass that checks its facts and consistency, and researched books list their sources in a Notes section at the back.
- How long is the book?
You choose the length: Comprehensive (250-300 pages), Detailed (150-200 pages), Essential (70-100 pages), or Short (30-50 pages).
- Does the book include visuals?
Yes. Every book includes charts, tables, and diagrams: timelines, checklists, step-by-step guides, decision trees, comparison tables, matrices, and bar charts. A typical book includes dozens of these visual elements.
- Can I read it on Kindle? What formats can I download?
Yes. Every book can be read in our online reader or downloaded as a PDF or EPUB. The EPUB can be opened with Kindle, Apple Books, Kobo, and any e-reader. The Commercial and Author licenses also include an editable Word (DOCX) and Markdown download.
- How much does it cost?
About the price of a regular ebook. The exact price depends on your book's length and complexity, from $2 for the shortest books to $35 for the most comprehensive, and it's shown when you review your book, before you commit to anything. Each book is a one-time purchase, yours to keep, no subscription. Licenses that let you share, teach, or publish your book range from $35.99 to $49.99.
- Can I preview the book before purchasing?
Before you pay, you'll see what your book will cover: the title, a detailed description, the estimated length, and the complete chapter-by-chapter table of contents, so you know what you're getting before you decide. The full text itself is written after you purchase.
- How long does it take to create a book?
About 10 minutes. You can start reading the opening chapters while the rest is still being written.