Flood Risk Mapping
A Practical Guide to Understanding, Creating, and Using Flood Hazard Maps
Imagine having the clarity to make confident decisions about development, infrastructure, and community safety—decisions backed by precise understanding of where and when flooding will occur.
238 pages11 chaptersMay 2, 2026Hydrology
About this book
Flood risk mapping provides exactly that foundation. This guide walks you through the complete landscape of flood hazard assessment, from the scientific principles that drive water movement to the practical tools that transform raw data into actionable maps. You'll discover how hydrological models work, what satellite and LiDAR data reveal about terrain, and how to interpret the uncertainties embedded in every map. Whether you're evaluating a development site, planning emergency response, or communicating flood risks to stakeholders, this book equips you with both the conceptual knowledge and practical skills to navigate flood risk mapping with confidence. Learn the methods professionals use, understand the limitations you need to watch for, and master the art of translating complex spatial data into decisions that protect communities and guide smart development.
Table of contents
- IntroductionWhy Flood Risk Mapping Matters, What You'll Learn in This Book, How to Use This GuideRead below
- Chapter 1: Flood Risk FundamentalsTypes of Floods and Their Characteristics, Understanding Risk, Hazard, and Vulnerability, Flood Probability and Return Periods
- Chapter 2: Hydrological Science Behind FloodingThe Water Cycle and Runoff Generation, Watershed Characteristics and Flow Behavior, Rainfall-Runoff Relationships and Peak Flows
- Chapter 3: Data Sources and Collection MethodsLiDAR and High-Resolution Elevation Data, Satellite Imagery and Remote Sensing, Field Surveys and Ground-Truth Data, Historical Flood Records and Gauge Data
- Chapter 4: Hydrological and Hydraulic ModelingTypes of Hydrological Models, Hydraulic Simulation and Water Surface Elevation, Model Calibration and Validation
- Chapter 5: Creating Flood Risk MapsGIS Fundamentals for Flood Mapping, From Model Output to Visual Maps, Defining and Delineating Hazard Zones
- Chapter 6: Interpreting Flood Risk MapsUnderstanding Map Elements and Symbols, Recognizing Uncertainty and Limitations, Comparing Different Flood Maps and Scenarios
- Chapter 7: Applications in Planning and DevelopmentLand-Use Planning and Zoning Decisions, Infrastructure Design and Resilience, Insurance and Risk Assessment
- Chapter 8: Emergency Management and ResponseEvacuation Planning and Resource Allocation, Early Warning Systems and Preparedness, Post-Flood Recovery and Resilience Building
- Chapter 9: Climate Change and Evolving Flood PatternsHow Climate Change Affects Flood Risk, Projecting Future Flood Scenarios, Adaptive Mapping and Regular Updates
- Chapter 10: Communicating Flood Risk to StakeholdersTailoring Messages for Different Audiences, Effective Visualization and Map Design, Building Community Understanding and Engagement
- Chapter 11: Real-World Case StudiesUrban Flood Mapping Challenges, Coastal and Storm Surge Mapping, Lessons from Successful Mapping Programs
- ConclusionKey Takeaways and Next Steps, The Future of Flood Risk Mapping
- Glossary of Terms
- Further Reading and Resources
Introduction
Every year, flooding causes more economic damage than any other natural disaster on Earth. In the United States alone, floods account for roughly $17 billion in annual losses and are responsible for more deaths than tornadoes, hurricanes, or lightning strikes.[1] Globally, the numbers are even more staggering. The 2021 floods in Western Europe killed over 200 people and caused an estimated €46 billion in damages across Germany, Belgium, and the Netherlands. These were not random catastrophes. Many of the affected areas had known flood exposure, but the maps, plans, and decisions that should have protected communities had not kept pace with changing conditions.
Flood risk mapping sits at the intersection of science, policy, and public safety. It is the discipline that transforms raw hydrological data into spatial information that planners, engineers, emergency managers, and communities can actually use. A well-constructed flood map tells you not just where water has gone before, but where it is likely to go in the future, how deep it might get, how fast it might move, and how often you can expect it to happen. That kind of information is the foundation for almost every serious decision about land use, infrastructure investment, insurance pricing, and emergency preparedness.
Despite its importance, flood risk mapping is often misunderstood, misapplied, or simply underused. Maps get treated as fixed truths rather than probabilistic estimates. Outdated maps guide billion-dollar development decisions. Communities assume that being outside a mapped flood zone means being safe, when in reality it means being in a lower-probability zone that still carries real risk. This guide exists to close that gap. It is written for professionals who work with flood data and spatial information and who need a clear, practical, and technically grounded understanding of how flood maps are built, what they mean, and how to use them well.
Whether you are an urban planner reviewing a development application, a GIS specialist building a hazard layer, an environmental consultant assessing site risk, or an emergency manager designing an evacuation plan, this book is structured to meet you where you are. It does not assume you are a hydrologist, but it does assume you are comfortable with spatial data, technical concepts, and the kind of analytical thinking that comes with working in earth sciences or planning. The goal is to give you both the conceptual depth and the practical tools to work confidently with flood risk information at every stage of the process.
Why Flood Risk Mapping Matters
Flood risk mapping is not an academic exercise. It is a decision-support tool with direct consequences for how communities are built, how infrastructure is designed, and how people survive disasters. When a city approves a new residential development, the flood map determines whether that approval comes with conditions, restrictions, or outright denial. When an insurer prices a flood policy, the map defines the risk category. When an emergency manager decides where to pre-position rescue equipment, the map shapes that choice. The quality of those decisions depends entirely on the quality of the maps behind them.
Consider what happened in Houston during Hurricane Harvey in 2017. Approximately one-third of the flooded structures were located outside the official 100-year floodplain boundary.[2] Homeowners in those areas had no flood insurance requirement, many had no flood insurance at all, and many had no reason to believe they were at serious risk. The maps were not wrong in a technical sense; they reflected the best available data at the time. But they were outdated, they did not account for the scale of upstream development that had increased runoff, and they communicated a false sense of safety to people living just outside the boundary line.
This example illustrates a core tension in flood risk mapping: the difference between what a map shows and what the actual risk is. Maps are models of reality, not reality itself. They are built on assumptions, calibrated against historical data, and bounded by the resolution of the inputs used to create them. Understanding that gap is not a reason to distrust maps. It is a reason to use them more carefully, to know their limitations, and to supplement them with professional judgment and updated information.
The stakes are rising. Climate change is intensifying rainfall events, accelerating sea-level rise, and shifting the statistical patterns that flood frequency analysis has historically relied on. Urbanization is increasing impervious surface cover, reducing infiltration, and pushing more runoff into drainage systems faster than they were designed to handle. Both forces are making yesterday's flood maps less reliable for tomorrow's decisions. The profession of flood risk mapping is adapting, but the pace of adaptation needs to match the pace of change.
There is also a social dimension to flood risk mapping that deserves attention. Flood risk is not distributed equally. Lower-income communities and communities of color are disproportionately located in high-risk areas, often because of historical land-use patterns and discriminatory housing policies that pushed vulnerable populations toward cheaper, flood-prone land.[3] Flood maps that are inaccurate, outdated, or poorly communicated can deepen those inequities by leaving the most vulnerable communities without the information they need to advocate for protection or make informed decisions about where to live and invest.
Effective flood risk mapping, done well and communicated clearly, is one of the most powerful tools available for building community resilience. It enables proactive investment in flood defenses, guides smart land-use decisions that keep people out of harm's way, and provides the evidence base for emergency plans that save lives. That is why this work matters, and that is why getting it right is worth the effort this guide asks of you.
The field has also evolved dramatically in the past two decades. The combination of high-resolution LiDAR elevation data, satellite remote sensing, advanced hydraulic modeling software, and cloud-based GIS platforms has transformed what is technically possible. Flood maps that once took years to produce can now be generated in weeks. Scenarios that were computationally prohibitive can now be run on standard workstations. The challenge today is less about what is technically possible and more about how to apply these tools rigorously, interpret their outputs honestly, and communicate their results effectively.
A practical note on terminology: Throughout this book, the terms flood hazard map and flood risk map are used with specific meanings. A hazard map shows the physical extent and characteristics of flooding for a given scenario. A risk map incorporates exposure and vulnerability to show the potential consequences of that flooding. In practice, many documents use these terms interchangeably, but the distinction matters when you are deciding what kind of analysis a situation requires.
What You'll Learn in This Book
This book is organized to take you through the full lifecycle of flood risk mapping, from the scientific foundations that explain why floods happen the way they do, through the data collection and modeling processes that produce flood maps, to the practical applications that put those maps to work. Each chapter builds on the previous ones, but the structure also allows you to navigate directly to the topics most relevant to your current work.
The early chapters establish the scientific and conceptual foundation. You will learn how different types of floods behave, why the distinction between hazard, risk, and vulnerability matters for mapping decisions, and how flood probability and return periods are calculated and interpreted. These concepts underpin everything else in the book, and a clear grasp of them will make the more technical chapters significantly easier to follow.
The middle section of the book covers the technical core of flood mapping. Specifically, you will work through:
- Hydrological science: How the water cycle generates runoff, how watershed characteristics shape flood behavior, and how rainfall-runoff relationships are used to estimate peak flows
- Data sources: What LiDAR elevation data reveals about terrain, how satellite imagery supports flood mapping, what field surveys contribute, and how historical gauge records inform frequency analysis
- Modeling: The main types of hydrological and hydraulic models, how they simulate water movement, and how calibration and validation determine whether a model is fit for purpose
- Map production: How GIS tools are used to translate model outputs into visual maps, how hazard zones are defined and delineated, and what decisions go into the cartographic choices that shape how a map communicates
The later chapters shift from production to application. You will explore how flood maps are used in land-use planning and zoning, infrastructure design, insurance assessment, emergency management, and post-flood recovery. A dedicated chapter on climate change examines how shifting precipitation patterns and sea-level rise are altering flood risk and what that means for mapping practice. The chapter on communication addresses one of the most underappreciated skills in the field: translating technical maps into information that non-specialist audiences can understand and act on.
The book closes with real-world case studies drawn from urban and coastal flood mapping programs. These case studies are not just illustrative. They are analytical, examining what worked, what did not, and what lessons can be carried forward into your own practice. The goal is to connect the technical content of earlier chapters to the messy, constraint-filled reality of actual mapping projects.
By the time you finish this book, you should be able to:
- Explain the scientific principles behind flood generation and frequency analysis
- Evaluate the quality and limitations of different data sources used in flood mapping
- Understand how hydrological and hydraulic models work and what their outputs mean
- Produce or critically review flood hazard maps using GIS tools
- Interpret flood maps accurately, including their embedded uncertainties
- Apply flood maps appropriately in planning, infrastructure, insurance, and emergency management contexts
- Communicate flood risk clearly and honestly to a range of audiences
- Adapt flood mapping approaches to account for climate change and evolving conditions
These are not abstract learning objectives. They are the practical competencies that distinguish professionals who use flood maps confidently from those who use them cautiously or incorrectly. Each chapter is designed to build one or more of these competencies through a combination of conceptual explanation, worked examples, and practical guidance.
One thing this book does not do is serve as a software manual. Tools like HEC-RAS, MIKE FLOOD, ArcGIS, and QGIS are referenced throughout, and their general capabilities are explained, but step-by-step software tutorials are beyond the scope of a guide focused on principles and practice. The goal is to give you the conceptual foundation to use any of these tools effectively, not to walk you through a specific version of a specific interface that will change with the next software update.
The book also does not pretend that flood mapping is a solved problem. Throughout the chapters, you will encounter honest discussions of uncertainty, data gaps, model limitations, and the ways that political and institutional pressures can distort technical outputs. Acknowledging these challenges is not pessimism. It is the kind of professional honesty that leads to better maps and better decisions.
How to Use This Guide
This guide is designed to be useful in multiple ways depending on your role, your current knowledge level, and the specific challenge you are working on. If you are new to flood risk mapping but experienced in GIS or environmental science, reading the book from front to back will give you the most coherent learning experience. The chapters are sequenced so that each one builds on concepts introduced earlier, and the progression from science to data to modeling to application mirrors the actual workflow of a flood mapping project.
If you are already working in flood risk assessment and need to deepen your knowledge in a specific area, the chapter structure supports targeted reading. Each chapter is self-contained enough to be read independently, with cross-references pointing you to related content elsewhere in the book when needed. For example, if your immediate need is to improve how you communicate flood maps to community stakeholders, you can go directly to Chapter 10 on communication without reading every preceding chapter first. The concepts will make more sense with the earlier context, but the chapter is written to be accessible on its own.
For professionals who use flood maps without producing them, such as planners reviewing development applications or emergency managers building response plans, the most immediately relevant chapters are likely:
- Chapter 1 (Flood Risk Fundamentals) for the conceptual vocabulary
- Chapter 6 (Interpreting Flood Risk Maps) for understanding what maps actually show and where they can mislead
- Chapter 7 (Applications in Planning and Development) for direct guidance on using maps in your specific context
- Chapter 8 (Emergency Management and Response) for operational applications
- Chapter 10 (Communicating Flood Risk) for stakeholder engagement
For GIS specialists and technical practitioners who are building or updating flood maps, the core technical chapters are Chapters 2 through 5, which cover the science, data, modeling, and production workflow in detail. Chapter 9 on climate change is also essential reading for anyone producing maps that will be used for long-term planning, since it addresses how to incorporate future scenarios into current mapping practice.
Throughout the book, you will find several recurring features designed to make the content more practical and easier to apply. Key concept boxes summarize the most important ideas in each section. Worked examples walk through specific calculations, decisions, or analyses using realistic scenarios. Common pitfalls highlight the mistakes that practitioners most frequently make and explain how to avoid them. These features are not decorative. They are the parts of the book most likely to change how you work.
The glossary at the back of the book defines all technical terms used throughout the text. Flood risk mapping draws on hydrology, hydraulics, statistics, GIS, and planning, and each of those fields has its own vocabulary. When a term appears in the text that might be unfamiliar, it is defined in context the first time it appears and listed in the glossary for easy reference later. The further reading section points you toward the primary literature, technical standards, and professional resources that go deeper on specific topics.
A note on the examples and case studies used throughout the book: they are drawn from real projects and real events, but they are presented analytically rather than as endorsements of any particular approach or organization. Flood mapping practice varies significantly between countries, regulatory frameworks, and institutional contexts. The examples are chosen to illustrate principles that transfer across those contexts, not to suggest that one national approach or one software platform is definitively superior to others.
Finally, it is worth being direct about what this guide asks of you. Flood risk mapping is a technically demanding field, and this book does not simplify it beyond recognition in the name of accessibility. The goal is clarity, not superficiality. Some chapters require careful reading and may benefit from being revisited after you have had a chance to apply the concepts in practice. The investment is worth it. The professionals who understand flood risk mapping deeply, who can read a map critically, build one rigorously, and explain it honestly, are the ones who make the decisions that protect communities and guide smart development. That is the standard this book is written to help you reach.
Notes
Introduction
- 1. National Oceanic and Atmospheric Administration (NOAA), "'Flood Losses," ' National Weather Service, 2023
- 2. R. Blessing and others, "Flood Risk Delineation in the United States," Natural Hazards Review, 2017
- 3. J. M. Keenan and others, "Climate Gentrification," Environmental Research Letters, 2018
This is the end of the free sample. The full book has 11 chapters.
Want this book written for you?
Tell us your goals and background, and get your own version of this book, tailored by AI to you.


Benefits of AI-tailored books
- Read one book, not ten:
- all the Hydrology knowledge you need, gathered into a single book.
- Save days of learning:
- tell us your goals, choose your topics, and the whole book is built around them.
- Learn effortlessly:
- Hydrology book written for your specific background and expertise.
- Understand at a glance:
- includes charts, tables, timelines, checklists, decision trees, and more.
- Stay current:
- written the day you order it, not years ago.
- Trust what you read:
- every book is checked for accuracy, with real research when your subject needs it.
Create your unique book in 3 steps
- 1. Select your focus
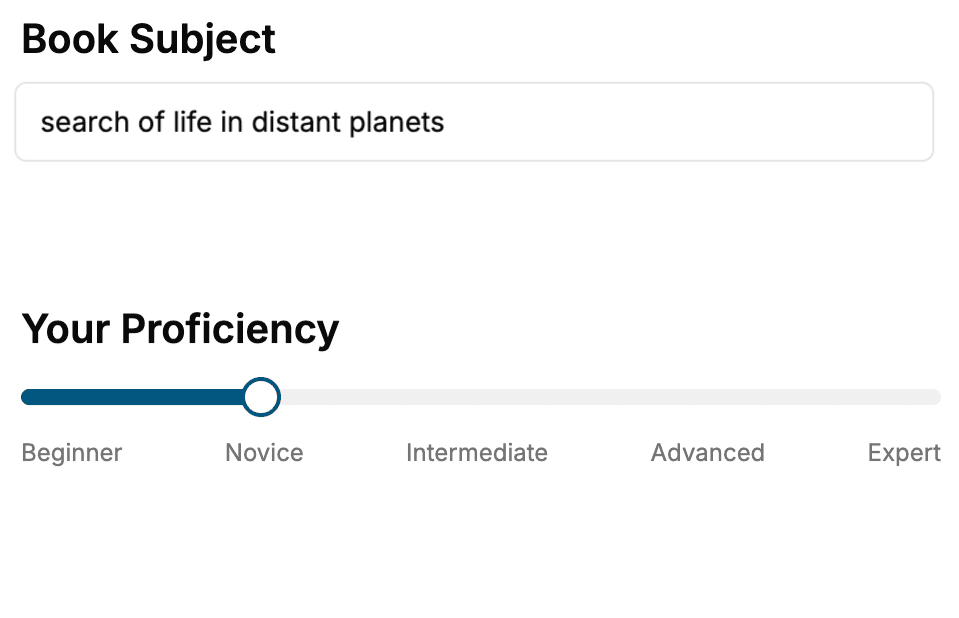
Select the focus of your Hydrology book and share your background
- 2. Personalize your book
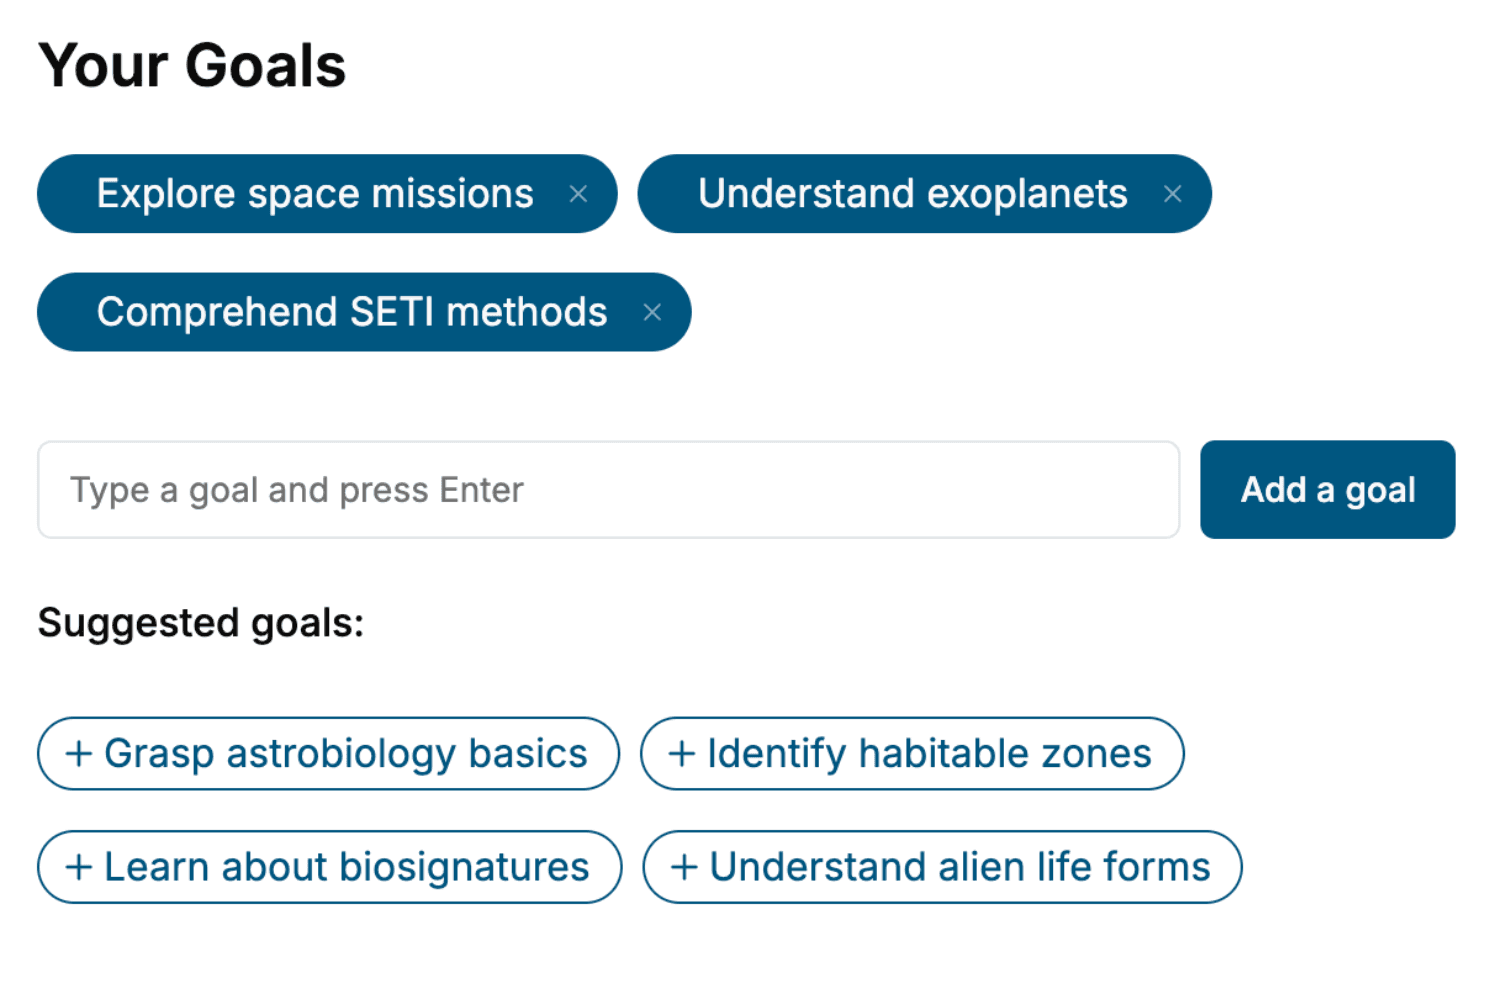
Specify your goals and choose sub-topics to include
- 3. Get your tailored book
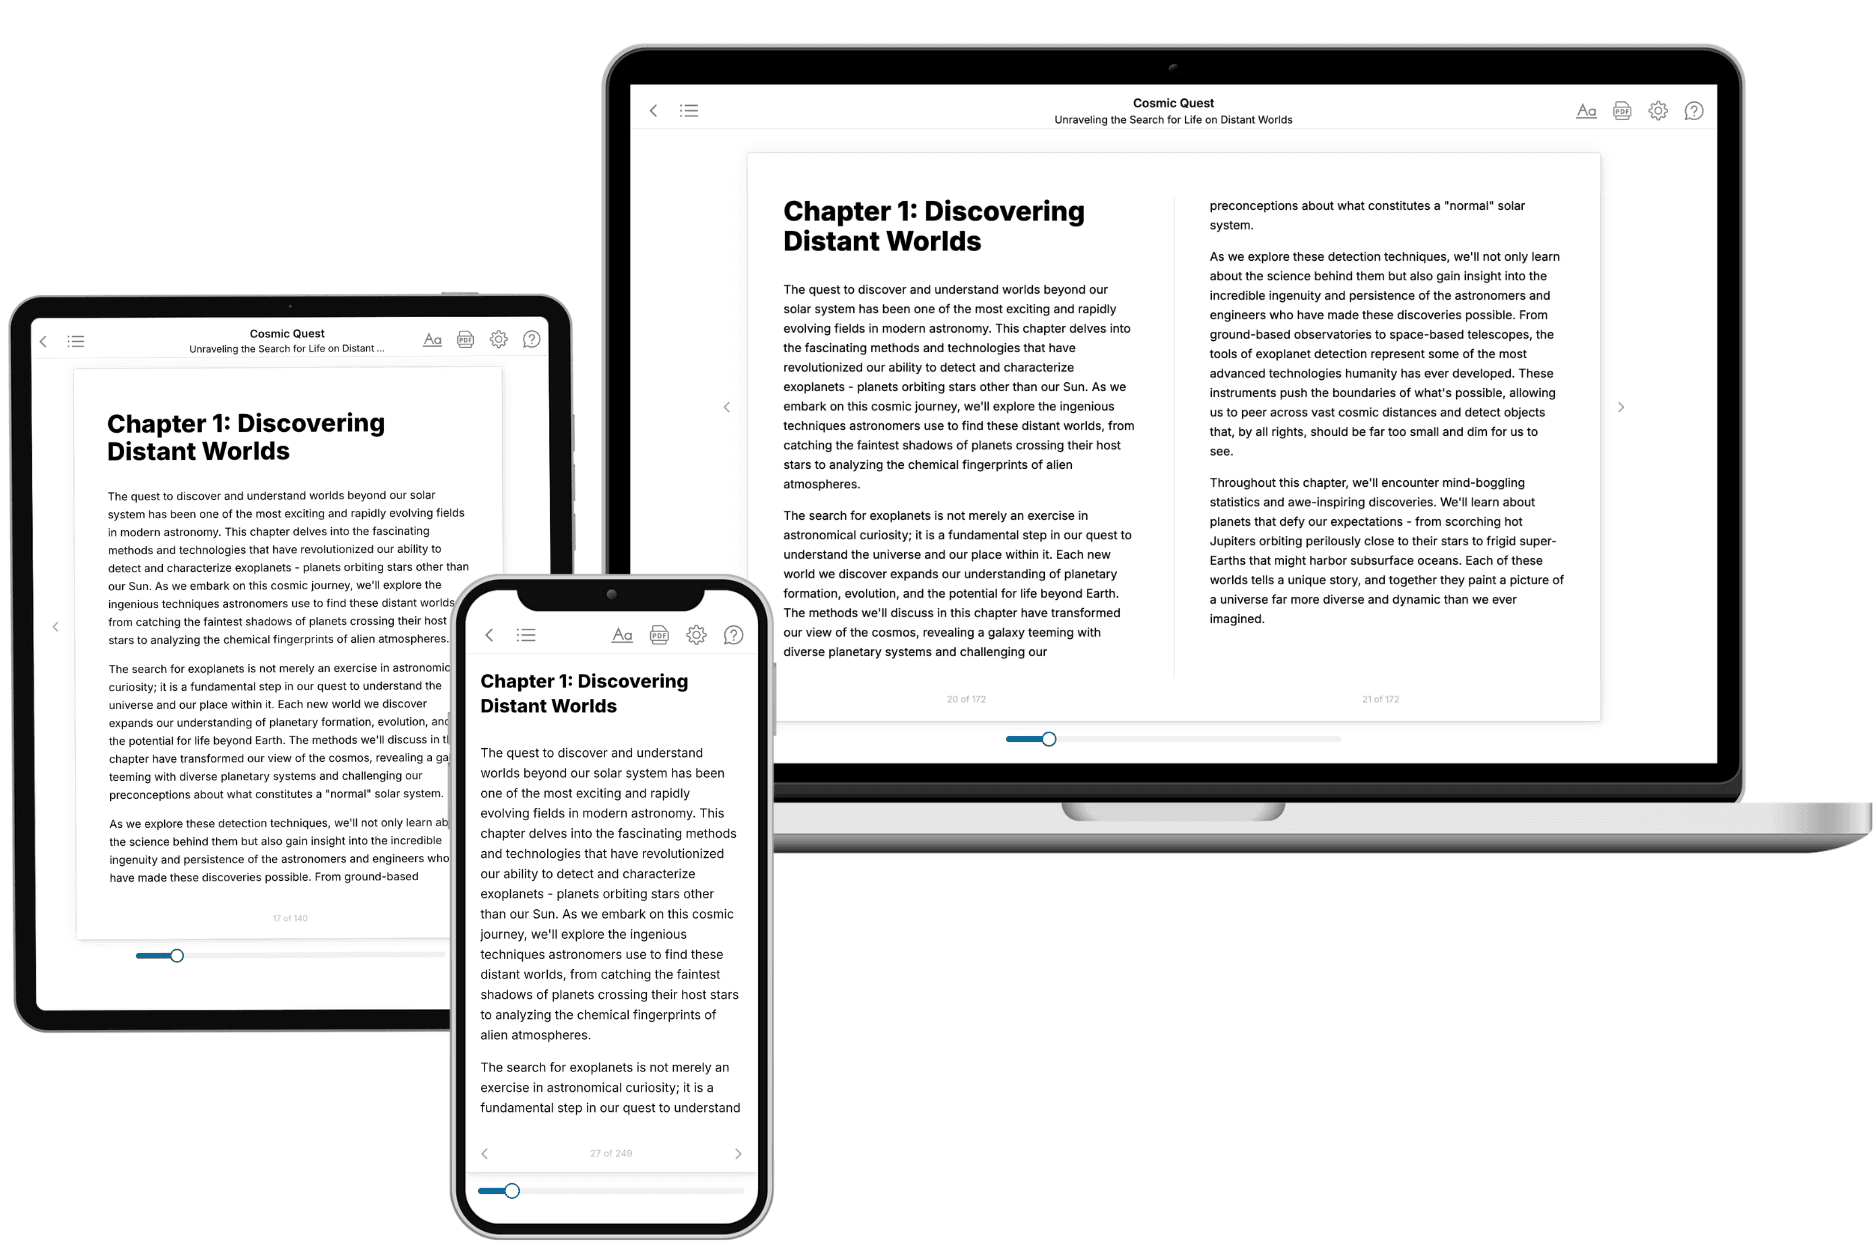
Your book is ready in 10 minutes. Read it online, download as EPUB or PDF, or send to Kindle.
Frequently asked questions
- What is TailoredRead?
TailoredRead creates complete, full-length nonfiction ebooks, written specifically for you. Tell us what you want to learn and why, and TailoredRead writes you a complete ebook on it, with charts, tables, and diagrams throughout. Read it online, on Kindle, or on any e-reader, or download it as a PDF or EPUB. Every book is written fresh the day you order it.
- How is the book tailored to me?
Before anything is written, you answer a few short questions about your goals, your background, and the topics you care about. Your book is then planned around your answers: written at your level, focused on your goals, and covering the topics you chose, instead of the one-size-fits-all book a store sells everyone.
- Will it read like generic AI content?
No. Your book isn't a chat transcript: it's planned chapter by chapter before a single word is written, told in a clear book voice, and explains ideas visually with charts, tables, and diagrams. After writing, every book goes through an editorial pass that polishes chapters so the book reads consistent from start to finish. Judge for yourself: browse thousands of sample books on our Explore Books page.
- How accurate is the content?
Our AI first checks whether your subject needs live research. Niche and fast-moving subjects are researched before writing, and the book plan and chapters are grounded in what it finds. After writing, every book goes through a quality pass that checks its facts and consistency, and researched books list their sources in a Notes section at the back.
- How long is the book?
You choose the length: Comprehensive (250-300 pages), Detailed (150-200 pages), Essential (70-100 pages), or Short (30-50 pages).
- Does the book include visuals?
Yes. Every book includes charts, tables, and diagrams: timelines, checklists, step-by-step guides, decision trees, comparison tables, matrices, and bar charts. A typical book includes dozens of these visual elements.
- Can I read it on Kindle? What formats can I download?
Yes. Every book can be read in our online reader or downloaded as a PDF or EPUB. The EPUB can be opened with Kindle, Apple Books, Kobo, and any e-reader. The Commercial and Author licenses also include an editable Word (DOCX) and Markdown download.
- How much does it cost?
About the price of a regular ebook. The exact price depends on your book's length and complexity, from $2 for the shortest books to $35 for the most comprehensive, and it's shown when you review your book, before you commit to anything. Each book is a one-time purchase, yours to keep, no subscription. Licenses that let you share, teach, or publish your book range from $35.99 to $49.99.
- Can I preview the book before purchasing?
Before you pay, you'll see what your book will cover: the title, a detailed description, the estimated length, and the complete chapter-by-chapter table of contents, so you know what you're getting before you decide. The full text itself is written after you purchase.
- How long does it take to create a book?
About 10 minutes. You can start reading the opening chapters while the rest is still being written.