Fourier Transform Infrared Spectroscopy
A Practical Guide to FTIR Analysis and Measurement Techniques
Many scientists and engineers struggle with FTIR spectroscopy because they lack a clear understanding of how the instrument actually works and how to extract meaningful data from complex spectra.
191 pages8 chaptersAug 22, 2026Spectroscopy
About this book
This practical guide bridges that gap by demystifying Fourier Transform Infrared Spectroscopy and showing you exactly how to use it effectively. You'll learn the fundamental physics behind infrared absorption, master the optical and electronic components that make FTIR possible, and discover proven techniques for sample preparation and measurement. The book walks you through spectral interpretation, from identifying functional groups to quantifying unknown compounds. You'll also explore real-world applications across chemistry, materials science, and quality control, while learning how to troubleshoot common problems and optimize your results. Whether you're analyzing polymers, pharmaceuticals, or environmental samples, this guide provides the knowledge and confidence you need to design better experiments and make more accurate measurements.
Table of contents
- IntroductionWhy FTIR Matters in Modern Science, What You'll Learn in This Guide, How to Use This Book EffectivelyRead below
- Chapter 1: Fundamentals of Infrared SpectroscopyUnderstanding Infrared Light and the Electromagnetic Spectrum, How Molecules Vibrate and Absorb Infrared Radiation, The Beer-Lambert Law and Absorption Principles
- Chapter 2: The Fourier Transform and InterferometryFrom Interferogram to Spectrum: The Michelson Interferometer, Understanding the Fourier Transform Mathematics, Why FTIR Outperforms Dispersive Infrared Spectroscopy, Signal-to-Noise Ratio and Data Quality
- Chapter 3: FTIR Instrumentation and ComponentsInfrared Light Sources and Their Characteristics, Beam Splitters, Mirrors, and Optical Alignment, Detectors and Electronic Signal Processing, Sample Compartments and Environmental Control
- Chapter 4: Sample Preparation and HandlingChoosing the Right Sampling Technique for Your Material, Preparing Solid Samples: KBr Pellets, ATR, and Diffuse Reflectance, Analyzing Liquid Samples and Solutions, Measuring Gases and Vapors
- Chapter 5: Reading and Interpreting FTIR SpectraIdentifying Functional Groups and Characteristic Frequencies, Analyzing Peak Position, Intensity, and Shape, Baseline Correction and Spectral Processing, Recognizing Artifacts, Noise, and Common Errors
- Chapter 6: Quantitative Analysis and CalibrationBuilding Calibration Curves and Standards, Introduction to Chemometric Methods and Multivariate Analysis, Ensuring Accuracy, Precision, and Reproducibility
- Chapter 7: Real-World FTIR ApplicationsMaterials Science: Polymers, Composites, and Coatings, Pharmaceutical and Chemical Analysis, Environmental and Quality Control Applications, Specialized Techniques: Imaging, Time-Resolved, and Coupled Methods
- Chapter 8: Troubleshooting and OptimizationDiagnosing Common Instrumental and Measurement Problems, Managing Water Vapor and Environmental Interference, Optimizing Instrument Performance and Data Quality
- ConclusionKey Takeaways and Next Steps, Continuing Your FTIR Journey
- Glossary of Terms
- Further Reading and Resources
Introduction
A polymer engineer receives a batch of failed plastic parts and needs to know within hours whether the resin supplier switched additives. A pharmaceutical chemist must confirm that a raw material matches its certificate of analysis before it enters production. An environmental analyst needs to identify an unknown oily residue found in a stormwater drain. In each case, the answer sits inside a spectrum: a plot of absorbance against wavenumber that took less than a minute to collect. That spectrum is the product of Fourier Transform Infrared Spectroscopy, a technique that has quietly become one of the most relied-upon tools in analytical chemistry and materials science.
FTIR earned that position because it answers a very specific question extremely well: what chemical bonds are present in a sample, and in what environment do they sit? Every covalent bond vibrates at a frequency tied to its mass and stiffness, and infrared light of matching frequency gets absorbed. The resulting pattern of absorption bands acts like a fingerprint, unique enough to distinguish polyethylene from polypropylene, or an genuine drug compound from a counterfeit. Unlike many analytical methods, FTIR does not require extensive sample destruction, exotic reagents, or long run times, which is part of why it shows up in laboratories ranging from forensic units to semiconductor fabs.
Despite its wide use, FTIR is frequently operated as a black box. A sample goes in, a spectrum comes out, and software offers a best-guess library match. That approach works until it doesn't: until the spectrum shows an unexpected shoulder, a sloped baseline, or a peak that the software software misidentifies. At that point, the operator either needs a real understanding of what the instrument is doing internally, or must accept an answer that may be wrong. This book exists to close that gap, moving from black-box operation to informed, confident interpretation.
The chapters ahead build in a deliberate sequence. Early material establishes the physical basis for infrared absorption and the mathematics that turns a raw interferogram into a usable spectrum. Later material moves into the physical instrument, the practical craft of sample handling, and the analytical skill of reading a spectrum critically. The final stretch addresses turning spectra into numbers through calibration and chemometrics, then surveys how FTIR gets applied across industries, before closing with a systematic approach to troubleshooting. The intent is that you finish with both a mental model of the instrument and a set of practical habits you can use at the bench the same day.
Why FTIR Matters in Modern Science
Infrared spectroscopy as a concept predates the "Fourier Transform" part by decades. Early dispersive infrared instruments used prisms or gratings to scan through wavelengths one at a time, recording absorbance slowly and often with weak signal. The breakthrough came when interferometer-based instruments, paired with digital computers powerful enough to compute a Fourier Transform quickly, made it possible to record an entire spectrum in seconds rather than minutes. This shift, formalized through the widespread adoption of the Cooley-Tukey Fast Fourier Transform algorithm, transformed infrared spectroscopy from a specialist technique into a routine laboratory workhorse[1].
The practical consequence of that shift is speed combined with sensitivity, a pairing that opened doors across industries. A quality control technician can now scan a raw material sample in under a minute and get a clear pass or fail answer. A materials scientist studying a curing reaction can capture dozens of spectra per minute, watching functional groups appear and disappear in near real time. This kind of throughput was simply not available with older dispersive instruments, where scanning a single spectrum could take several minutes and produce a noisier result. Speed changes what questions become answerable, turning FTIR from a confirmatory tool into an exploratory one.
FTIR's reach extends across an unusually broad range of sample types compared to many other spectroscopic methods. Solids, liquids, gases, powders, films, and even living tissue in some configurations can all be examined, often with only modest changes to the sampling approach. A single instrument, fitted with different accessories, might analyze a coating on a metal surface one hour and a headspace gas sample the next. This versatility explains why FTIR sits in such different settings: a polymer manufacturing floor, a pharmaceutical quality lab, an art conservation studio authenticating a painting's pigments, and a forensic laboratory examining trace evidence.
Consider a concrete case. A food safety lab receives a shipment of cooking oil suspected of adulteration with a cheaper oil. Chromatographic methods could answer this question but require solvent extraction, column setup, and an hour or more per sample. An FTIR measurement using a simple attenuated total reflectance accessory can flag characteristic differences in ester and unsaturation bands within two minutes, with no solvent waste and minimal sample preparation. This is not a claim that FTIR replaces chromatography for every purpose. It is an illustration of a niche FTIR fills exceptionally well: fast, non-destructive, high-throughput screening.
The economics of the technique matter as much as the physics. A benchtop FTIR spectrometer costs a fraction of a mass spectrometer or nuclear magnetic resonance instrument, requires no consumable gases in most configurations, and can be operated reliably by technicians without years of specialized graduate training. This lower barrier to entry means smaller companies, academic teaching labs, and field laboratories can deploy FTIR where more expensive techniques would be financially out of reach. That accessibility, paired with genuine analytical power, is a major reason the technique has spread so widely since the 1970s.
None of this diminishes the learning curve involved in using FTIR well. The instrument produces data quickly, but quick data is not automatically correct data. A technician who does not understand how a KBr Pellet differs from an Attenuated Total Reflectance measurement in peak intensity can misinterpret a shift that is purely an artifact of sampling geometry. Someone unfamiliar with Water Vapor Interference might mistake atmospheric absorption bands for a genuine sample feature. The speed and convenience that make FTIR valuable also make it easy to generate confident-looking spectra that are, in fact, misleading.
That tension between ease of operation and depth of interpretation is exactly what motivates a book like this one. Manufacturers of modern FTIR instruments have worked hard to make the user interface simple: load a sample, press a button, get a spectrum, click a library search. But the chemistry and physics underneath that button press have not gotten any simpler, and the responsibility for correct interpretation still rests with the operator. Building genuine competence means understanding molecular vibration theory, interferometer mechanics, sampling physics, and spectral interpretation as an integrated whole, not as isolated facts to memorize.
Industries that depend on FTIR for regulatory compliance illustrate the stakes clearly. Pharmaceutical manufacturers must demonstrate identity and purity of raw materials to regulatory bodies, often using FTIR as a required identity test under pharmacopeial standards. An incorrect spectral interpretation in that setting is not merely an academic error. It can mean a batch of medication moving forward with the wrong raw material, or a batch being needlessly rejected due to a misread baseline artifact. Understanding what a spectrum can and cannot tell you, and where the technique's limitations lie, is part of using it responsibly.
Academic and industrial research also benefits from a widening set of hyphenated techniques built around the FTIR core. Coupling FTIR with thermogravimetric analysis, gas chromatography, or microscopy has extended the reach of infrared detection into areas dispersive instruments never touched. A materials scientist studying polymer degradation can now watch gases evolve from a heated sample in real time, correlating mass loss with specific functional group signatures. These specialized techniques, covered later, depend entirely on the foundational principles established in the earliest chapters of this guide, which is why building that foundation matters even for readers whose ultimate interest lies in advanced applications.
The instrument's ability to work non-destructively deserves particular attention for anyone dealing with limited or irreplaceable samples. A conservator examining a centuries-old manuscript, a forensic examiner working with the only trace evidence recovered from a scene, or a materials engineer testing a single expensive prototype all share the same constraint: the sample cannot be consumed or damaged by the test. FTIR, especially when configured with reflectance-based accessories, allows chemical identification without physically altering the sample in most cases. That property alone justifies its place in fields where destructive testing is simply not an option.
Historical perspective helps explain why FTIR displaced dispersive infrared instruments so completely rather than existing alongside them as a niche alternative. The combination of Fellgett's Advantage, which allows all wavelengths to be measured simultaneously rather than sequentially, and Jacquinot's Advantage, which permits a larger optical throughput due to the absence of narrow slits, gave interferometer-based instruments a fundamental sensitivity edge that dispersive designs could not match[2]. Once affordable computing made the Fourier Transform calculation practical in the 1960s and 1970s, that sensitivity advantage translated directly into commercial success, and dispersive infrared instruments largely disappeared from new laboratory purchases within a couple of decades.
Understanding this history is not merely trivia. It explains design choices that persist in every modern instrument, from the reliance on a Michelson Interferometer as the optical heart of the system to the standard practice of co-adding multiple scans to improve Signal-to-Noise Ratio. These are not arbitrary engineering decisions. They flow directly from the mathematical and physical advantages that made FTIR practical in the first place, and understanding why they exist makes troubleshooting and optimization far more intuitive later in this guide.
Ultimately, FTIR matters because it sits at an unusually favorable intersection of speed, cost, sample versatility, and chemical specificity. Few analytical techniques let a researcher move from an unknown solid, liquid, or gas sample to a confident chemical identification within minutes, using equipment that fits on a benchtop and requires no specialized consumables. That combination is why FTIR appears in industries as different as forensic science, semiconductor manufacturing, art conservation, and environmental monitoring. Mastering it opens a genuinely broad set of professional doors, which is exactly the outcome this book aims to support.
What You'll Learn in This Guide
This guide is structured around a simple premise: real competence with FTIR requires understanding the technique at four connected levels, moving from physics to hardware to method to interpretation. Skipping any one of these levels tends to produce a practitioner who can run the instrument but cannot troubleshoot it, or one who understands the theory but cannot translate that theory into a well-prepared sample. The chapters that follow are organized to build each level in turn, with later material depending explicitly on concepts introduced earlier.
The first level covers the physical basis of infrared absorption. This means understanding how a molecule's bonds stretch and bend, why a change in Dipole Moment Change is required for a vibration to absorb infrared light at all, and how the Beer-Lambert Law connects absorbance to concentration and path length. Without this foundation, later discussions of peak assignment and quantitative calibration would be memorization exercises rather than genuine understanding. This material is addressed in the chapter on the fundamentals of infrared spectroscopy.
The second level covers how raw instrument signal becomes a usable spectrum. An interferometer does not measure absorbance directly. It measures an Interferogram, a plot of detector signal against Optical Path Difference, which must be mathematically converted through the Fourier Transform into a frequency-domain spectrum. Understanding this conversion, along with related concepts like Apodization and the practical advantages FTIR holds over older dispersive designs, explains why modern instruments behave the way they do and why certain data processing choices affect the final spectrum's appearance.
The third level is the physical instrument itself: the Globar or other infrared source, the Beam Splitter and mirror system, detectors such as the MCT Detector and DTGS Detector, and the sample compartment where the actual measurement happens. Each component has failure modes and performance characteristics that directly affect data quality. Knowing, for example, that an MCT Detector requires liquid nitrogen cooling and offers superior sensitivity but a narrower spectral range than a DTGS Detector changes how you select equipment for a given application.
The fourth level covers what many practitioners consider the actual craft of FTIR work: choosing and executing the correct sample preparation method. A KBr Pellet suits certain solid samples but introduces its own risk of moisture absorption. Attenuated Total Reflectance offers speed and minimal preparation but produces spectra with depth-dependent intensity that can complicate quantitative work. Diffuse Reflectance Infrared Fourier Transform Spectroscopy handles powders that resist other techniques. Selecting incorrectly among these options is one of the most common sources of poor data in practice, and the guide devotes substantial attention to matching technique to sample type.
Building on sample preparation, the guide moves into spectral interpretation, teaching how to read a finished spectrum with genuine skill rather than relying solely on automated library matching. This includes learning the difference between the Group Frequency Region, where peaks correspond fairly reliably to specific functional groups, and the Fingerprint Region, where overlapping vibrations make peak-by-peak assignment far harder but overall pattern comparison extremely powerful. You will also learn to recognize common artifacts, distinguish a genuine shoulder peak from an instrumental error, and apply Baseline Correction appropriately without distorting real spectral features.
A distinct and often underemphasized skill covered in this guide is turning FTIR from a qualitative identification tool into a quantitative measurement instrument. This involves constructing a proper Calibration Curve using known standards, understanding when Chemometrics methods such as Partial Least Squares or Principal Component Regression outperform simple univariate calibration, and building the quality assurance habits, like verifying Accuracy and Precision, that regulatory and industrial settings demand. Many FTIR users never move past qualitative identification simply because they were never taught this workflow, and it represents one of the more valuable additions this guide provides.
Beyond the mechanics of running the instrument, this guide surveys the real-world contexts where FTIR delivers value, spanning materials characterization of polymers and coatings, pharmaceutical identity testing, environmental and quality control screening, and specialized approaches like FTIR Microscopy, Time-Resolved FTIR, and hyphenated methods such as TGA-FTIR and GC-FTIR. These application chapters are not meant as exhaustive technical manuals for each field. They are meant to show, through specific examples, how the foundational principles taught earlier get applied to solve genuine analytical problems, so that you can adapt the same logic to a use case unique to your own work.
A large share of practical value in this guide comes from its treatment of troubleshooting. Real instruments drift, environments introduce interference, and samples behave unpredictably. Learning to systematically diagnose problems, whether the culprit is Water Vapor Interference, a misaligned Beam Splitter, or an aging source, saves enormous time compared to guessing at solutions or, worse, accepting flawed data without noticing. The guide presents this troubleshooting knowledge as a structured diagnostic process rather than a scattered list of tips, so that it applies to problems not explicitly covered by name.
Throughout every section, the intent is to connect theory directly to action. When Fellgett's Advantage is introduced, it comes with an explanation of why that advantage means FTIR instruments can complete useful scans in seconds where dispersive instruments needed minutes. When Purging is discussed, it comes with practical guidance on nitrogen flow rates and chamber sealing, not just an abstract mention that purging reduces interference. This pairing of concept and application is deliberate, because FTIR knowledge that cannot be applied at the bench provides little practical value regardless of how elegant the underlying physics might be.
By the final chapter, the goal is that a spectrum on screen no longer feels like an opaque output from a machine. Each peak should suggest a story: a functional group, a sampling choice, perhaps an environmental artifact worth investigating further. A calibration model should feel like a tool you built and can defend, not a black-box regression pulled from software defaults. And when something goes wrong with an instrument or a measurement, the response should be a structured diagnostic process rather than a frustrated restart of the entire experiment.
It is also worth setting expectations honestly. This guide provides deep, practical grounding in FTIR theory and method, but it cannot substitute for hands-on instrument time, nor can it cover every accessory or software package on the market given the pace of instrument development. What it can do is build a mental framework robust enough that when you encounter an unfamiliar instrument, a new accessory, or an unusual sample, you have the conceptual tools to reason through the problem rather than starting from zero. That transferable understanding is the actual product this guide is built to deliver.
Readers coming from a specific industry may be tempted to jump directly to the application chapter most relevant to their work. That approach can work for a quick reference, but it risks missing the reasoning that makes later troubleshooting and interpretation reliable. A pharmaceutical analyst who skips the fundamentals chapter, for example, may correctly run an identity test but struggle to explain why a particular batch produced an unexpected shoulder peak. The guide is written so that each chapter can stand somewhat independently for reference purposes, but the deepest value comes from working through the material roughly in sequence at least once.
Finally, this guide treats FTIR as a living, evolving technique rather than a fixed body of knowledge. Detector technology, computational chemometric methods, and hyphenated instrumentation continue to advance, and the specialized techniques chapter reflects some of the more recent directions the field has taken. The core physics of molecular vibration and the mathematics of the Fourier Transform, however, have remained stable for decades and will likely remain the bedrock of the technique for decades more. Learning that bedrock thoroughly is what allows you to adapt confidently as the surrounding technology continues to change.
How to Use This Book Effectively
The most effective way to use this guide depends partly on your starting point, but a few general principles apply broadly. If you are new to infrared spectroscopy entirely, resist the temptation to skip ahead to sample preparation or applications before working through the fundamentals. The reasoning behind Beer-Lambert Law, molecular vibration, and dipole moment change is not optional background information. It is the logic that everything else in the book rests on, and shortcuts taken here tend to resurface as confusion later when interpreting a real spectrum or explaining an unusual calibration result.
If you already have working experience running an FTIR instrument but want to deepen your understanding, a more targeted approach makes sense. Consider identifying the two or three areas where your current knowledge feels shakiest, perhaps interferometer mathematics, chemometric calibration, or systematic troubleshooting, and reading those chapters closely while treating the more familiar material as review. Even experienced users often discover gaps this way, such as realizing they have never fully understood why Apodization affects peak shape and resolution, despite having adjusted that setting in software for years without knowing what it actually does.
Active engagement with the material produces far better retention than passive reading, particularly for a technical subject like this one. Whenever a worked example or calculation appears, work through it yourself rather than simply reading the result. When the guide describes a sampling technique like Attenuated Total Reflectance, consider how you would explain the physical mechanism to a colleague in your own words, since the act of re-explaining a concept reliably reveals gaps in understanding that passive reading conceals. This is especially valuable for the mathematical sections on Fourier Transform theory, where the underlying logic is more important than memorizing formulas.
Pairing this guide with actual instrument access will accelerate learning substantially. Reading about the difference between a KBr Pellet and a Nujol Mull is useful, but preparing both from the same solid sample and comparing the resulting spectra teaches lessons that text alone cannot fully convey, such as how much technique-dependent variation in peak intensity and baseline shape is normal versus concerning. If you have access to a shared instrument through work or an academic setting, consider treating each chapter's core technique as a mini experiment to try firsthand, even if only with a simple, known compound like polystyrene film, which is commonly used for calibration verification.
The glossary near the end of the book serves as a quick reference for canonical terms used consistently throughout the chapters, and it is worth reviewing early even before you need it as a lookup tool. Because this guide uses precise terminology deliberately, distinguishing for instance between Absorbance and Transmittance rather than using them interchangeably, a quick early pass through the glossary will make later chapters read more smoothly and reduce the need to backtrack for definitions mid-chapter.
For readers focused on a specific application area, such as pharmaceutical analysis or environmental monitoring, a hybrid reading strategy tends to work best. Read the foundational chapters in full sequence first, since they are relatively compact and establish the physics and mathematics needed everywhere else. Then move directly to your application area of interest in the real-world applications chapter, using the sample preparation and spectral interpretation chapters as reference material to consult whenever the application chapter mentions a technique or interpretation skill you have not yet mastered in depth.
Troubleshooting knowledge benefits from a different kind of engagement than conceptual material. Rather than reading the troubleshooting chapter once and expecting to retain a full diagnostic checklist, treat it as a reference to revisit whenever you actually encounter a problem with real data. Reading about baseline drift in the abstract is far less memorable than reading the same section immediately after noticing baseline drift in your own spectrum, because the immediate practical stakes make the diagnostic logic stick.
Consider keeping a simple running log of spectra you collect while working through this guide, noting the sample type, sampling technique used, and any unusual features observed. This kind of practical record, even an informal one, builds pattern recognition far faster than reading alone. Over time, you will start noticing, for example, that a particular carbonyl peak position varies slightly depending on whether a sample was run neat or as a Nujol Mull, and that kind of firsthand observation cements the theoretical explanation for the shift far more effectively than reading about it once.
Some sections include worked calculations, particularly around the Beer-Lambert Law and calibration curve construction. Do not skip these because they look like extra math. Quantitative FTIR work depends entirely on comfort with these calculations, and a reader who understands the concept of a calibration curve in the abstract but has never actually calculated a regression slope and used it to predict an unknown concentration will struggle the first time a real quantitative task appears at work.
If certain terminology feels unfamiliar even after consulting the glossary, resist the urge to guess at meaning from context alone, since spectroscopy terms often carry precise technical definitions that differ subtly from their everyday usage. The term Resolution, for instance, has a specific quantitative meaning tied to Optical Path Difference in interferometer systems, distinct from how the word is used casually elsewhere. Taking the extra few minutes to look up an unfamiliar term properly pays off across the rest of the book, since these terms recur constantly in later chapters.
For those using this guide in a team or training setting, consider working through chapters as discussion material rather than purely individual reading. Explaining a concept like Fellgett's Advantage to a colleague, or debating why a particular spectrum shows an unexpected shoulder peak, surfaces misunderstandings faster than solitary study. Many analytical laboratories already run informal journal clubs or training sessions, and this guide's chapter structure, with each section addressing a coherent, self-contained topic, lends itself naturally to that kind of group format.
Finally, treat this guide as a reference to return to rather than a book to read once and shelve. FTIR knowledge, particularly around troubleshooting and quantitative calibration, tends to solidify through repeated application over months and years of actual laboratory work, not through a single reading. Keep it accessible near your instrument or workstation, and revisit specific chapters whenever a new sample type, an unfamiliar artifact, or a request for quantitative results pushes you past the edge of your current comfort zone. The material is organized precisely so that this kind of targeted, repeated consultation remains straightforward long after the first full read-through is complete.
This is the end of the free sample. The full book has 8 chapters.
Want this book written for you?
Tell us your goals and background, and get your own version of this book, tailored by AI to you.


Benefits of AI-tailored books
- Read one book, not ten:
- all the Spectroscopy knowledge you need, gathered into a single book.
- Save days of learning:
- tell us your goals, choose your topics, and the whole book is built around them.
- Learn effortlessly:
- Spectroscopy book written for your specific background and expertise.
- Understand at a glance:
- includes charts, tables, timelines, checklists, decision trees, and more.
- Stay current:
- written the day you order it, not years ago.
- Trust what you read:
- every book is checked for accuracy, with real research when your subject needs it.
Create your unique book in 3 steps
- 1. Select your focus
Select the focus of your Spectroscopy book and share your background
- 2. Personalize your book
Specify your goals and choose sub-topics to include
- 3. Get your tailored book
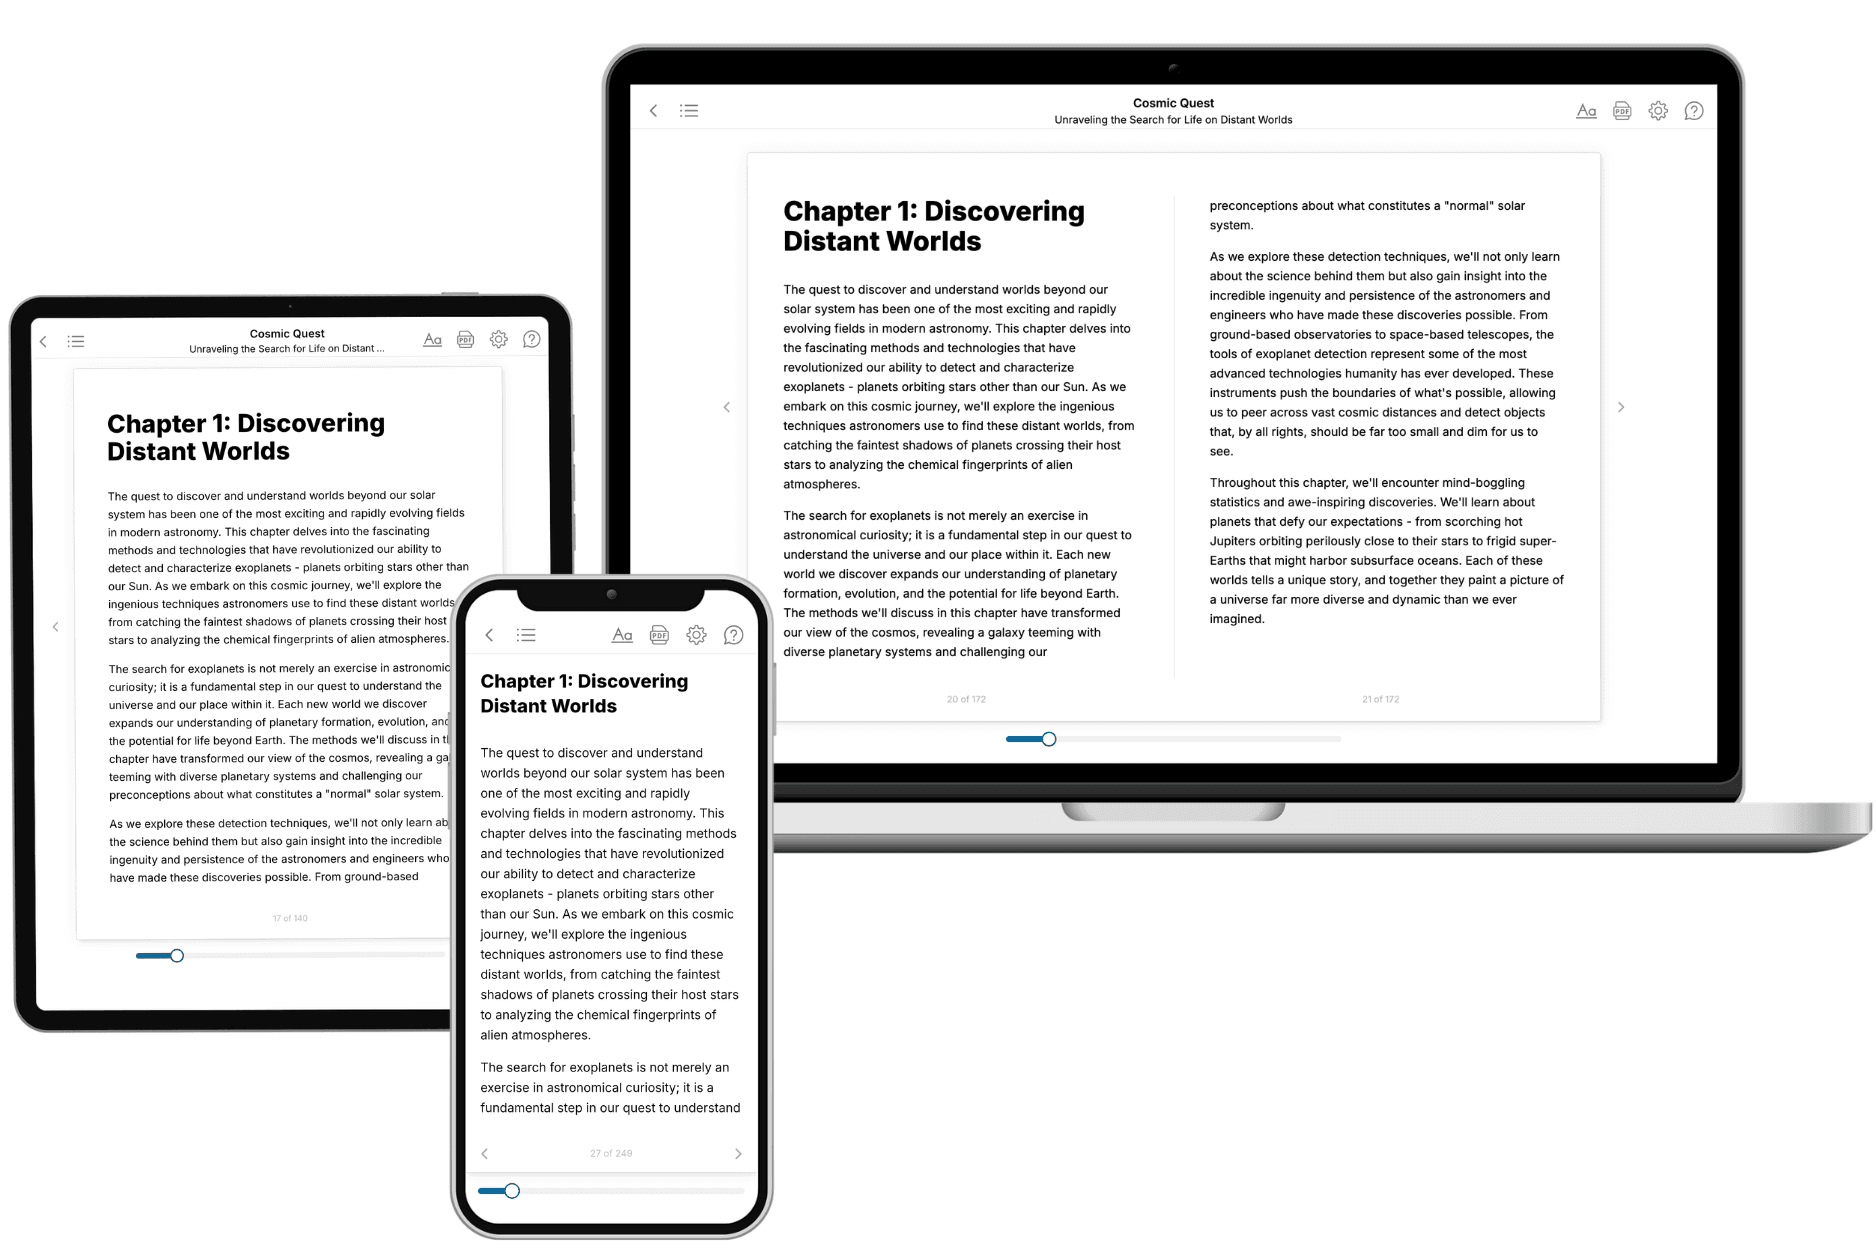
Your book is ready in 10 minutes. Read it online, download as EPUB or PDF, or send to Kindle.
Frequently asked questions
- What is TailoredRead?
TailoredRead creates complete, full-length nonfiction ebooks, written specifically for you. Tell us what you want to learn and why, and TailoredRead writes you a complete ebook on it, with charts, tables, and diagrams throughout. Read it online, on Kindle, or on any e-reader, or download it as a PDF or EPUB. Every book is written fresh the day you order it.
- How is the book tailored to me?
Before anything is written, you answer a few short questions about your goals, your background, and the topics you care about. Your book is then planned around your answers: written at your level, focused on your goals, and covering the topics you chose, instead of the one-size-fits-all book a store sells everyone.
- Will it read like generic AI content?
No. Your book isn't a chat transcript: it's planned chapter by chapter before a single word is written, told in a clear book voice, and explains ideas visually with charts, tables, and diagrams. After writing, every book goes through an editorial pass that polishes chapters so the book reads consistent from start to finish. Judge for yourself: browse thousands of sample books on our Explore Books page.
- How accurate is the content?
Our AI first checks whether your subject needs live research. Niche and fast-moving subjects are researched before writing, and the book plan and chapters are grounded in what it finds. After writing, every book goes through a quality pass that checks its facts and consistency, and researched books list their sources in a Notes section at the back.
- How long is the book?
You choose the length: Comprehensive (250-300 pages), Detailed (150-200 pages), Essential (70-100 pages), or Short (30-50 pages).
- Does the book include visuals?
Yes. Every book includes charts, tables, and diagrams: timelines, checklists, step-by-step guides, decision trees, comparison tables, matrices, and bar charts. A typical book includes dozens of these visual elements.
- Can I read it on Kindle? What formats can I download?
Yes. Every book can be read in our online reader or downloaded as a PDF or EPUB. The EPUB can be opened with Kindle, Apple Books, Kobo, and any e-reader. The Commercial and Author licenses also include an editable Word (DOCX) and Markdown download.
- How much does it cost?
About the price of a regular ebook. The exact price depends on your book's length and complexity, from $2 for the shortest books to $35 for the most comprehensive, and it's shown when you review your book, before you commit to anything. Each book is a one-time purchase, yours to keep, no subscription. Licenses that let you share, teach, or publish your book range from $35.99 to $49.99.
- Can I preview the book before purchasing?
Before you pay, you'll see what your book will cover: the title, a detailed description, the estimated length, and the complete chapter-by-chapter table of contents, so you know what you're getting before you decide. The full text itself is written after you purchase.
- How long does it take to create a book?
About 10 minutes. You can start reading the opening chapters while the rest is still being written.