The Frequentist Fallacy
Why Most Published Research Is Wrong and How Statistical Theory Actually Works
You're about to discover why the research you trust may be fundamentally flawed.
207 pages9 chaptersAug 6, 2026StatisticsCreated by Dr
About this book
Most published studies violate core statistical principles, yet their findings are presented as reliable facts. This book reveals the hidden logic of hypothesis testing—how it actually works versus how researchers think it works—and exposes the systematic errors that plague modern research. You'll learn why p-values are misinterpreted, why sampling methods fail, why clinical trials start with flawed designs, and why medical efficacy claims are often fraudulent. Through clear explanations and concrete examples, you'll understand how observational studies, self-selected samples, and convenience sampling destroy statistical validity. You'll see why confidence intervals mean something entirely different than most believe, why the proportional reporting ratio is mathematically broken, and how p-hacking creates false discoveries. By the end, you'll recognize the fundamental requirements of statistical theory and understand why most published research cannot support its own conclusions. This knowledge will change how you read, evaluate, and conduct research.
Table of contents
- IntroductionWhy This Matters: The Crisis in Published Research, What You'll Learn in This Book, How to Use This BookRead below
- Chapter 1: The Backwards Logic of Hypothesis TestingHow Researchers Think It Works, How It Actually Works, The Null Hypothesis Trap, Why This Confusion Matters
- Chapter 2: P-Values: The Most Misunderstood Number in ScienceWhat a P-Value Actually Means, What a P-Value Does NOT Mean, Common P-Value Misinterpretations, The Statistical Significance Trap
- Chapter 3: Sampling: The Foundation That FailsThe Randomization Requirement, Types of Sampling Bias, Convenience Sampling and Its Consequences, Why Real-World Sampling Fails
- Chapter 4: Observational Studies: The Illusion of EvidenceObservational Studies Versus Experimental Design, Self-Selection Bias in Clinical Research, Fundamental Fallacies of Observational Studies, Why Observational Studies Cannot Replace Randomization
- Chapter 5: Confidence Intervals: Myths and MisinterpretationsWhat a Confidence Interval Actually Represents, Common Confidence Interval Myths, How Confidence Intervals Are Misused, The Correct Interpretation
- Chapter 6: Clinical Trials: Flawed From the StartHow Clinical Trials Are Supposed to Work, Self-Selection Bias in Clinical Trials, Medical Efficacy Calculations: The Fraud, What Efficacy Actually Tells You
- Chapter 7: Proportional Reporting Ratio: A Broken ToolWhat Is the Proportional Reporting Ratio?, Fundamental Flaws in PRR Methodology, The PRR Invariance Problem, Why PRR Cannot Measure Drug or Vaccine Effectiveness
- Chapter 8: P-Hacking and the Replication CrisisWhat Is P-Hacking?, Common P-Hacking Techniques, How P-Hacking Created the Replication Crisis, Why Studies Fail to Replicate
- Chapter 9: Putting It All Together: Recognizing Flawed ResearchRed Flags in Published Research, Critical Questions to Ask, How to Evaluate Statistical Claims
- ConclusionKey Takeaways, Moving Forward as a Researcher
- Glossary of Statistical Terms
- Further Reading and Resources
Introduction
A 2005 paper by epidemiologist John Ioannidis made a claim that rattled the scientific community: most published research findings are false.[1] Not occasionally wrong, not slightly overstated, but systematically, structurally false. The paper was not a polemic. It was a mathematical argument, grounded in the logic of hypothesis testing itself. And in the two decades since, replication studies across psychology, medicine, economics, and nutrition have largely confirmed the diagnosis. The problem is not fraud, though fraud exists. The problem is something more fundamental: most researchers do not understand how the statistical tools they use actually work.
This is not a comfortable claim to make, and it is not made lightly. Researchers spend years in graduate programs learning to run statistical tests, interpret outputs, and write up results. They follow the conventions of their fields. They submit to peer review. They publish in respected journals. And yet, at nearly every step of this process, the underlying logic of frequentist statistics is being violated in ways that invalidate the conclusions being drawn. The violations are not hidden. They are baked into standard research practice, taught in methods courses, and accepted by reviewers who share the same misunderstandings.
The gap between how statistical methods are supposed to work and how they are actually applied is the subject of this book. Understanding that gap does not require advanced mathematics. It requires something more basic: a clear account of what the theory actually says, followed by an honest look at what researchers actually do. Once you see the mismatch, you cannot unsee it. A p-value reported in a paper will never look quite the same. A headline claiming that a study "proves" some effect will trigger a different set of questions. That shift in perspective is the goal here.
The chapters ahead move through the major fault lines in applied statistics, one at a time. Each fault line has its own logic, its own common errors, and its own consequences for the reliability of published findings. Together, they form a picture of a research enterprise that has built an enormous structure of published knowledge on foundations that are, in many cases, mathematically unsound. Recognizing those foundations is the first step toward doing better.
Why This Matters: The Crisis in Published Research
The replication crisis became impossible to ignore around 2011, when a large coordinated effort called the Reproducibility Project attempted to replicate 100 published psychology studies. Only about 36 to 39 of those studies produced results consistent with the original findings, depending on how replication was defined.[2] Similar efforts in cancer biology, economics, and nutrition produced comparably sobering results. These were not obscure studies from low-quality journals. Many were landmark findings, published in top-tier outlets, cited hundreds of times, and used to inform policy, clinical practice, and public health guidance.
The immediate reaction from many researchers was to blame bad actors: scientists who fabricated data, manipulated images, or selectively reported results. And those cases exist. High-profile retractions have exposed genuine misconduct. But misconduct alone cannot explain a failure rate of this scale. The deeper explanation lies in the statistical machinery itself, specifically in how hypothesis testing is designed, what it can and cannot tell you, and how its outputs are routinely misread.
Consider what happens when a researcher runs a standard significance test and gets a p-value below 0.05. The near-universal interpretation, in papers, in textbooks, and in press releases, is that the result is "statistically significant," meaning the finding is real and unlikely to be due to chance. That interpretation is wrong in a precise, technical sense. A p-value below 0.05 does not tell you the probability that your hypothesis is true. It tells you something much narrower and much less useful: the probability of observing data at least as extreme as yours, assuming the null hypothesis is true. Those are not the same thing. Confusing them is not a minor semantic error. It is a logical inversion that changes the meaning of the result entirely.
The consequences of this misunderstanding ripple outward. Medical treatments get approved based on trial results that would not survive scrutiny under the correct interpretation. Nutritional guidelines get revised based on observational studies that cannot establish causation. Educational interventions get scaled up based on convenience samples that cannot support generalization. Public health recommendations get issued based on efficacy calculations that conflate relative and absolute risk. At each step, the statistical language of certainty is applied to findings that the underlying theory cannot actually support.
This matters beyond academia. Research findings shape clinical decisions, regulatory approvals, public health policy, and media coverage. When a drug is approved based on a trial that violated randomization requirements, patients receive treatments whose actual effectiveness is unknown. When a nutritional study based on self-reported food diaries generates headlines about cancer risk, millions of people change their behavior based on evidence that is structurally incapable of supporting that conclusion. The stakes are not abstract. They are measured in treatments given, policies enacted, and resources allocated based on findings that the statistical framework cannot actually validate.
None of this means that all research is worthless or that science as a whole is broken. It means that a specific set of practices, applied uncritically and at scale, has produced a body of literature with a much higher false-positive rate than most people assume. Recognizing which practices produce unreliable results, and why, is what allows you to distinguish the solid findings from the fragile ones. That distinction is not always easy to make, but it is always worth making.
The problem is not that researchers are dishonest. The problem is that the tools they trust most are being used in ways those tools were never designed to support.
The chapters in this book are organized around the specific mechanisms that produce unreliable research. Each mechanism is a place where the gap between statistical theory and research practice is widest. Understanding each one gives you a concrete diagnostic tool, something you can apply the next time you read a study, evaluate a claim, or design a piece of research yourself.
What You'll Learn in This Book
The book begins with the logic of hypothesis testing itself, because everything else depends on it. Most researchers believe they are testing whether their hypothesis is true. The actual procedure works in the opposite direction: you assume the null hypothesis is true, then calculate how surprising your data would be under that assumption. The chapter on the backwards logic of hypothesis testing unpacks this inversion in detail, showing why it matters and what it means for the conclusions researchers draw.
From there, the book moves to p-values, which are the single most misunderstood output in applied statistics. The precise definition of a p-value is narrow and counterintuitive. What it cannot mean is just as important as what it does mean. The chapter on p-values walks through the correct definition, the most common misinterpretations, and the specific ways that the threshold of 0.05 became a convention mistaken for a truth verdict. Understanding this chapter will change how you read the results section of almost any published paper.
Sampling is the next major topic, and it is where many studies fail before a single analysis is run. Frequentist inference rests on a specific mathematical requirement: that samples are drawn randomly from a defined population. When that requirement is violated, the probability calculations that produce p-values and confidence intervals lose their mathematical foundation. The chapter on sampling covers the randomization requirement, the main types of sampling bias, and why convenience sampling is so widespread and so damaging to statistical validity.
Observational studies get their own chapter because they represent a particularly common and consequential source of unreliable findings. The inability of observational designs to establish causation is well known in principle but routinely ignored in practice. Confounding variables, self-selection bias, and the absence of randomization combine to produce systematic illusions of evidence. The chapter explains the structural reasons why observational studies cannot substitute for randomized experiments, no matter how large the sample or how sophisticated the statistical adjustment.
Confidence intervals are widely treated as probability statements about where the true parameter lies. That interpretation is incorrect, and the correct interpretation is both more precise and more limited. The chapter on confidence intervals explains what a confidence interval actually represents, why the common interpretation is wrong, and how misuse of confidence intervals leads to overconfident conclusions in published research.
Clinical trials occupy a special place in the research hierarchy, often treated as the gold standard of evidence. But many trials are flawed from the design stage, before a single participant is enrolled. The chapter on clinical trials examines how self-selection bias enters trial populations, how efficacy calculations can be presented in ways that dramatically overstate practical benefit, and what the difference between absolute risk reduction and relative risk reduction means for interpreting trial results.
The Proportional Reporting Ratio is a tool used in drug safety surveillance that has significant structural problems. The chapter on this topic explains what the PRR measures, why it measures reporting share rather than actual risk, and why it cannot be used to draw conclusions about drug or vaccine effectiveness. This is a more technical topic than some of the others, but it illustrates a broader principle: that a tool can be mathematically well-defined and still be fundamentally unsuited to the conclusions drawn from it.
P-hacking and the replication crisis form the subject of the penultimate chapter. Researcher degrees of freedom, selective reporting, and HARKing (Hypothesizing After Results are Known) are practices that inflate false-positive rates far above the nominal alpha level. The chapter explains how these practices work, why they are so difficult to detect from a published paper, and how they produced the replication failures that have shaken confidence in published research across multiple fields.
The final chapter brings everything together into a practical framework for evaluating statistical claims. It provides a set of diagnostic questions and red flags that you can apply to any study, any headline, or any research claim you encounter. The goal is not to make you skeptical of all research, but to give you the tools to distinguish findings that rest on solid statistical foundations from those that do not.
The Book's Core Topics in Order
- Backwards logic of hypothesis testing - Why the procedure works opposite to how most researchers describe it
- P-values and their misinterpretation - The precise definition and the most common errors in reading it
- Sampling and randomization requirements - Why convenience samples destroy statistical validity
- Observational studies and causation - Why no statistical adjustment can substitute for randomization
- Confidence intervals - The correct interpretation versus the common myth
- Clinical trial design flaws - Self-selection bias and misleading efficacy metrics
- Proportional Reporting Ratio - Why this pharmacovigilance tool cannot measure effectiveness
- P-hacking and the replication crisis - How researcher degrees of freedom inflate false-positive rates
- Critical appraisal framework - Practical tools for evaluating any statistical claim
How to Use This Book
This book is written for researchers who use statistics in their work but have not had the opportunity to examine the theoretical foundations of those methods in depth. That includes graduate students running their first analyses, experienced researchers who learned statistics through practice rather than theory, clinicians who read and apply published findings, and anyone who wants to evaluate research claims more rigorously. No advanced mathematics is required. The arguments are made in plain language, with concrete examples drawn from real research contexts.
The chapters are designed to be read in order, because each one builds on the concepts introduced before it. The chapter on p-values, for example, assumes you have read the chapter on hypothesis testing, because the correct interpretation of a p-value only makes sense once you understand the logical structure of the test that produces it. Similarly, the chapter on clinical trials draws on the sampling and observational study chapters, because the flaws in trial design are specific instances of the more general problems covered earlier.
That said, if you already have a solid grounding in one area, you can move through that chapter more quickly and spend more time on the topics that are less familiar. Each chapter is self-contained enough to be revisited independently once you have read the book through once. The final chapter on critical appraisal is designed to be used as a reference, something you return to when you are reading a specific paper and want a structured set of questions to apply.
Throughout the book, you will find concrete examples drawn from published research, clinical practice, and everyday research scenarios. These examples are not decorative. They are the mechanism by which abstract statistical concepts become practically useful. When you see how a specific misinterpretation of a p-value led to a specific overconfident conclusion in a specific study, the abstract error becomes tangible. That tangibility is what makes the concept stick and what makes it transferable to the next paper you read.
You will also find, at various points, explicit descriptions of what correct practice looks like alongside descriptions of what goes wrong. This is deliberate. Understanding the error is only half the task. Knowing what the correct interpretation or correct design would look like is what allows you to apply the knowledge constructively, whether you are evaluating someone else's research or designing your own.
A glossary at the back of the book defines all the key technical terms used throughout. The canonical terms used in this book are precise and consistent. Null Hypothesis Significance Testing, p-value, confidence interval, sampling bias, confounding variable, and the other terms defined in the glossary always refer to the same specific concepts. Precision in terminology is not pedantry here. It is a prerequisite for clear thinking about statistical methods, because many of the errors this book describes arise directly from imprecise or interchangeable use of terms that have distinct technical meanings.
One thing this book does not do is tell you that statistics is useless or that quantitative research should be abandoned. The frequentist framework, properly applied, is a powerful and legitimate tool for drawing inferences from data. The problem is not the framework. The problem is the gap between what the framework requires and what researchers actually do. Closing that gap, or at least seeing it clearly, is what this book is for.
By the time you finish the final chapter, the way you read a results section will have changed. You will notice when a paper reports relative risk without reporting absolute risk. You will recognize when a confidence interval is being interpreted as a probability statement about a single study rather than a property of the estimation procedure. You will see when a sample described as "representative" has no mechanism for actually achieving representativeness. These are not small observations. They are the difference between evidence that can support a conclusion and evidence that only appears to.
What You Should Be Able to Do After Reading This Book
- Explain the correct logical structure of Null Hypothesis Significance Testing
- State the precise definition of a p-value and identify common misinterpretations
- Recognize when a study's sampling method violates randomization requirements
- Distinguish between observational and experimental evidence and explain why the distinction matters
- Interpret a confidence interval correctly and identify when it is being misused
- Identify self-selection bias and healthy-user bias in clinical trial designs
- Explain the difference between absolute risk reduction and relative risk reduction
- Describe how p-hacking and researcher degrees of freedom inflate false-positive rates
- Apply a structured set of critical appraisal questions to any published study
The research enterprise is not going to fix itself overnight. Incentive structures in academia reward publication over replication, novelty over rigor, and positive results over null findings. Those structural pressures are real and they are not easily changed. But individual researchers, clinicians, and readers of research can change how they engage with statistical claims right now, without waiting for systemic reform. That change starts with understanding what the tools actually do, which is exactly where this book begins.
This is the end of the free sample. The full book has 9 chapters.
Want this book written for you?
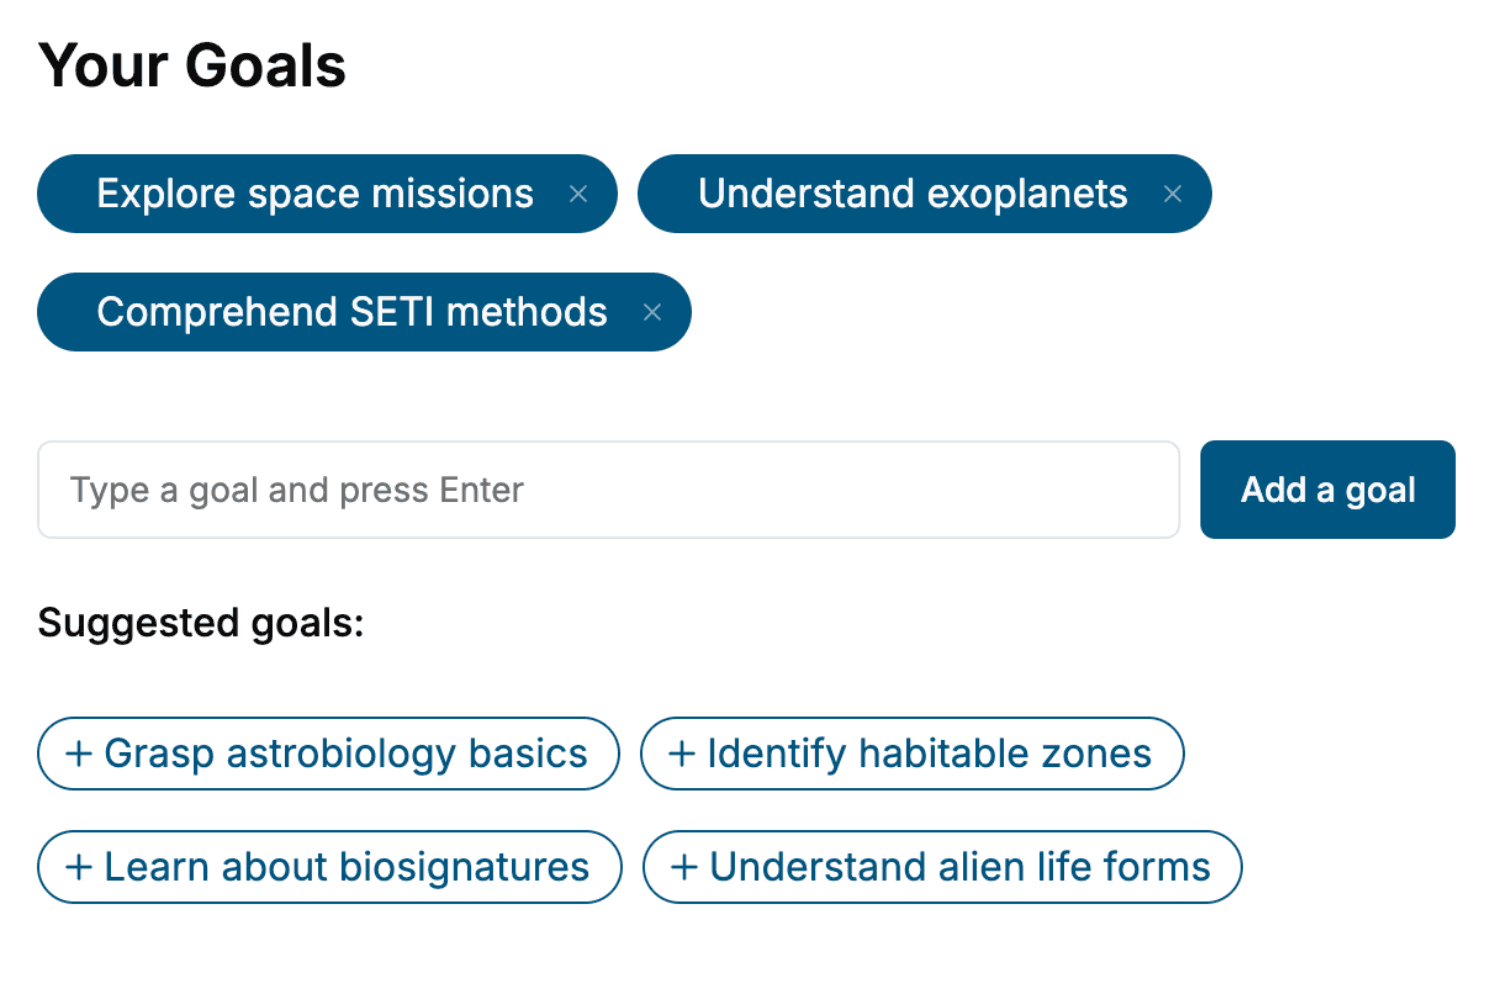
Tell us your goals and background, and get your own version of this book, tailored by AI to you.


Benefits of AI-tailored books
- Read one book, not ten:
- all the Statistics knowledge you need, gathered into a single book.
- Save days of learning:
- tell us your goals, choose your topics, and the whole book is built around them.
- Learn effortlessly:
- Statistics book written for your specific background and expertise.
- Understand at a glance:
- includes charts, tables, timelines, checklists, decision trees, and more.
- Stay current:
- written the day you order it, not years ago.
- Trust what you read:
- every book is checked for accuracy, with real research when your subject needs it.
Create your unique book in 3 steps
- 1. Select your focus
Select the focus of your Statistics book and share your background
- 2. Personalize your book
Specify your goals and choose sub-topics to include
- 3. Get your tailored book
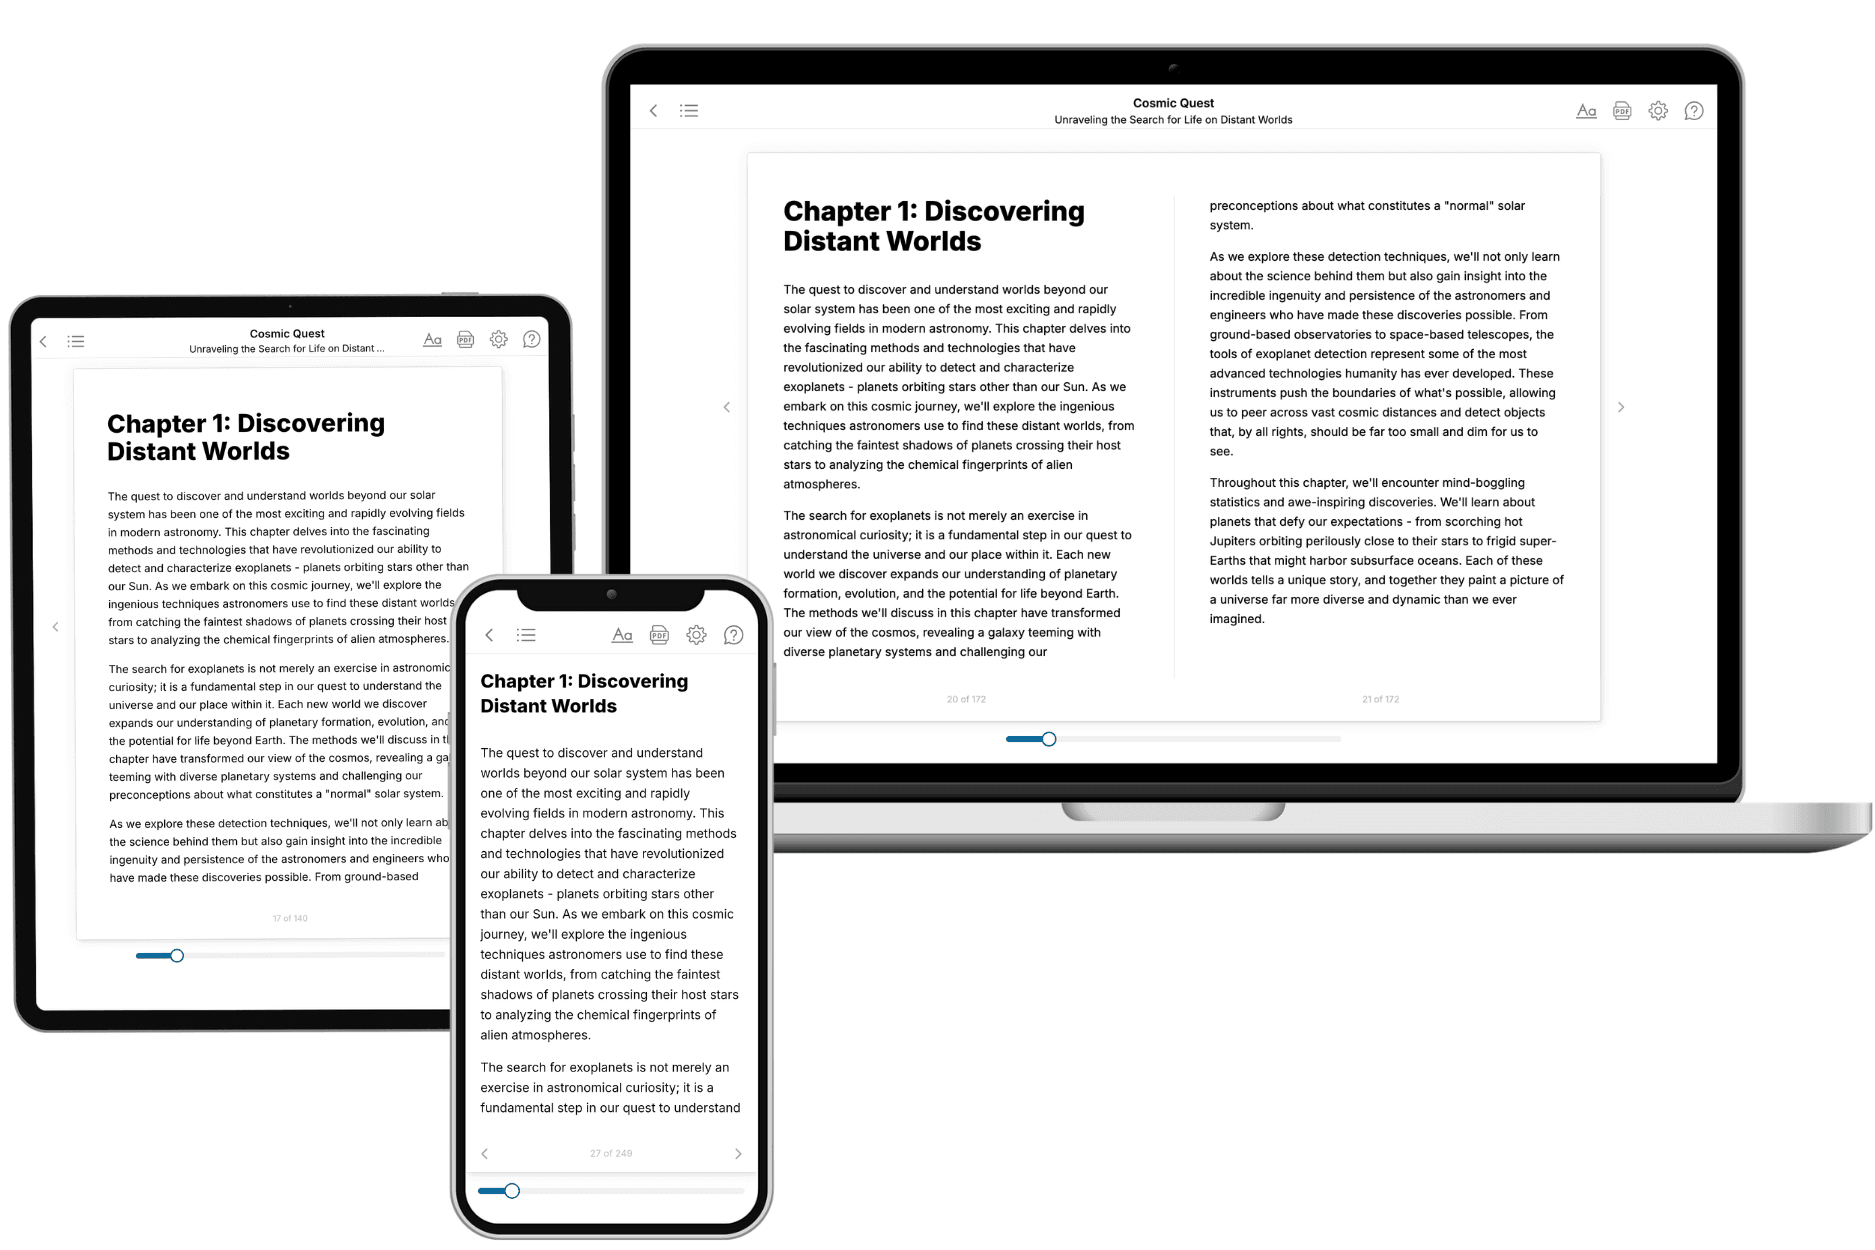
Your book is ready in 10 minutes. Read it online, download as EPUB or PDF, or send to Kindle.

Frequently asked questions
- What is TailoredRead?
TailoredRead creates complete, full-length nonfiction ebooks, written specifically for you. Tell us what you want to learn and why, and TailoredRead writes you a complete ebook on it, with charts, tables, and diagrams throughout. Read it online, on Kindle, or on any e-reader, or download it as a PDF or EPUB. Every book is written fresh the day you order it.
- How is the book tailored to me?
Before anything is written, you answer a few short questions about your goals, your background, and the topics you care about. Your book is then planned around your answers: written at your level, focused on your goals, and covering the topics you chose, instead of the one-size-fits-all book a store sells everyone.
- Will it read like generic AI content?
No. Your book isn't a chat transcript: it's planned chapter by chapter before a single word is written, told in a clear book voice, and explains ideas visually with charts, tables, and diagrams. After writing, every book goes through an editorial pass that polishes chapters so the book reads consistent from start to finish. Judge for yourself: browse thousands of sample books on our Explore Books page.
- How accurate is the content?
Our AI first checks whether your subject needs live research. Niche and fast-moving subjects are researched before writing, and the book plan and chapters are grounded in what it finds. After writing, every book goes through a quality pass that checks its facts and consistency, and researched books list their sources in a Notes section at the back.
- How long is the book?
You choose the length: Comprehensive (250-300 pages), Detailed (150-200 pages), Essential (70-100 pages), or Short (30-50 pages).
- Does the book include visuals?
Yes. Every book includes charts, tables, and diagrams: timelines, checklists, step-by-step guides, decision trees, comparison tables, matrices, and bar charts. A typical book includes dozens of these visual elements.
- Can I read it on Kindle? What formats can I download?
Yes. Every book can be read in our online reader or downloaded as a PDF or EPUB. The EPUB can be opened with Kindle, Apple Books, Kobo, and any e-reader. The Commercial and Author licenses also include an editable Word (DOCX) and Markdown download.
- How much does it cost?
About the price of a regular ebook. The exact price depends on your book's length and complexity, from $2 for the shortest books to $35 for the most comprehensive, and it's shown when you review your book, before you commit to anything. Each book is a one-time purchase, yours to keep, no subscription. Licenses that let you share, teach, or publish your book range from $35.99 to $49.99.
- Can I preview the book before purchasing?
Before you pay, you'll see what your book will cover: the title, a detailed description, the estimated length, and the complete chapter-by-chapter table of contents, so you know what you're getting before you decide. The full text itself is written after you purchase.
- How long does it take to create a book?
About 10 minutes. You can start reading the opening chapters while the rest is still being written.