Generalized Linear Regression
Master the Mathematics and Applications of GLM for Real-World Data Analysis
Many analysts assume linear regression works for all prediction problems, only to discover their models fail when predicting binary outcomes, counts, or other non-normal data.
222 pages10 chaptersMar 28, 2026Statistics
About this book
Generalized linear regression solves this fundamental limitation by extending regression to handle any type of response variable through a unified mathematical framework. This book bridges the gap between traditional linear regression and advanced statistical modeling. You'll learn how the three core components of GLM—the random component, systematic component, and link function—combine to create flexible models for real-world data. Starting with the mathematical foundations, you'll progress through practical applications including logistic regression for classification, Poisson regression for counts, and gamma regression for positive continuous data. Each concept is explained with clear intuition before diving into the mathematics, and every technique is demonstrated with worked examples and real datasets. You'll master model fitting using maximum likelihood estimation, learn to diagnose model problems, and discover how to interpret and communicate results effectively. Whether you're analyzing customer churn, disease prevalence, or insurance claims, this book equips you with the tools to build accurate, interpretable models that work with your actual data.
Table of contents
- IntroductionWhy Generalized Linear Models Matter, The Limitations of Traditional Linear Regression, Your Roadmap Through This Book, How to Use This Book EffectivelyRead below
- Chapter 1: Foundations of Generalized Linear ModelsLinear Regression: A Quick Review, When Linear Regression Fails, The GLM Framework: Three Essential Components, The Exponential Family of Distributions
- Chapter 2: The Random Component: Choosing Your DistributionNormal Distribution and Linear Regression, Binomial Distribution for Binary and Proportion Data, Poisson Distribution for Count Data, Gamma Distribution for Positive Continuous Data
- Chapter 3: Link Functions: Connecting Predictors to OutcomesUnderstanding Link Functions, Identity Link: The Linear Case, Logit Link: Transforming Probabilities, Log Link: Multiplicative Models, Choosing the Right Link Function
- Chapter 4: Fitting GLM: Maximum Likelihood EstimationLikelihood and Log-Likelihood Functions, Maximum Likelihood Estimation Principles, Newton-Raphson Algorithm and Iterative Fitting, Convergence Issues and Troubleshooting
- Chapter 5: Logistic Regression: Binary and Multiclass OutcomesBinary Logistic Regression Fundamentals, Interpreting Coefficients as Odds Ratios, Multinomial Logistic Regression for Multiple Classes, Real-World Applications and Case Studies
- Chapter 6: Poisson Regression: Modeling Count DataPoisson Regression Fundamentals, Interpreting Coefficients as Rate Ratios, Overdispersion and Negative Binomial Regression, Practical Applications in Business and Research
- Chapter 7: Beyond Logistic and Poisson: Other GLM ModelsGamma Regression for Positive Continuous Data, Inverse Gaussian Regression, Quasi-Likelihood Methods for Flexible Modeling, Selecting the Right GLM for Your Data
- Chapter 8: Model Diagnostics and Goodness-of-FitDeviance and Deviance Residuals, Analyzing Residuals in GLM, Influence Diagnostics and Outlier Detection, Goodness-of-Fit Tests and Model Comparison
- Chapter 9: Interpreting and Communicating ResultsInterpreting Coefficients Across Different Link Functions, Making Predictions and Confidence Intervals, Communicating Results to Non-Technical Audiences, Visualizing GLM Results Effectively
- Chapter 10: Advanced Topics and ExtensionsRegularization in GLM: Ridge and Lasso, Generalized Linear Mixed Models, Bayesian Approaches to GLM
- ConclusionKey Takeaways and Next Steps, Resources for Continued Learning
- Glossary of Terms
- Further Reading and Resources
Introduction
Picture this: you've spent hours building a regression model to predict whether a customer will cancel their subscription. You've cleaned the data, selected your predictors, and run the analysis. But when you look at the predictions, something is clearly wrong. The model is outputting probabilities above 1.0 and below 0.0, the residuals form a strange curved pattern, and the predictions near the extremes are wildly off. You've hit one of the most common walls in applied statistics: trying to force a linear regression model onto data that simply doesn't behave in a linear, normally distributed way.
This is not a rare problem. It shows up constantly in real-world data analysis. Count data like the number of customer support tickets filed per day, binary outcomes like whether a loan defaults, and skewed continuous measurements like insurance claim amounts all share one thing in common: they violate the core assumptions that make ordinary linear regression work. For decades, analysts either ignored these violations and hoped for the best, or they reached for awkward data transformations that often created more problems than they solved. Generalized linear models, or GLMs, were developed precisely to address this gap.
GLMs were formally unified and described by John Nelder and Robert Wedderburn in a landmark 1972 paper, bringing together a family of models that had previously been treated as separate techniques.[1] Their insight was elegant: many different types of regression problems share a common mathematical structure. By identifying that structure and building a unified framework around it, they gave statisticians and analysts a powerful, flexible toolkit that could handle a wide range of data types without abandoning the interpretability and rigor of regression analysis. Today, GLMs are a cornerstone of applied statistics, used in fields ranging from medicine and ecology to finance and marketing.
This book is designed to take you from a solid understanding of traditional linear regression to confident, practical mastery of generalized linear models. The journey covers the mathematical foundations, the key model types you'll use most often, and the diagnostic and interpretation skills that separate a good model from a great one. Every concept is introduced with clear intuition before the mathematics, and every technique is grounded in realistic examples drawn from the kinds of problems you're likely to encounter in your own work.
Why Generalized Linear Models Matter
The world generates data in many shapes and forms, and most of it doesn't follow a neat bell curve. When a hospital tracks the number of patient readmissions per month, those counts are always non-negative integers. When a bank records whether a credit card transaction is fraudulent, the outcome is either yes or no. When an insurer logs claim amounts, the values are strictly positive and often heavily right-skewed. Each of these data types has its own natural statistical distribution, and fitting a model that respects that distribution leads to better predictions, more honest uncertainty estimates, and more meaningful interpretations.
GLMs matter because they let the data speak in its own language. Instead of transforming your response variable to approximate normality and then hoping the transformation doesn't distort your conclusions, GLMs work directly with the natural distribution of your outcome. A Poisson GLM for count data, for example, automatically ensures that predicted counts are non-negative. A logistic regression GLM for binary outcomes automatically constrains predictions to the valid probability range between 0 and 1. This isn't just mathematical elegance; it has real consequences for the quality and trustworthiness of your analysis.
The practical reach of GLMs is enormous. Consider a few concrete examples of where they appear in everyday analytical work:
- Healthcare: Modeling the probability of disease diagnosis based on patient risk factors using logistic regression
- Insurance: Predicting claim frequency with Poisson regression and claim severity with gamma regression
- Marketing: Estimating customer churn probability or the number of purchases a customer will make in a given period
- Ecology: Counting species occurrences across different habitats and environmental conditions
- Finance: Modeling default risk, credit scoring, and the distribution of financial returns
Beyond their practical applications, GLMs also serve as a conceptual bridge to more advanced modeling techniques. Understanding GLMs deeply makes it much easier to learn generalized additive models, mixed-effects models, survival analysis, and even certain classes of neural networks. The ideas of link functions, likelihood-based estimation, and deviance-based model comparison appear throughout modern statistical modeling. Investing time in GLMs pays dividends far beyond the models themselves.
There's also a compelling argument for GLMs from the perspective of scientific integrity. When you use a model that matches the true data-generating process, your standard errors are more accurate, your confidence intervals are better calibrated, and your hypothesis tests are more reliable. Using ordinary linear regression on binary data, for instance, can produce standard errors that are systematically wrong, leading to false confidence in your conclusions.[2] GLMs help you avoid these pitfalls by building the right statistical assumptions into the model from the start.
Finally, GLMs are widely supported in every major statistical computing environment. Whether you work in R, Python, SAS, Stata, or Julia, you have access to well-tested, efficient implementations of GLMs. The concepts you learn in this book translate directly into code you can run on your own data, making this knowledge immediately actionable rather than purely theoretical.
The Limitations of Traditional Linear Regression
Linear regression is one of the most powerful and widely used tools in statistics, and for good reason. When its assumptions hold, it provides unbiased estimates, interpretable coefficients, and well-understood uncertainty quantification. The problem is that its assumptions are quite specific, and real-world data frequently violates them in ways that matter. Understanding exactly where and why linear regression breaks down is the clearest motivation for learning GLMs.
The most fundamental assumption of linear regression is that the response variable follows a normal distribution around the predicted mean, with constant variance across all levels of the predictors. This assumption is called homoscedasticity, and it's violated in many common situations. When you're modeling count data, the variance tends to increase with the mean. When you're modeling proportions, the variance is highest near 0.5 and shrinks toward zero as the proportion approaches 0 or 1. These patterns are not bugs in your data; they are natural features of the underlying distributions, and linear regression has no way to accommodate them.
A second critical limitation is that linear regression places no constraints on the range of predicted values. The linear predictor can produce any real number, from negative infinity to positive infinity. This is perfectly appropriate when your outcome is a continuous measurement that can take any value. But consider what happens when you apply this to a binary outcome coded as 0 and 1. The model will happily predict values like 1.4 or -0.2, which are meaningless as probabilities. Analysts sometimes try to fix this by capping predictions at 0 and 1, but this is an ad hoc patch that doesn't address the underlying statistical problem.
A classic demonstration of this failure: fit a linear probability model to a dataset where a binary outcome depends on a single continuous predictor. Plot the fitted line. For low values of the predictor, the predicted probability drops below zero. For high values, it rises above one. The model is technically fitting a line, but the line is describing something that cannot exist in reality.
Data transformations are often proposed as a solution to these problems. Taking the logarithm of a skewed response variable, for example, can sometimes make it more normally distributed. But transformations come with serious drawbacks. They change the scale of interpretation, making coefficients harder to explain. They can introduce new violations of assumptions. And they don't always work: you can't log-transform a binary variable, and transforming count data with many zeros is problematic. GLMs sidestep these issues entirely by modeling the response on its natural scale while using a link function to connect it to the linear predictor.
There's also the issue of what statisticians call the mean-variance relationship. In ordinary linear regression, the variance of the response is assumed to be constant and independent of the mean. In many real distributions, this is simply not true. For Poisson-distributed count data, the variance equals the mean. For binomial data, the variance is a specific function of the mean. When you ignore these relationships and use linear regression anyway, your standard errors are wrong, and your inference is unreliable. GLMs explicitly model the mean-variance relationship as part of the distributional assumption, giving you correct standard errors automatically.
It's worth being clear that linear regression is not a bad model. It's an excellent model for the problems it was designed to solve. The issue arises when analysts apply it to problems outside its domain of validity, either out of habit, convenience, or unfamiliarity with the alternatives. The goal of this book is not to replace linear regression in your toolkit but to expand that toolkit so you can choose the right model for each problem you face.
Here is a summary of the key situations where linear regression is likely to fail and what GLM alternative is typically more appropriate:
- Binary outcomes (yes/no, success/failure): Use logistic regression with a binomial distribution and logit link
- Count data (number of events): Use Poisson regression with a Poisson distribution and log link
- Proportions between 0 and 1: Use binomial regression or beta regression depending on the data structure
- Positive continuous data with right skew: Use gamma regression with a gamma distribution and log or inverse link
- Highly right-skewed positive data: Consider inverse Gaussian regression for extreme skewness
Your Roadmap Through This Book
This book is organized to build your understanding progressively, starting with the conceptual and mathematical foundations and moving toward practical application and advanced topics. Each chapter builds on the previous ones, so working through the material in order will give you the strongest foundation. That said, if you already have solid knowledge of a particular area, the chapters are written to be reasonably self-contained, and you can navigate to the topics most relevant to your current needs.
Chapter 1: Foundations of Generalized Linear Models starts with a concise review of linear regression to establish a shared baseline, then introduces the three core components of every GLM: the random component, the systematic component, and the link function. It also introduces the exponential family of distributions, which provides the mathematical foundation for why GLMs work across so many different data types. This chapter is essential reading if you want to understand the "why" behind the techniques, not just the "how."
Chapters 2 and 3 go deeper into two of the three GLM components. Chapter 2 covers the random component, walking through the key distributions you'll use in practice: normal, binomial, Poisson, and gamma. Chapter 3 covers link functions in detail, explaining the identity, logit, and log links, and giving you a framework for choosing the right link function for your problem. Together, these two chapters give you the vocabulary and intuition to design appropriate models for a wide range of data types.
Chapter 4 covers model fitting through maximum likelihood estimation. This is where you'll learn how GLMs are actually computed, including the iterative algorithms that find the best-fitting parameters. Understanding this material helps you troubleshoot convergence problems and interpret software output more confidently. It also deepens your appreciation for why GLMs behave differently from linear regression in terms of computation and inference.
Chapters 5 and 6 are the practical heart of the book. Chapter 5 covers logistic regression in depth, including binary logistic regression, odds ratio interpretation, and multinomial logistic regression for outcomes with more than two categories. Chapter 6 covers Poisson regression for count data, including the important topic of overdispersion and how to handle it with negative binomial regression. Both chapters include detailed worked examples and real-world case studies.
Chapter 7 broadens the picture by covering GLM models beyond logistic and Poisson regression. You'll learn about gamma regression for positive continuous data, inverse Gaussian regression for extreme skewness, and quasi-likelihood methods for situations where no standard distribution fits well. This chapter also provides a practical guide to selecting the right GLM for your specific data and research question.
Chapters 8 and 9 shift focus from model building to model evaluation and communication. Chapter 8 covers diagnostics specific to GLMs, including deviance residuals, influence measures, and goodness-of-fit tests. Chapter 9 addresses the often-overlooked challenge of interpreting and communicating GLM results, including how to translate coefficients on the link function scale into meaningful, accessible statements for non-technical audiences.
Chapter 10 introduces advanced extensions of the GLM framework, including regularization techniques like ridge and lasso regression, generalized linear mixed models for clustered or repeated-measures data, and Bayesian approaches to GLM. These topics point toward the frontier of modern statistical modeling and give you a sense of where to go after mastering the core material.
How to Use This Book Effectively
This book is written for intermediate learners who already have a working knowledge of basic statistics and linear regression. You should be comfortable with concepts like regression coefficients, p-values, confidence intervals, and residuals. You don't need to be a mathematician, but you should be willing to engage with equations when they appear. Every mathematical expression in this book is accompanied by a plain-language explanation, so the goal is always understanding, not symbol manipulation for its own sake.
The most effective way to use this book is to read actively, not passively. When you encounter a worked example, try to work through it yourself before reading the solution. When you see a formula, ask yourself what it's saying in words before moving on. When a new concept is introduced, think about how it connects to something you already know. This kind of active engagement dramatically improves retention and builds the kind of flexible understanding that lets you apply concepts to new problems.
Code examples throughout the book are written in a way that emphasizes the statistical concepts rather than the syntax of any particular language. The logic of fitting a GLM, extracting coefficients, and checking diagnostics is essentially the same whether you're working in R or Python. Where specific syntax is shown, it is clearly labeled and explained. If you're working in a different environment, the conceptual steps will translate directly even if the exact commands differ.
Here are some practical recommendations for getting the most out of each chapter:
- Read the chapter introduction first to understand what problem the chapter is solving and why it matters before diving into the details.
- Work through the examples with your own software environment open, reproducing the results and experimenting with variations.
- Apply each technique to your own data as soon as possible after learning it. Real data always raises questions that textbook examples don't, and those questions deepen your understanding.
- Review the key terms at the end of each chapter and make sure you can explain each one in plain language without looking at the definition.
- Don't skip the diagnostics chapters. Many analysts learn to fit models but neglect to check whether those models are actually appropriate. Chapters 8 and 9 are where good modeling practice is built.
A note on the mathematical level: this book aims to be rigorous without being unnecessarily abstract. Derivations are included when they build genuine intuition, and skipped or summarized when they would distract from the main point. If you find a particular mathematical section challenging, it's usually safe to focus on the result and the interpretation rather than every step of the derivation. You can always return to the details later once you've seen how the result is used in practice.
The glossary at the back of the book is a useful reference when you encounter a term you're not sure about. The further reading section points you toward the primary literature and advanced textbooks for each major topic. These resources are particularly valuable if you want to go deeper into any specific area, whether that's the theory of exponential families, the computational details of maximum likelihood estimation, or the latest developments in Bayesian GLMs.
One of the most common mistakes learners make with GLMs is treating them as a collection of separate techniques rather than as a unified framework. Logistic regression, Poisson regression, and gamma regression are not three different tools; they are three instances of the same underlying structure with different distributional and link function choices. Keeping this unity in mind as you work through the book will help you build a coherent mental model that makes it much easier to learn new GLM variants and to troubleshoot problems when they arise.
Finally, approach this material with patience and curiosity. GLMs are genuinely powerful, and mastering them opens up a much wider range of analytical problems than linear regression alone can handle. The investment you make in understanding the foundations will pay off every time you encounter a new dataset with a non-normal response variable and know exactly how to approach it. That moment of recognition, when you look at a problem and immediately see which GLM is the right tool, is what this book is designed to help you reach.
This is the end of the free sample. The full book has 10 chapters.
Want this book written for you?
Tell us your goals and background, and get your own version of this book, tailored by AI to you.


Benefits of AI-tailored books
- Read one book, not ten:
- all the Statistics knowledge you need, gathered into a single book.
- Save days of learning:
- tell us your goals, choose your topics, and the whole book is built around them.
- Learn effortlessly:
- Statistics book written for your specific background and expertise.
- Understand at a glance:
- includes charts, tables, timelines, checklists, decision trees, and more.
- Stay current:
- written the day you order it, not years ago.
- Trust what you read:
- every book is checked for accuracy, with real research when your subject needs it.
Create your unique book in 3 steps
- 1. Select your focus
Select the focus of your Statistics book and share your background
- 2. Personalize your book
Specify your goals and choose sub-topics to include
- 3. Get your tailored book
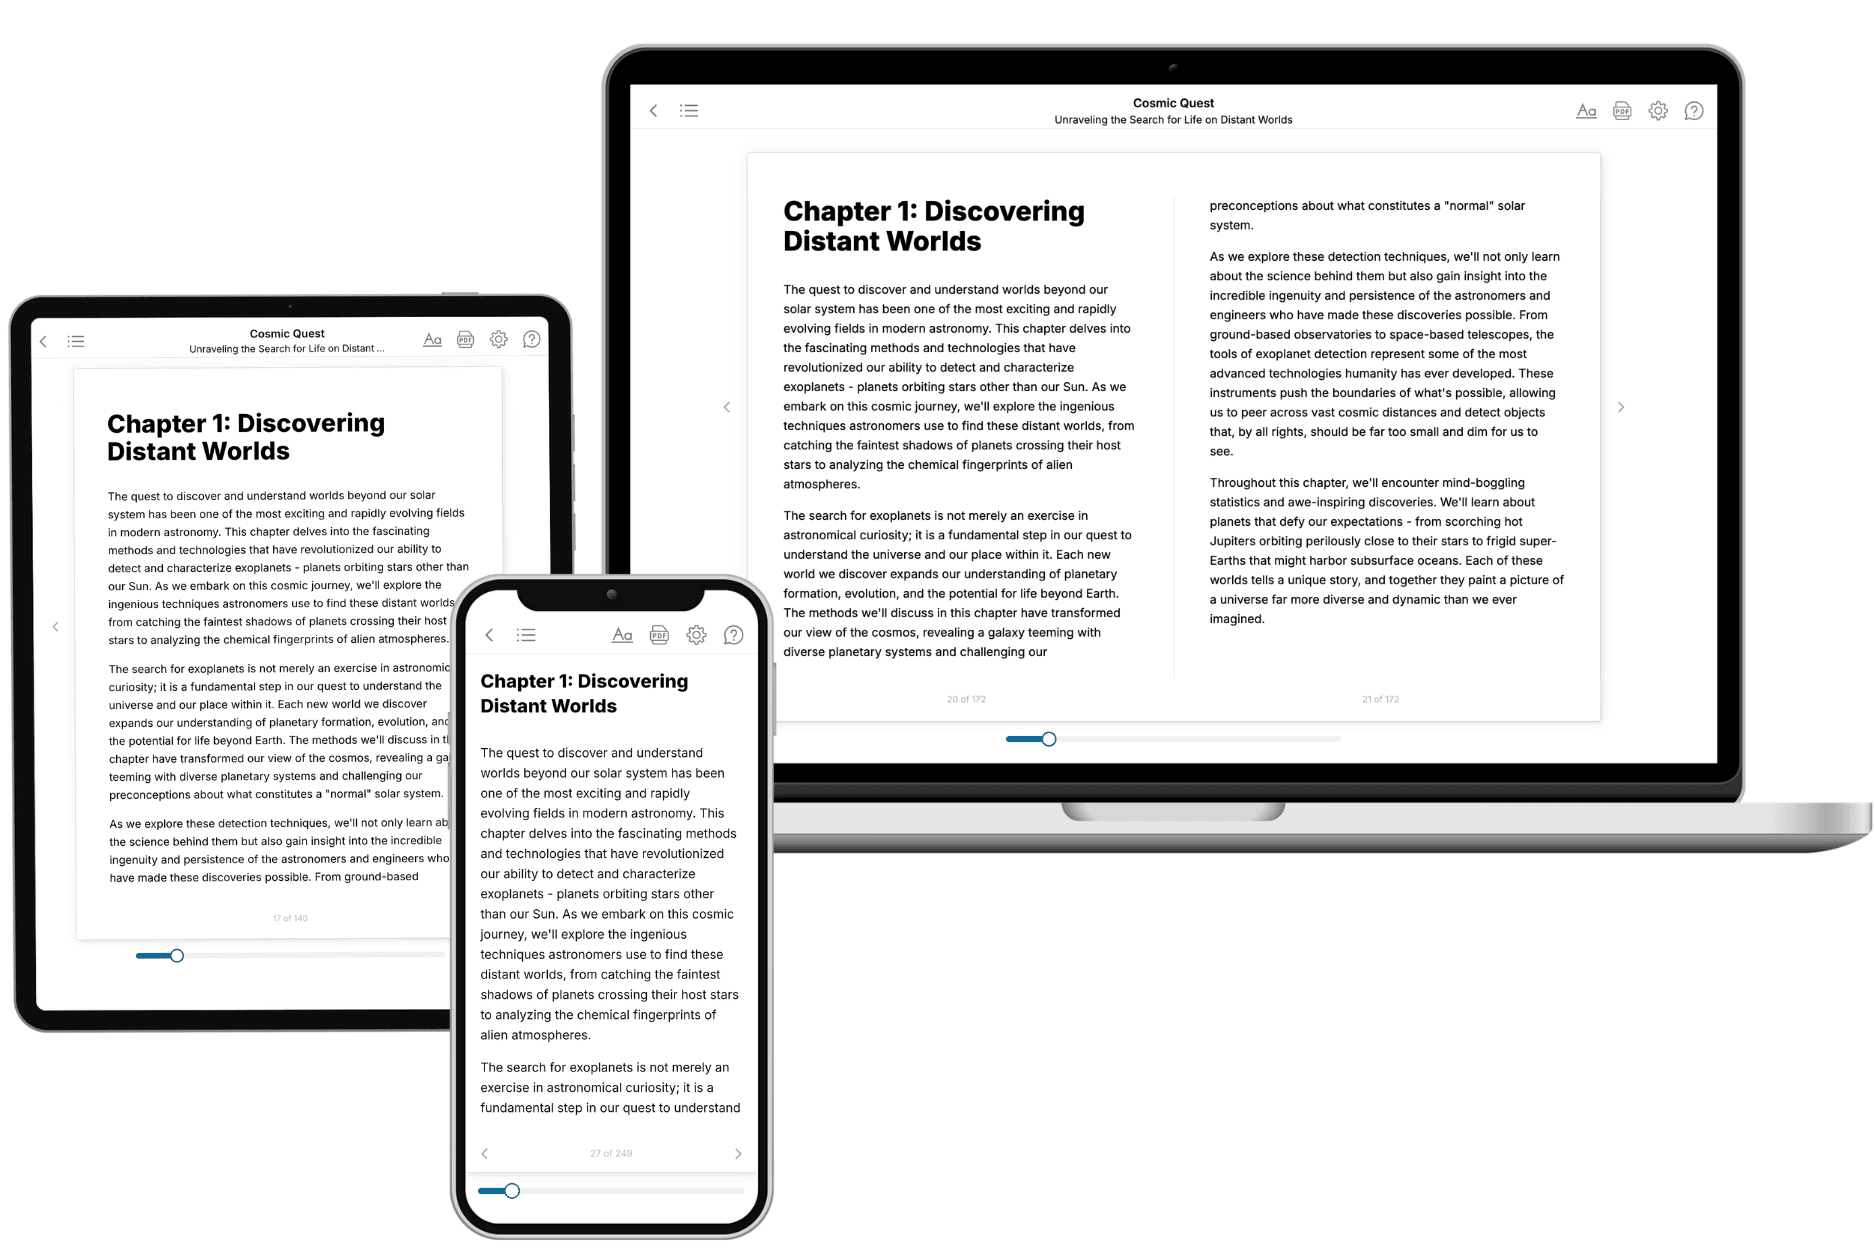
Your book is ready in 10 minutes. Read it online, download as EPUB or PDF, or send to Kindle.

Frequently asked questions
- What is TailoredRead?
TailoredRead creates complete, full-length nonfiction ebooks, written specifically for you. Tell us what you want to learn and why, and TailoredRead writes you a complete ebook on it, with charts, tables, and diagrams throughout. Read it online, on Kindle, or on any e-reader, or download it as a PDF or EPUB. Every book is written fresh the day you order it.
- How is the book tailored to me?
Before anything is written, you answer a few short questions about your goals, your background, and the topics you care about. Your book is then planned around your answers: written at your level, focused on your goals, and covering the topics you chose, instead of the one-size-fits-all book a store sells everyone.
- Will it read like generic AI content?
No. Your book isn't a chat transcript: it's planned chapter by chapter before a single word is written, told in a clear book voice, and explains ideas visually with charts, tables, and diagrams. After writing, every book goes through an editorial pass that polishes chapters so the book reads consistent from start to finish. Judge for yourself: browse thousands of sample books on our Explore Books page.
- How accurate is the content?
Our AI first checks whether your subject needs live research. Niche and fast-moving subjects are researched before writing, and the book plan and chapters are grounded in what it finds. After writing, every book goes through a quality pass that checks its facts and consistency, and researched books list their sources in a Notes section at the back.
- How long is the book?
You choose the length: Comprehensive (250-300 pages), Detailed (150-200 pages), Essential (70-100 pages), or Short (30-50 pages).
- Does the book include visuals?
Yes. Every book includes charts, tables, and diagrams: timelines, checklists, step-by-step guides, decision trees, comparison tables, matrices, and bar charts. A typical book includes dozens of these visual elements.
- Can I read it on Kindle? What formats can I download?
Yes. Every book can be read in our online reader or downloaded as a PDF or EPUB. The EPUB can be opened with Kindle, Apple Books, Kobo, and any e-reader. The Commercial and Author licenses also include an editable Word (DOCX) and Markdown download.
- How much does it cost?
About the price of a regular ebook. The exact price depends on your book's length and complexity, from $2 for the shortest books to $35 for the most comprehensive, and it's shown when you review your book, before you commit to anything. Each book is a one-time purchase, yours to keep, no subscription. Licenses that let you share, teach, or publish your book range from $35.99 to $49.99.
- Can I preview the book before purchasing?
Before you pay, you'll see what your book will cover: the title, a detailed description, the estimated length, and the complete chapter-by-chapter table of contents, so you know what you're getting before you decide. The full text itself is written after you purchase.
- How long does it take to create a book?
About 10 minutes. You can start reading the opening chapters while the rest is still being written.