Handling Missing Data
Practical Imputation Techniques for Complete Statistical Analysis
Complete datasets are rare in real-world research.
222 pages10 chaptersJul 22, 2026Statistics
About this book
Missing values can silently undermine your statistical conclusions, introduce bias, and lead to invalid inferences. This book equips you with the knowledge and practical skills to handle missing data strategically. You'll learn why missing data occurs, how to diagnose its patterns, and which imputation technique works best for your specific situation. From simple approaches like mean imputation to advanced methods like multiple imputation and machine learning-based techniques, you'll understand not just how to apply each method, but when and why to use it. This guide bridges theory and practice, combining statistical foundations with hands-on implementation guidance. You'll discover how to validate your imputations, assess sensitivity to different assumptions, and communicate your approach to stakeholders. Whether you're analyzing survey data, clinical trials, or observational studies, you'll gain confidence in producing reliable, defensible results even when your data is incomplete.
Table of contents
- IntroductionWhy Missing Data Matters in Your Analysis, What You'll Learn in This Book, How to Use This GuideRead below
- Chapter 1: Understanding Missing DataTypes of Missingness: MCAR, MAR, and MNAR, Common Causes of Missing Data in Real Datasets, How Missing Data Affects Your Statistical Results, Assessing the Extent and Pattern of Missingness
- Chapter 2: Exploratory Analysis of Missing DataVisualizing Missing Data Patterns, Quantifying Missingness: Percentages and Distributions, Analyzing Correlations Between Missing Values, Diagnostic Tools and Software for Missing Data Assessment
- Chapter 3: Simple Imputation MethodsMean, Median, and Mode Imputation, Forward Fill and Backward Fill for Time Series, Last Observation Carried Forward (LOCF), Limitations and Bias in Simple Imputation Approaches
- Chapter 4: Regression-Based ImputationRegression Imputation: Predicting Missing Values, Stochastic Regression Imputation with Residuals, Multivariate Regression Approaches, Implementation Examples in R and Python
- Chapter 5: Multiple Imputation MethodsThe Multiple Imputation Framework, MICE: Multivariate Imputation by Chained Equations, Rubin's Rules for Combining Multiple Imputations, Determining the Optimal Number of Imputations
- Chapter 6: Advanced Imputation TechniquesK-Nearest Neighbors Imputation, Iterative Imputation Algorithms, Machine Learning Approaches to Imputation, Expectation-Maximization and Maximum Likelihood Methods
- Chapter 7: Choosing the Right Imputation MethodDecision Framework for Method Selection, Matching Methods to Your Data Characteristics, Aligning Imputation Strategy with Your Analysis Goals, Practical Considerations: Computational Cost and Complexity
- Chapter 8: Validation and Sensitivity AnalysisValidating the Quality of Your Imputations, Sensitivity Analysis: Testing Robustness to Assumptions, Comparing Results Across Different Imputation Methods, Diagnostic Checks and Quality Assurance
- Chapter 9: Software Implementation and ToolsR Packages for Missing Data Imputation, Python Libraries and Scikit-Learn Integration, Other Statistical Software and Specialized Tools, Integrating Imputation into Your Analysis Workflow
- Chapter 10: Real-World Case StudiesCase Study 1: Survey Data with Item Nonresponse, Case Study 2: Clinical Trial Data with Dropout, Case Study 3: Longitudinal Study with Attrition
- ConclusionKey Takeaways and Best Practices, Moving Forward with Confidence
- Glossary of Terms
- Further Reading and Resources
Introduction
Real datasets are almost never complete. A survey respondent skips a sensitive income question. A patient drops out of a clinical trial after week four. A sensor malfunctions and leaves a gap in an otherwise continuous time series. These are not edge cases or signs of poor study design. They are the normal texture of data collected from the real world, and they show up in virtually every domain where data is gathered and analyzed. The question is not whether your data will have missing values. The question is what you plan to do about them.
The default response in many analyses is to simply drop any row with a missing value and proceed with the remaining complete cases. This approach feels clean and safe, but it carries real costs. Depending on how and why values are missing, a complete-case analysis can produce estimates that are systematically biased, standard errors that are too narrow, and conclusions that do not hold up when scrutinized. A study that starts with 1,200 participants but analyzes only 740 complete cases has not just lost data. It may have lost the data in a non-random way, quietly distorting every result that follows.[1]
Imputation offers a different path. Rather than discarding incomplete records, imputation fills in plausible values based on the information available elsewhere in the dataset. Done well, it preserves sample size, reduces bias, and allows you to make valid inferences from data that would otherwise be wasted. Done poorly, it can introduce its own distortions, sometimes worse than the ones it was meant to fix. The difference between good and poor imputation comes down to understanding the mechanism behind the missingness, choosing a method that fits the data structure, and validating the results honestly. That is exactly what this book is designed to help you do.
The chapters ahead move from foundational concepts to practical implementation. The goal throughout is not to make imputation seem more complicated than it needs to be, but to give you enough understanding of what each method actually does so that you can apply it with confidence and defend your choices when it matters. Whether you are working in R, Python, or another statistical environment, the core ideas translate directly into code you can run on your own data.
Why Missing Data Matters in Your Analysis
Missing data is not a neutral inconvenience. It actively shapes the conclusions you draw, often in ways that are invisible unless you look for them. Consider a workplace health survey where employees with high stress levels are less likely to complete the burnout section of the questionnaire. If you analyze only the completed responses, your estimate of average burnout will be too low. The people most affected by the phenomenon you are studying are systematically underrepresented in your results. This is not a sampling problem you can fix after the fact with a larger dataset. It is a structural bias baked into the analysis.
The statistical consequences of ignoring missing data fall into a few predictable categories. The most common is bias in point estimates. When the probability of a value being missing is related to the value itself or to other variables in the dataset, complete-case analysis produces estimates that do not reflect the true population. A second consequence is variance attenuation. Simple imputation methods like mean imputation replace missing values with a single constant, which artificially reduces the spread of the variable and makes relationships between variables appear weaker than they actually are.[2]
A third consequence is invalid standard errors and confidence intervals. When you impute a single value for each missing observation and then analyze the completed dataset as if it were fully observed, you are treating imputed values as known facts. This ignores the uncertainty introduced by the imputation itself, which causes standard errors to be underestimated and confidence intervals to be too narrow. The result is a false sense of precision that can lead to incorrect conclusions about statistical significance.
To make this concrete, consider a regression model predicting hospital readmission rates. If the variable measuring patient income is missing for 20% of the sample, and lower-income patients are both more likely to be readmitted and less likely to have income recorded, then dropping those cases will underestimate the true effect of income on readmission. A policy recommendation built on that analysis could systematically underserve the patients who need the most support.
The good news is that these problems are solvable. Modern imputation methods, when applied correctly, can recover most of the information lost to missingness and produce estimates that are much closer to what you would have obtained from a complete dataset. The key is matching the method to the mechanism. A method that works well when data is Missing Completely at Random may perform poorly when data is Missing Not at Random. Understanding that distinction is the first step toward making defensible analytical choices.
Missing data also matters for reproducibility and transparency. Reviewers, collaborators, and stakeholders increasingly expect analysts to document how missing values were handled, not just mention it in a footnote. A clear, principled approach to imputation is part of what makes an analysis credible and replicable. Treating it as an afterthought is a risk that shows up in peer review, audit, and replication studies.
Finally, the scale of the problem is worth acknowledging. Studies across social science, medicine, and economics routinely report missing data rates of 10% to 40% on key variables.[3] At those levels, the choice of how to handle missingness is not a minor methodological detail. It is one of the most consequential decisions in the entire analysis pipeline.
A dataset with 30% missing values on a key predictor is not a dataset with a small problem. It is a dataset where nearly one in three observations is telling you something important about why that value is absent, and ignoring that signal is a choice with real consequences.
What You'll Learn in This Book
This book is organized around the full workflow of handling missing data, from diagnosis through implementation and validation. Each chapter builds on the previous one, but the structure also allows you to jump to the section most relevant to your current problem. The progression moves from understanding to action, and from simpler methods to more sophisticated ones, with honest discussion of the tradeoffs at each step.
The first part of the book focuses on understanding and diagnosing missing data. Before choosing any imputation method, you need to know what kind of missingness you are dealing with. The chapter on understanding missing data introduces the three core missingness mechanisms: Missing Completely at Random, Missing at Random, and Missing Not at Random. These are not just theoretical categories. They determine which methods are statistically valid and which will produce biased results. The chapter on exploratory analysis then shows you how to visualize and quantify missingness patterns using tools like missingness heatmaps and correlation analysis, so you can move from suspicion to evidence.
The second part covers imputation methods in order of complexity. Simple imputation methods like mean imputation, median imputation, mode imputation, forward fill, backward fill, and Last Observation Carried Forward are covered first. These methods are fast and easy to implement, and they are appropriate in specific situations. But they also carry well-documented limitations, particularly around variance attenuation and bias, which the chapter addresses directly. Knowing when not to use a simple method is just as important as knowing how to apply it.
Regression-based imputation comes next, covering both deterministic regression imputation and stochastic regression imputation with residuals. These methods use the relationships between variables to generate more informed predictions of missing values. The chapter on multiple imputation then introduces the full framework, including Multivariate Imputation by Chained Equations and Rubin's Rules for combining results across imputed datasets. Multiple imputation is the current gold standard for many analytical contexts, and the chapter explains both the mechanics and the practical decisions involved, such as how many imputations to generate.
The advanced techniques chapter covers methods that go beyond classical statistics, including K-Nearest Neighbors imputation, iterative imputation algorithms, machine learning approaches like MISSFOREST, and the Expectation-Maximization algorithm with maximum likelihood estimation for missing data. These methods can handle complex, nonlinear relationships between variables and often outperform simpler approaches on messy real-world data. The chapter is honest about their computational cost and the conditions under which they are worth that cost.
The third part of the book focuses on decision-making and validation. The imputation method selection framework chapter gives you a structured way to choose among methods based on your data characteristics, missingness mechanism, and analysis goals. The validation chapter then shows you how to assess whether your imputations are plausible, how to run sensitivity analysis for imputation to test whether your conclusions hold under different assumptions, and how to compare results across methods. These steps are often skipped in practice, but they are what separates a defensible analysis from one that could be undermined by a single pointed question.
The software chapters cover practical implementation in R and Python, including the mice R package, scikit-learn SimpleImputer, and scikit-learn IterativeImputer, among other tools. Code examples are integrated throughout the book, not isolated in a separate appendix, so you can see how the concepts translate directly into working implementations.
The book closes with three real-world case studies covering survey item nonresponse, clinical trial dropout, and longitudinal attrition. Each case study walks through the full workflow: diagnosing the missingness, selecting a method, implementing it, and validating the results. These are the kinds of problems you are likely to encounter in practice, and seeing the full decision process applied to realistic data is often more instructive than any amount of abstract explanation.
Throughout all of this, the emphasis is on building genuine understanding rather than mechanical recipe-following. Imputation methods are tools, and like any tool, they work well when used appropriately and poorly when misapplied. The goal is to give you the judgment to tell the difference.
How to Use This Guide
This book is written for intermediate data analysts, researchers, and statisticians who already have a working knowledge of basic statistics and data analysis. You do not need to be a machine learning expert or a theoretical statistician to get value from it. If you understand concepts like regression, confidence intervals, and the basics of probability, you have the foundation needed to follow every chapter. The more advanced sections build on that foundation rather than assuming it away.
If you are new to missing data as a topic, the recommended path is to read the book sequentially. The chapters on understanding missing data and exploratory analysis establish the conceptual vocabulary that everything else depends on. Jumping straight to multiple imputation without understanding the difference between Missing at Random and Missing Not at Random is like trying to choose a medication without knowing the diagnosis. The early chapters are not just background. They are the analytical foundation.
If you are already familiar with the basics and have a specific problem to solve, the book is designed to support non-linear reading as well. The following guide maps common situations to the most relevant chapters:
- You need to quickly assess how bad your missing data problem is: Start with the chapter on exploratory analysis of missing data, particularly the sections on visualizing patterns and quantifying missingness.
- You are working with time series data and need a fast solution: The sections on forward fill, backward fill, and Last Observation Carried Forward in the simple imputation chapter are your starting point, along with the limitations discussion that follows.
- You need a statistically rigorous approach for a research publication: The chapters on multiple imputation and Rubin's Rules are the core, supplemented by the validation and sensitivity analysis chapter.
- You are working with a large, complex dataset with many variables: The advanced techniques chapter, particularly the sections on MISSFOREST and iterative imputation algorithms, addresses high-dimensional settings.
- You are not sure which method to use: The imputation method selection framework chapter is designed specifically for this situation and provides a structured decision process.
- You need working code right away: The software implementation chapter and the code examples embedded throughout the methods chapters give you ready-to-adapt implementations in R and Python.
The code examples in this book use R and Python, the two most widely used environments for statistical analysis and data science. Where possible, both languages are shown for the same task so you can work in whichever environment fits your workflow. The R examples make heavy use of the mice package, which is the most comprehensive and well-documented tool for multiple imputation in R. The Python examples use scikit-learn's imputation classes as the primary framework, with references to other libraries where they offer meaningful advantages.
A note on the relationship between theory and practice throughout this book: every method is explained in terms of what it actually does to your data, not just how to call a function. This matters because imputation methods can produce results that look reasonable on the surface but are statistically inappropriate for your situation. Understanding the mechanism behind each method is what allows you to catch those problems before they affect your conclusions. The goal is not to make you a theoretician. It is to give you enough understanding to be a careful practitioner.
Each chapter ends with practical takeaways and, where relevant, diagnostic questions you can apply to your own data. These are not summaries of what was covered. They are forward-looking prompts designed to help you connect the chapter's content to your specific analytical context. The most useful thing you can do while reading is to keep a real dataset in mind and ask, at each step, how the concepts apply to your own situation.
The case studies in the final chapter are worth reading even if your domain is different from the ones covered. Survey item nonresponse, clinical trial dropout, and longitudinal attrition each present a distinct combination of missingness mechanism, data structure, and analytical goal. Seeing how the same general framework produces different specific decisions across these three contexts is one of the clearest illustrations of why judgment matters as much as method knowledge.
One practical suggestion: before you start any imputation, document your assumptions. Write down why you believe the data is missing in the way it appears to be, which mechanism you are assuming, and why you chose the method you did. This documentation serves two purposes. It forces you to think carefully before acting, which often surfaces problems early. And it gives you a record you can refer back to when you run sensitivity analysis or when a reviewer asks you to justify your approach. The analysts who handle missing data most effectively are not necessarily the ones who know the most methods. They are the ones who are most deliberate about the choices they make.
Missing data handling has matured considerably as a field over the past three decades. Methods that were once considered advanced, like multiple imputation, are now standard practice in clinical research and increasingly expected in social science and economics as well.[4] The tools available in R and Python have made these methods accessible to analysts who are not statisticians by training. What has not kept pace is the practical guidance on how to apply these tools thoughtfully, how to validate the results, and how to communicate the approach clearly. That gap is what this book is designed to close.
Notes
Introduction
- 1. Roderick Little and Donald Rubin, Statistical Analysis with Missing Data, Wiley, 2002
- 2. Paul Allison, "Missing Data," Sage Publications, 2001
- 3. James Sterne and others, "Multiple imputation for missing data in epidemiological and clinical research," BMJ, 2009
- 4. Stef van Buuren, Flexible Imputation of Missing Data, CRC Press, 2018
This is the end of the free sample. The full book has 10 chapters.
Want this book written for you?
Tell us your goals and background, and get your own version of this book, tailored by AI to you.


Benefits of AI-tailored books
- Read one book, not ten:
- all the Statistics knowledge you need, gathered into a single book.
- Save days of learning:
- tell us your goals, choose your topics, and the whole book is built around them.
- Learn effortlessly:
- Statistics book written for your specific background and expertise.
- Understand at a glance:
- includes charts, tables, timelines, checklists, decision trees, and more.
- Stay current:
- written the day you order it, not years ago.
- Trust what you read:
- every book is checked for accuracy, with real research when your subject needs it.
Create your unique book in 3 steps
- 1. Select your focus
Select the focus of your Statistics book and share your background
- 2. Personalize your book
Specify your goals and choose sub-topics to include
- 3. Get your tailored book
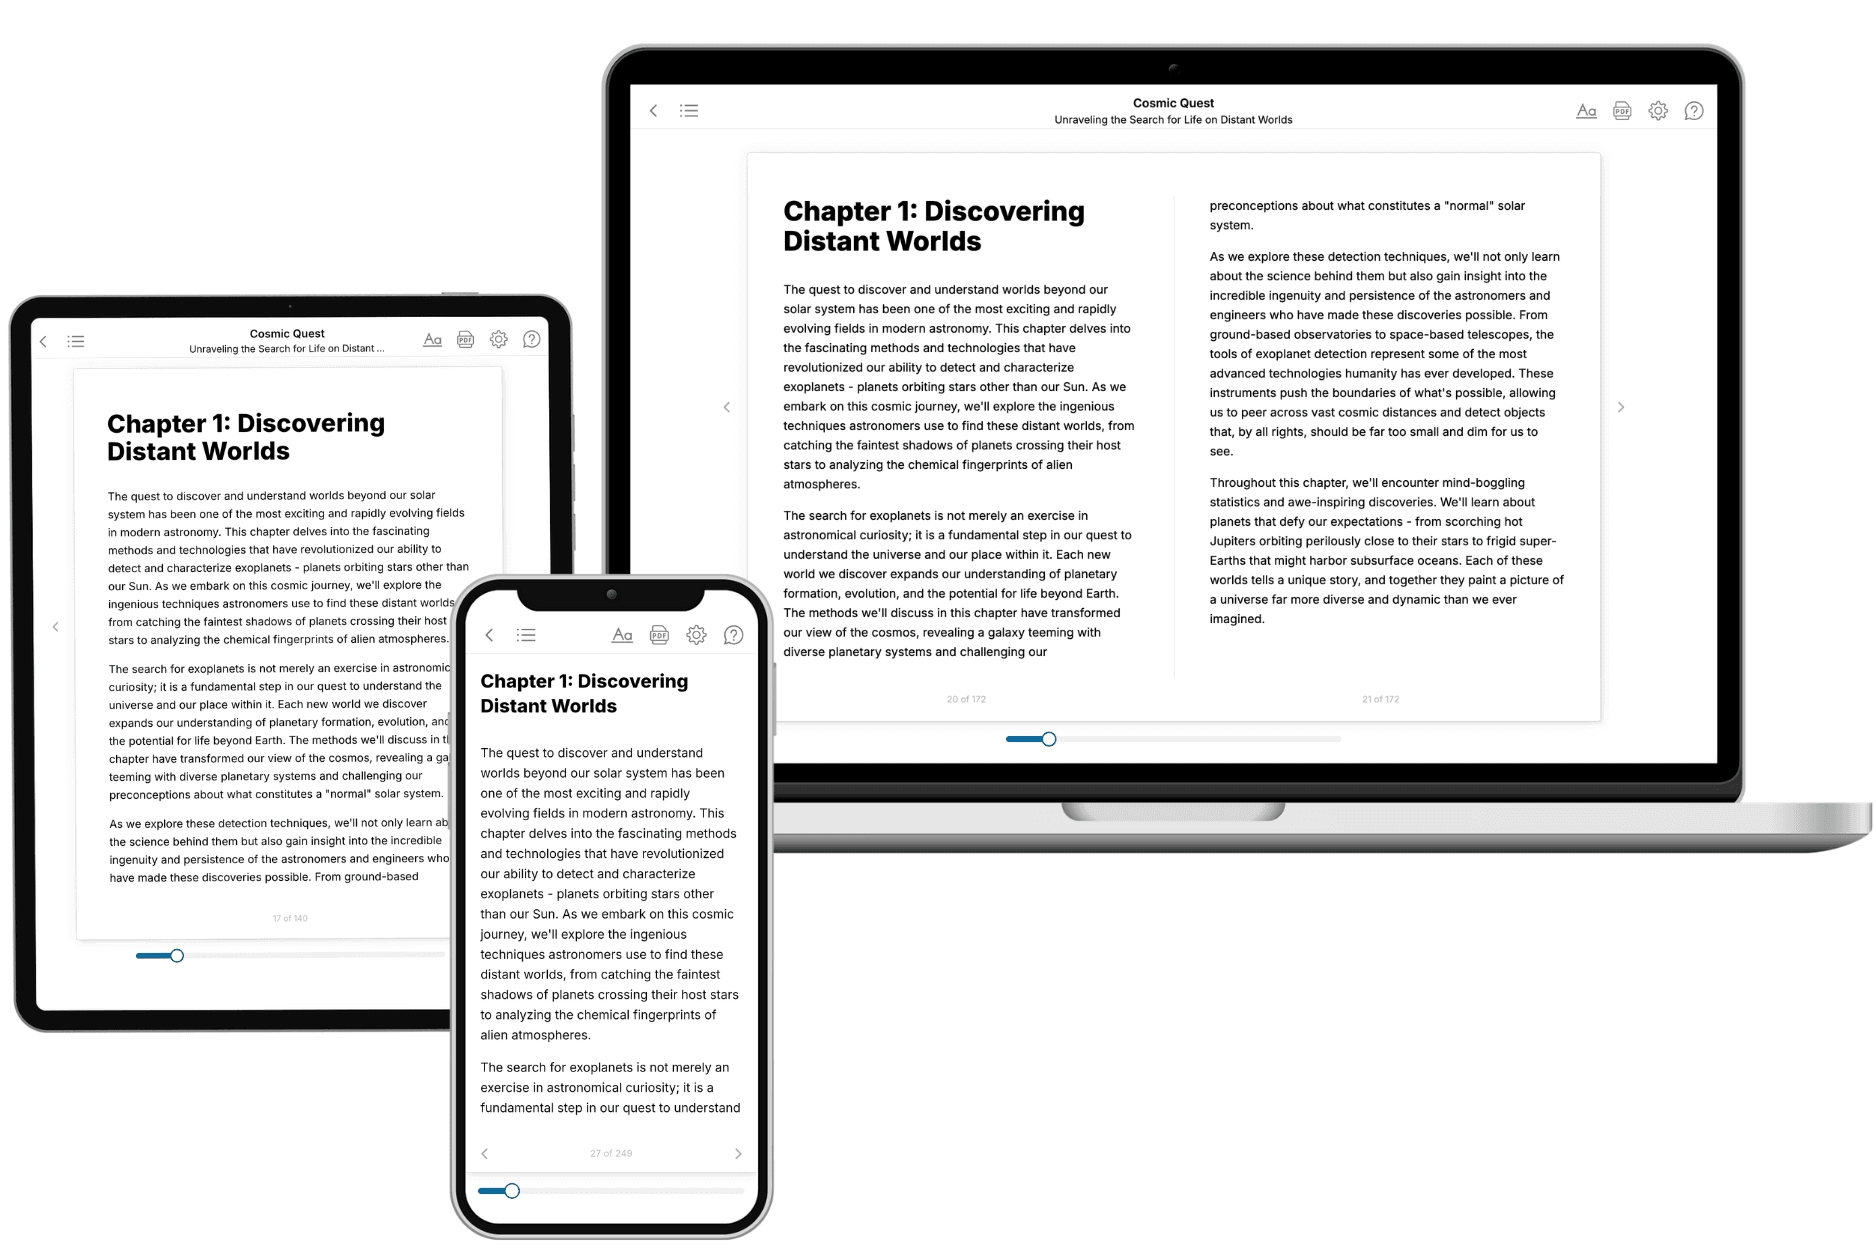
Your book is ready in 10 minutes. Read it online, download as EPUB or PDF, or send to Kindle.

Frequently asked questions
- What is TailoredRead?
TailoredRead creates complete, full-length nonfiction ebooks, written specifically for you. Tell us what you want to learn and why, and TailoredRead writes you a complete ebook on it, with charts, tables, and diagrams throughout. Read it online, on Kindle, or on any e-reader, or download it as a PDF or EPUB. Every book is written fresh the day you order it.
- How is the book tailored to me?
Before anything is written, you answer a few short questions about your goals, your background, and the topics you care about. Your book is then planned around your answers: written at your level, focused on your goals, and covering the topics you chose, instead of the one-size-fits-all book a store sells everyone.
- Will it read like generic AI content?
No. Your book isn't a chat transcript: it's planned chapter by chapter before a single word is written, told in a clear book voice, and explains ideas visually with charts, tables, and diagrams. After writing, every book goes through an editorial pass that polishes chapters so the book reads consistent from start to finish. Judge for yourself: browse thousands of sample books on our Explore Books page.
- How accurate is the content?
Our AI first checks whether your subject needs live research. Niche and fast-moving subjects are researched before writing, and the book plan and chapters are grounded in what it finds. After writing, every book goes through a quality pass that checks its facts and consistency, and researched books list their sources in a Notes section at the back.
- How long is the book?
You choose the length: Comprehensive (250-300 pages), Detailed (150-200 pages), Essential (70-100 pages), or Short (30-50 pages).
- Does the book include visuals?
Yes. Every book includes charts, tables, and diagrams: timelines, checklists, step-by-step guides, decision trees, comparison tables, matrices, and bar charts. A typical book includes dozens of these visual elements.
- Can I read it on Kindle? What formats can I download?
Yes. Every book can be read in our online reader or downloaded as a PDF or EPUB. The EPUB can be opened with Kindle, Apple Books, Kobo, and any e-reader. The Commercial and Author licenses also include an editable Word (DOCX) and Markdown download.
- How much does it cost?
About the price of a regular ebook. The exact price depends on your book's length and complexity, from $2 for the shortest books to $35 for the most comprehensive, and it's shown when you review your book, before you commit to anything. Each book is a one-time purchase, yours to keep, no subscription. Licenses that let you share, teach, or publish your book range from $35.99 to $49.99.
- Can I preview the book before purchasing?
Before you pay, you'll see what your book will cover: the title, a detailed description, the estimated length, and the complete chapter-by-chapter table of contents, so you know what you're getting before you decide. The full text itself is written after you purchase.
- How long does it take to create a book?
About 10 minutes. You can start reading the opening chapters while the rest is still being written.