The Infographic Design Handbook
Master the Art of Visual Storytelling for Brands
Imagine your brand's complex data and insights transformed into visuals that stop scrolls, spark conversations, and stick in minds.
222 pages10 chaptersApr 1, 2026Graphic Design
About this book
That's the power of strategic infographic design. This handbook bridges the gap between basic graphic design and specialized infographic creation, giving you a complete system for designing visuals that inform, persuade, and inspire action. You'll learn how to analyze data like a strategist, structure information for maximum clarity, and apply design principles that transform numbers into narratives. Whether you're visualizing market trends, explaining processes, or comparing options, you'll discover proven frameworks and real-world techniques that work across industries. This isn't about making pretty pictures—it's about creating infographics that serve your brand's goals while respecting your audience's time and intelligence. Master the intersection of data, design, and strategy to become the infographic designer your organization needs.
Table of contents
- IntroductionWhy Infographics Matter in Modern Brand Design, What You'll Learn in This Handbook, How to Use This Book for Maximum ImpactRead below
- Chapter 1: The Strategic Foundation of Infographic DesignInfographics as Strategic Brand Tools, Defining Your Infographic Goals and Objectives, Understanding Your Audience and Their Needs, Aligning Infographics with Overall Brand Strategy
- Chapter 2: Data Analysis and Information ArchitectureGathering and Validating Your Data, Identifying Key Insights and Story Angles, Structuring Information Hierarchy, Choosing the Right Infographic Type for Your Data
- Chapter 3: Visual Hierarchy and Design PrinciplesCreating Visual Hierarchy That Guides Attention, Balance and Composition in Infographic Layouts, Whitespace and Breathing Room, Contrast and Emphasis Techniques
- Chapter 4: Color Strategy and PsychologyColor Theory Fundamentals for Infographics, Integrating Brand Colors Effectively, Color Psychology and Audience Perception, Accessibility and Color Contrast Standards
- Chapter 5: Typography and Text IntegrationChoosing Fonts That Enhance Readability, Text Hierarchy and Strategic Sizing, Writing Clear, Concise Copy for Infographics, Effective Labels and Annotations
- Chapter 6: Infographic Types and Design ApproachesTimeline Infographics: Showing Progression and History, Comparison Infographics: Side-by-Side Analysis, Process Infographics: Step-by-Step Explanations, Statistical Infographics: Data Visualization Best Practices
- Chapter 7: Icons, Illustrations, and Visual ElementsIcon Design and Visual Consistency, Custom Illustrations vs. Stock Elements, Creating Visual Metaphors and Symbols, Maintaining Visual Style Across Infographics
- Chapter 8: Brand Consistency and Design SystemsBuilding an Infographic Design System, Applying Brand Guidelines to Infographics, Creating Templates for Scalability, Maintaining Consistency Across Platforms
- Chapter 9: Tools, Software, and WorkflowDesign Software Overview and Selection, Data Visualization Tools and Plugins, Building an Efficient Design Workflow, Collaboration and Feedback Tools
- Chapter 10: Testing, Iteration, and OptimizationUser Testing Methods for Infographics, Measuring Infographic Effectiveness and Impact, Gathering and Implementing Feedback, Iterating for Continuous Improvement
- ConclusionKey Takeaways for Infographic Designers, Your Next Steps Forward
- Glossary of Infographic Design Terms
- Further Reading and Resources
Introduction
Every day, people scroll past hundreds of pieces of content without stopping. A wall of text rarely breaks that pattern. A well-designed infographic often does. There is something almost instinctive about the way the human brain responds to visual information. Research from MIT suggests that the brain can process images in as little as 13 milliseconds, making visual communication one of the fastest pathways to understanding.[1] Infographics tap directly into that speed, turning complex data and ideas into something a viewer can grasp almost immediately.
But speed alone does not make an infographic effective. The design world is full of visuals that look impressive at first glance yet leave viewers more confused than informed. A chart with too many variables, a color palette that clashes with the brand, or a layout that buries the key insight under decorative noise — these are not just aesthetic failures. They are communication failures. The goal of this handbook is to help you avoid those failures by building a complete, practical understanding of what makes infographics work at every level, from strategy to execution.
This book is written for designers, brand strategists, and marketing professionals who already have a foundation in visual design and want to go deeper into the specialized craft of infographic creation. You are not starting from zero. You understand design principles, you work with brands, and you know how to use the tools. What this handbook offers is a structured system for applying that knowledge specifically to infographics — a format that sits at the intersection of data, storytelling, and brand communication. The chapters ahead will take you through that system step by step, from the strategic thinking that happens before you open any software to the testing and iteration that happens after a piece goes live.
Think of this handbook less as a rulebook and more as a professional framework. The principles here are grounded in research, real-world practice, and the kind of hard-won experience that comes from designing infographics that actually get used, shared, and remembered. Whether you are creating a one-page data visualization for a client pitch or building a scalable infographic system for a major brand, the thinking behind every chapter applies. The goal is not just to make you a better designer. It is to make you a more strategic one.
Why Infographics Matter in Modern Brand Design
The volume of information competing for attention online has never been higher. Brands are publishing blog posts, videos, social media updates, podcasts, and newsletters at a pace that would have seemed impossible a decade ago. In that environment, standing out requires more than good content. It requires content that communicates quickly, clearly, and memorably. Infographics are uniquely positioned to do all three at once, which is why they have become one of the most valuable tools in a brand's content arsenal.
The numbers support this. According to HubSpot, infographics are among the top four content types used by B2B marketers, and content with relevant visuals gets 94% more views than content without them.[2] Publishers who use infographics grow their traffic an average of 12% more than those who do not. These are not marginal gains. They reflect a fundamental truth about how people consume information in digital environments: they scan before they read, and they engage with what catches their eye first.
Beyond traffic and engagement, infographics serve a deeper brand function. When a brand consistently produces well-designed, accurate, and visually coherent infographics, it builds a reputation for clarity and expertise. Consider how brands like McKinsey, the World Health Organization, or National Geographic use infographics not just to share data but to signal authority. Their visuals say, implicitly, that they understand their subject well enough to simplify it without distorting it. That is a powerful brand message delivered without a single word of copy.
Infographics also have a longer shelf life than most content formats. A well-researched infographic on industry trends or a process explanation can remain relevant and shareable for months or even years. Unlike a social media post that disappears in a feed within hours, a strong infographic gets saved, embedded in articles, shared in newsletters, and referenced in presentations. This extended reach makes infographics one of the highest-return content investments a brand can make, especially when the design is built to be repurposed across platforms.
There is also a trust dimension that is easy to overlook. When data is presented visually with clear sourcing and honest representation, it signals transparency. Audiences are increasingly skeptical of branded content, and an infographic that presents information fairly, without cherry-picking or distorting scale, builds credibility in a way that promotional copy rarely can. Conversely, a misleading infographic — one that manipulates chart axes or omits context — can damage a brand's reputation quickly, especially in an era when audiences are more data-literate than ever before.
Finally, infographics are inherently shareable in a way that most content is not. They are self-contained, visually complete, and easy to understand without additional context. Someone can share an infographic on LinkedIn or Pinterest and their audience will get the point without needing to read a full article. This shareability is not accidental. It is a design outcome. When an infographic is structured well, with a clear headline, a logical flow, and a memorable visual hook, sharing it becomes a natural response. That is the kind of organic reach that no advertising budget can fully replicate.
Key insight: Infographics are not just a design format. They are a strategic communication tool that, when executed well, builds brand authority, drives engagement, and earns trust simultaneously.
What You'll Learn in This Handbook
This handbook is organized as a complete system, not a collection of tips. Each chapter builds on the one before it, moving from strategic thinking through design execution and into measurement and refinement. By the time you reach the final chapter, you will have a working framework for approaching any infographic project with confidence, regardless of the industry, the data type, or the platform.
Here is a clear picture of what each section covers:
- Strategic Foundation (Chapter 1): How to position infographics as brand tools, define clear goals, understand your audience, and align your visual communication with broader brand strategy.
- Data and Information Architecture (Chapter 2): How to gather and validate data, identify the story within the numbers, structure information hierarchically, and choose the right infographic format for your content.
- Visual Hierarchy and Design Principles (Chapter 3): How to guide viewer attention through layout, balance, whitespace, contrast, and composition.
- Color Strategy and Psychology (Chapter 4): How to use color theory, integrate brand palettes, apply psychological principles, and meet accessibility standards.
- Typography and Text Integration (Chapter 5): How to choose fonts, establish text hierarchy, write concise copy, and use labels and annotations effectively.
- Infographic Types and Design Approaches (Chapter 6): Specific design strategies for timelines, comparisons, process flows, and statistical visualizations.
- Icons, Illustrations, and Visual Elements (Chapter 7): How to design or select icons, decide between custom and stock elements, create visual metaphors, and maintain a consistent visual style.
- Brand Consistency and Design Systems (Chapter 8): How to build infographic design systems, apply brand guidelines, create scalable templates, and maintain consistency across platforms.
- Tools, Software, and Workflow (Chapter 9): An overview of design and data visualization tools, plus strategies for building an efficient, collaborative workflow.
- Testing, Iteration, and Optimization (Chapter 10): How to test infographics with real users, measure effectiveness, gather feedback, and iterate toward better results.
Each chapter is built around practical application. You will find concrete examples, real-world scenarios, frameworks you can apply immediately, and guidance on common mistakes to avoid. The goal is not to give you abstract theory but to give you tools you can use on your next project.
One of the most important things you will develop through this handbook is a designer's instinct for when an infographic is the right choice and why. Not every piece of information benefits from visual treatment. Part of becoming a skilled infographic designer is knowing the difference between data that wants to be visualized and data that is better served by a table, a paragraph, or a different format entirely. That judgment is a skill, and this handbook will help you build it.
You will also develop a stronger understanding of the relationship between design and data integrity. One of the most common failures in infographic design is prioritizing visual appeal over accuracy. A beautiful chart that misrepresents the data is worse than no chart at all. Throughout this handbook, data accuracy and honest representation are treated as non-negotiable design requirements, not optional considerations. This is not just an ethical position. It is a practical one, because audiences and clients who catch errors lose trust quickly and rarely give second chances.
By the end of this handbook, you should be able to take a raw dataset or a complex idea, identify the story it contains, choose the right visual format, design it with clarity and brand alignment, and measure whether it achieved its purpose. That is the complete infographic design skill set, and it is what separates designers who make pretty pictures from designers who create strategic communication tools.
What success looks like: A viewer encounters your infographic, understands the key message within seconds, trusts the information presented, and feels compelled to share it or act on it. Every design decision in this handbook is oriented toward that outcome.
How to Use This Book for Maximum Impact
This handbook is designed to be used, not just read. The distinction matters. Reading through it once will give you a solid conceptual foundation, but the real value comes from applying the frameworks and techniques to actual projects as you go. The most effective way to use this book is to treat each chapter as a working session, not a passive reading experience.
There are a few different ways to approach the material depending on where you are in your practice:
- If you are starting a new infographic project right now: Read Chapters 1 and 2 first to establish your strategic and structural foundation, then jump to the specific chapter that addresses your current challenge (color, typography, a specific infographic type, etc.).
- If you are building or refining a design system for a brand: Focus on Chapters 1, 8, and 9, which cover strategy, brand consistency, and workflow. These chapters will give you the frameworks for creating scalable, repeatable infographic processes.
- If you want to improve the quality of existing infographics: Start with Chapter 10 on testing and measurement, then work backward through Chapters 3 through 7 to identify specific design improvements.
- If you are reading cover to cover: Follow the chapters in order. The sequence is intentional. Strategy comes before design, and design comes before measurement. Each chapter assumes the context built by the previous one.
Throughout the handbook, you will encounter several recurring features designed to make the content more actionable. Key insights highlight the most important takeaways from each section. Examples and case studies show how the principles apply in real design situations. Checklists and frameworks give you structured tools you can apply directly to your work. Pay attention to these features. They are where the abstract becomes practical.
One strong recommendation: keep a project nearby as you read. The best way to internalize design principles is to apply them immediately. If you are working through the chapter on color strategy, open a current project and audit its color choices against the principles you are reading about. If you are reading about information hierarchy, sketch out the hierarchy of your next infographic before you open any design software. Active engagement with the material will accelerate your learning significantly compared to passive reading.
It is also worth noting what this handbook does not do. It does not walk you through software tutorials step by step. Chapter 9 covers tools and workflow at a strategic level, but the assumption is that you already know how to use your design software of choice. The focus here is on the thinking and decision-making that happens before and during the design process, not on button-by-button instructions. There are excellent software-specific resources available for that level of technical detail, and the Further Reading section at the end of this book points you toward several of them.
This handbook also does not prescribe a single "correct" way to design infographics. Design is contextual. What works for a healthcare brand communicating clinical data to patients will look very different from what works for a tech startup visualizing product adoption metrics for investors. The frameworks here are flexible by design. They give you a structured way to think through decisions, not a rigid formula to follow blindly. Your judgment, informed by these principles and by your knowledge of your specific audience and brand, is always the final authority.
Finally, return to this handbook as your practice evolves. The chapter on testing and iteration, for example, will mean something different to you after you have run your first user test than it did before. The chapter on brand consistency will feel more relevant once you have experienced the chaos of an infographic project without a design system. Good reference books reward rereading, and this one is built with that in mind. The goal is for it to become a working resource you reach for throughout your career, not something you read once and shelve.
The craft of infographic design rewards patience, curiosity, and a genuine interest in how people understand information. If you bring those qualities to the material ahead, you will find that the principles here do not just make you a better infographic designer. They will sharpen your thinking about visual communication across every format you work in. That is the deeper promise of this handbook, and it starts on the very next page.
A practical starting point: Before moving to Chapter 1, identify one infographic you have designed or encountered recently that you felt was not quite working. Keep it in mind as you read. By the end of this handbook, you should be able to diagnose exactly what went wrong and know precisely how to fix it.
This is the end of the free sample. The full book has 10 chapters.
Want this book written for you?
Tell us your goals and background, and get your own version of this book, tailored by AI to you.


Benefits of AI-tailored books
- Read one book, not ten:
- all the Graphic Design knowledge you need, gathered into a single book.
- Save days of learning:
- tell us your goals, choose your topics, and the whole book is built around them.
- Learn effortlessly:
- Graphic Design book written for your specific background and expertise.
- Understand at a glance:
- includes charts, tables, timelines, checklists, decision trees, and more.
- Stay current:
- written the day you order it, not years ago.
- Trust what you read:
- every book is checked for accuracy, with real research when your subject needs it.
Create your unique book in 3 steps
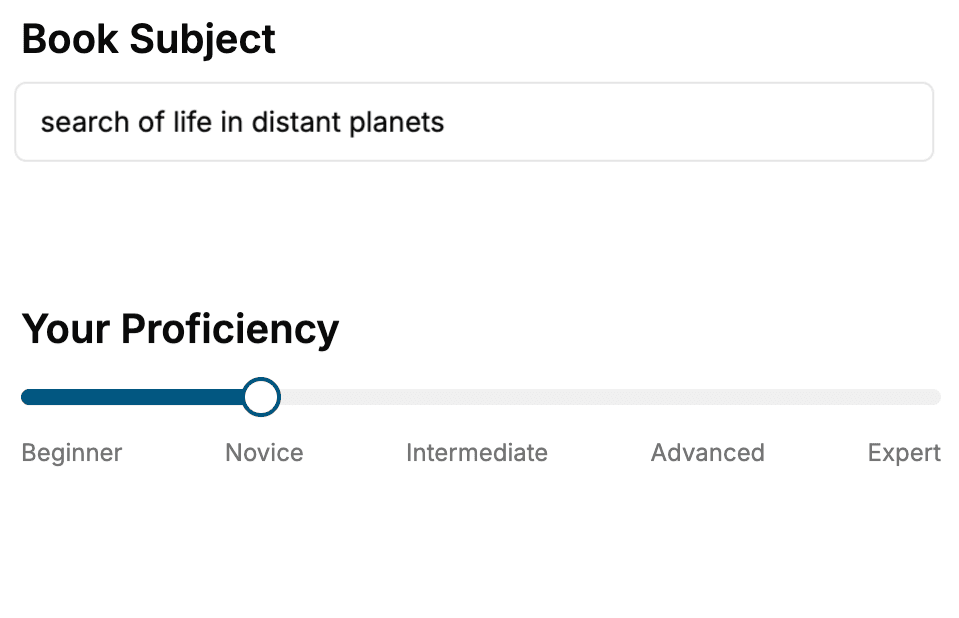
- 1. Select your focus
Select the focus of your Graphic Design book and share your background
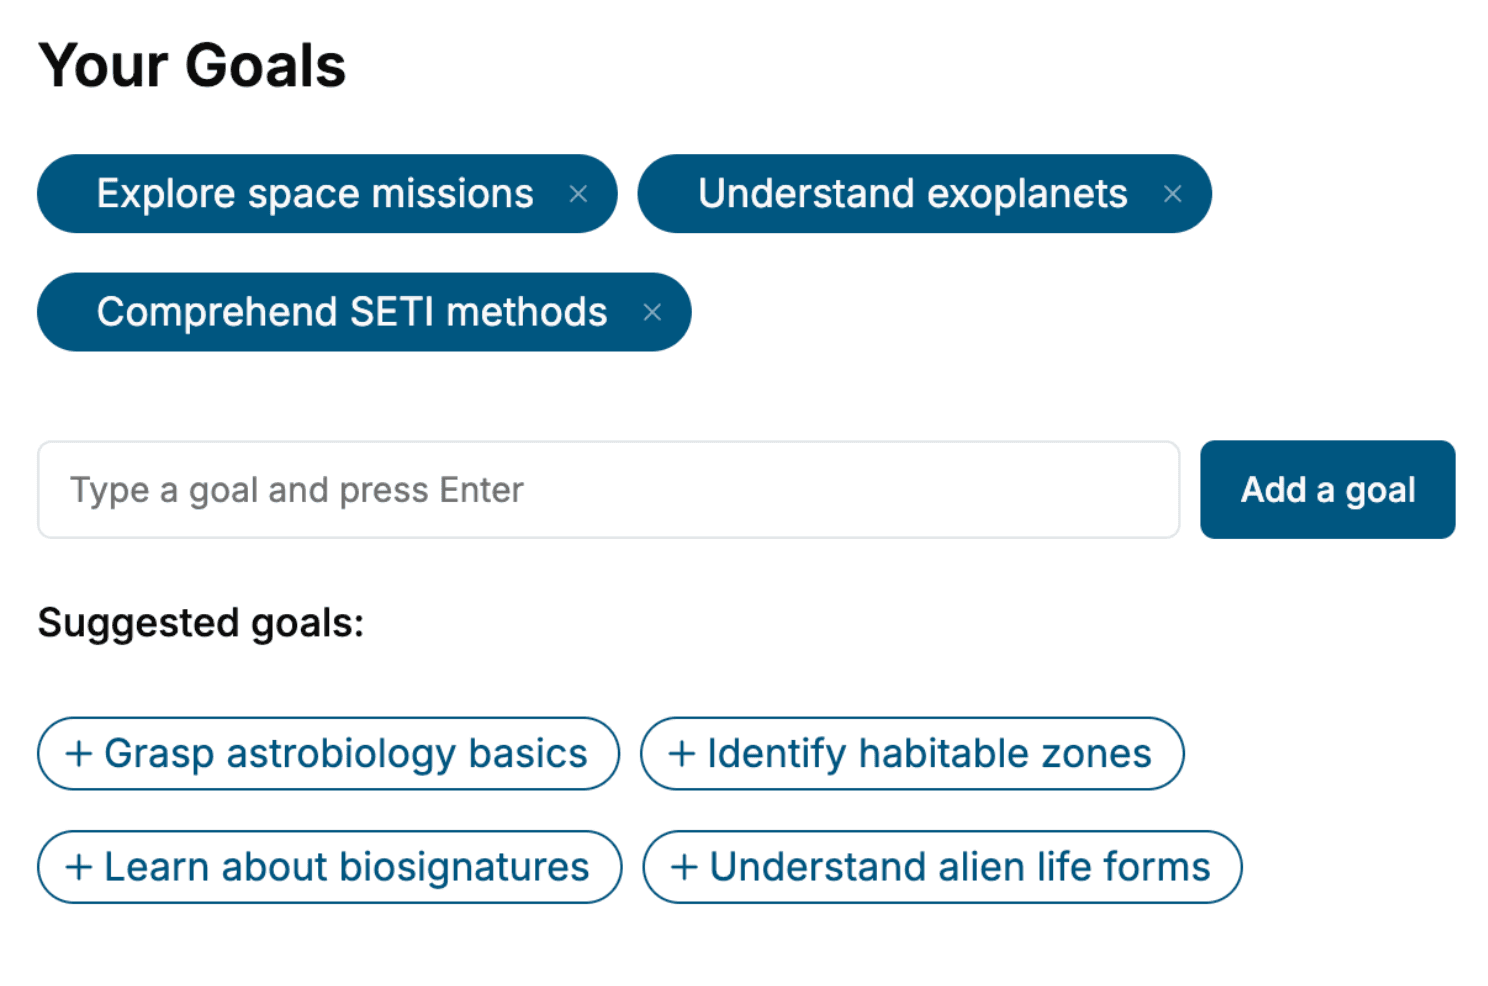
- 2. Personalize your book
Specify your goals and choose sub-topics to include
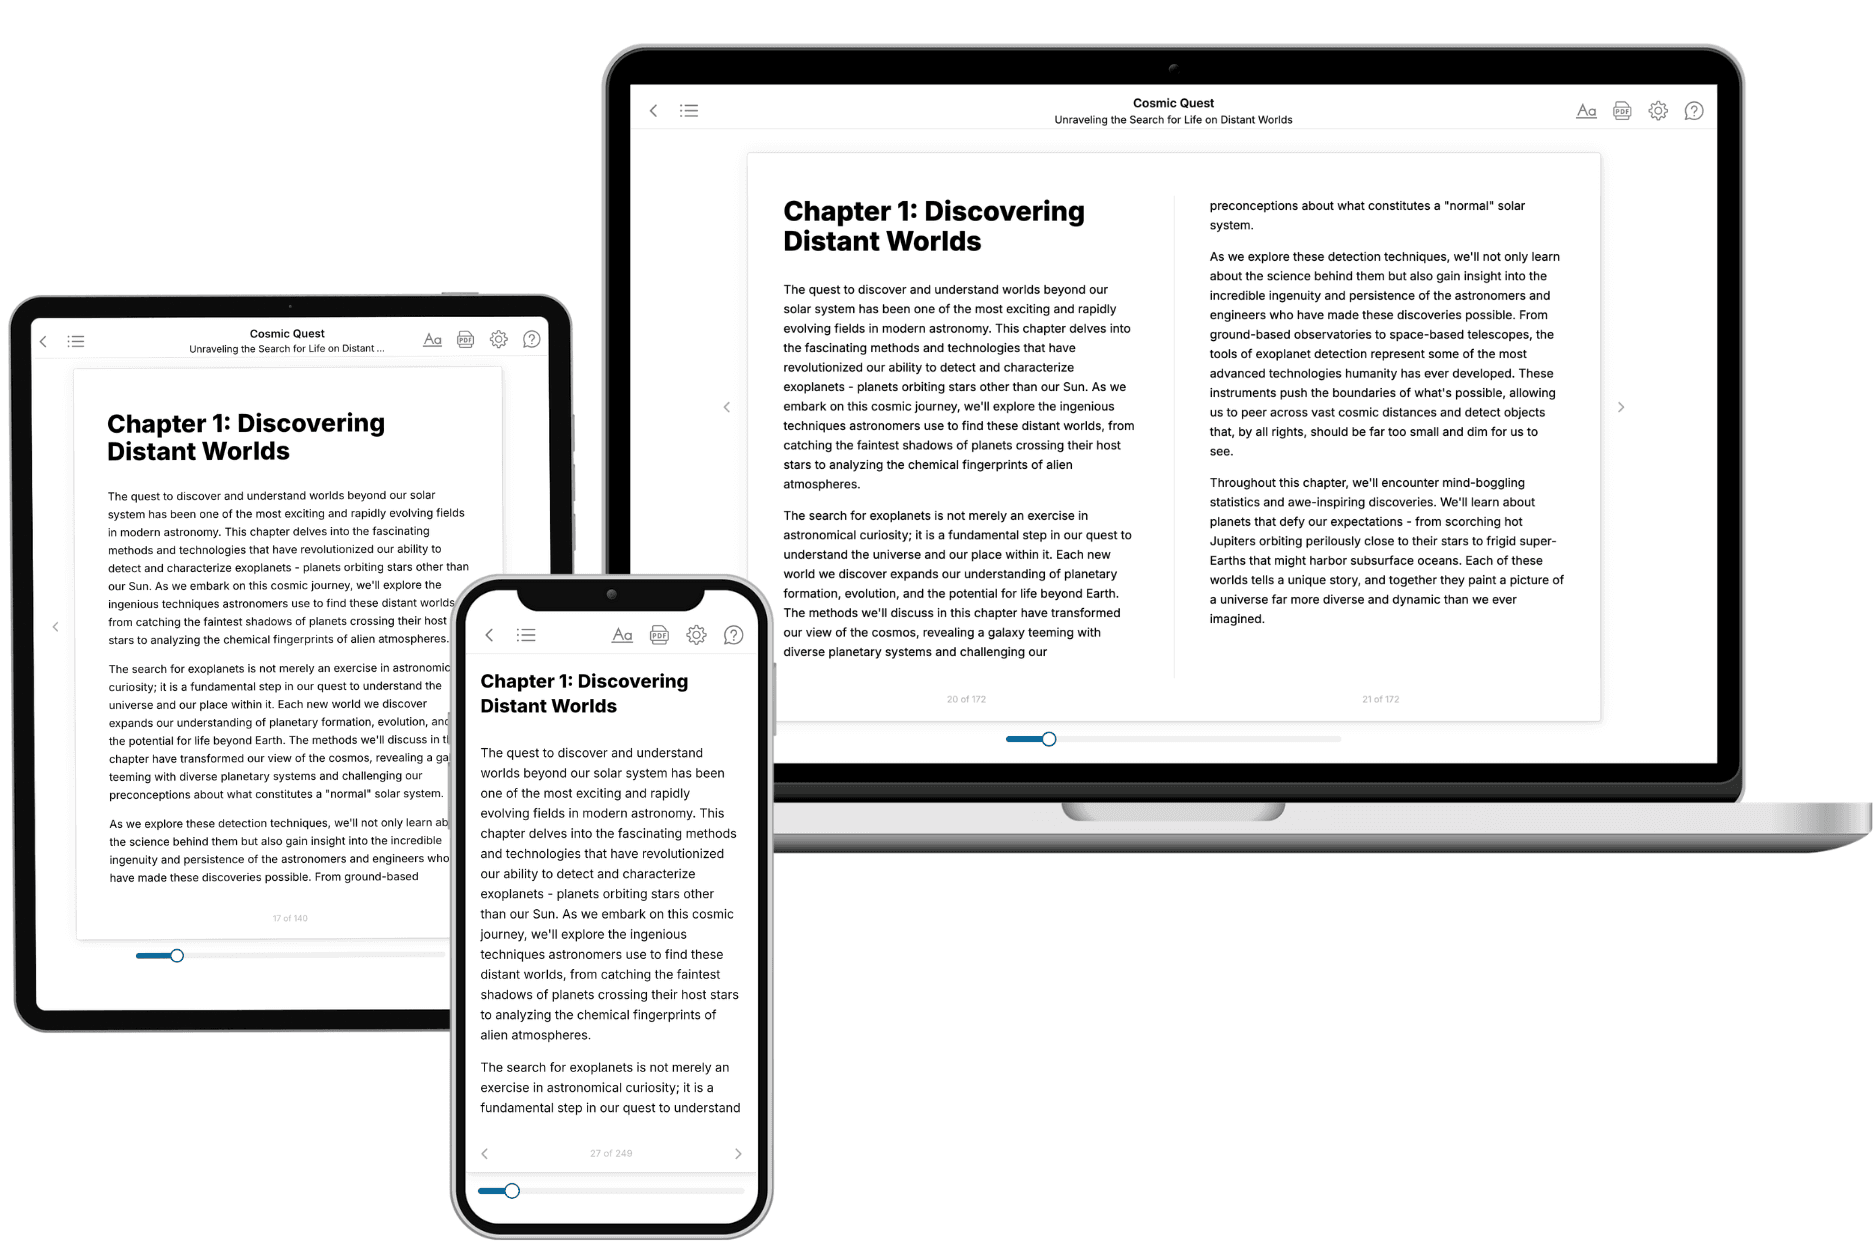
- 3. Get your tailored book
Your book is ready in 10 minutes. Read it online, download as EPUB or PDF, or send to Kindle.
Frequently asked questions
- What is TailoredRead?
TailoredRead creates complete, full-length nonfiction ebooks, written specifically for you. Tell us what you want to learn and why, and TailoredRead writes you a complete ebook on it, with charts, tables, and diagrams throughout. Read it online, on Kindle, or on any e-reader, or download it as a PDF or EPUB. Every book is written fresh the day you order it.
- How is the book tailored to me?
Before anything is written, you answer a few short questions about your goals, your background, and the topics you care about. Your book is then planned around your answers: written at your level, focused on your goals, and covering the topics you chose, instead of the one-size-fits-all book a store sells everyone.
- Will it read like generic AI content?
No. Your book isn't a chat transcript: it's planned chapter by chapter before a single word is written, told in a clear book voice, and explains ideas visually with charts, tables, and diagrams. After writing, every book goes through an editorial pass that polishes chapters so the book reads consistent from start to finish. Judge for yourself: browse thousands of sample books on our Explore Books page.
- How accurate is the content?
Our AI first checks whether your subject needs live research. Niche and fast-moving subjects are researched before writing, and the book plan and chapters are grounded in what it finds. After writing, every book goes through a quality pass that checks its facts and consistency, and researched books list their sources in a Notes section at the back.
- How long is the book?
You choose the length: Comprehensive (250-300 pages), Detailed (150-200 pages), Essential (70-100 pages), or Short (30-50 pages).
- Does the book include visuals?
Yes. Every book includes charts, tables, and diagrams: timelines, checklists, step-by-step guides, decision trees, comparison tables, matrices, and bar charts. A typical book includes dozens of these visual elements.
- Can I read it on Kindle? What formats can I download?
Yes. Every book can be read in our online reader or downloaded as a PDF or EPUB. The EPUB can be opened with Kindle, Apple Books, Kobo, and any e-reader. The Commercial and Author licenses also include an editable Word (DOCX) and Markdown download.
- How much does it cost?
About the price of a regular ebook. The exact price depends on your book's length and complexity, from $2 for the shortest books to $35 for the most comprehensive, and it's shown when you review your book, before you commit to anything. Each book is a one-time purchase, yours to keep, no subscription. Licenses that let you share, teach, or publish your book range from $35.99 to $49.99.
- Can I preview the book before purchasing?
Before you pay, you'll see what your book will cover: the title, a detailed description, the estimated length, and the complete chapter-by-chapter table of contents, so you know what you're getting before you decide. The full text itself is written after you purchase.
- How long does it take to create a book?
About 10 minutes. You can start reading the opening chapters while the rest is still being written.