Java Memory Leaks
Detect, Diagnose, and Eliminate Memory Problems in Your JVM Applications
Navigate the complex world of Java memory management and learn to eliminate the memory leaks that silently degrade your application's performance.
191 pages9 chaptersJul 30, 2026Java
About this book
This practical guide walks you through the fundamentals of how the JVM manages memory, then equips you with proven techniques to identify leaks before they reach production. You'll discover the most common memory leak patterns that plague Java applications, master industry-standard profiling tools, and implement defensive coding practices that prevent leaks from occurring in the first place. Through real-world examples and hands-on debugging scenarios, you'll develop the expertise to analyze heap dumps, interpret garbage collection logs, and optimize memory usage. Whether you're troubleshooting a sluggish application or building systems designed for reliability, this book provides the knowledge and tools you need to maintain healthy, efficient Java applications throughout their lifecycle.
Table of contents
- IntroductionWhy Memory Management Matters in Java, What You'll Learn in This Book, How to Use This Book EffectivelyRead below
- Chapter 1: JVM Memory Architecture and Garbage CollectionUnderstanding JVM Memory Regions, How Garbage Collection Works, Common Garbage Collection Algorithms
- Chapter 2: What Are Memory Leaks and Why They OccurDefining Memory Leaks in Java, Root Causes of Memory Leaks, Impact of Memory Leaks on Applications
- Chapter 3: Common Memory Leak PatternsStatic Collections and Caches, Listeners and Callbacks Without Cleanup, Circular References and Object Graphs, Resource Leaks and Improper Cleanup
- Chapter 4: Profiling Tools and TechniquesBuilt-in JVM Monitoring Tools, Java Flight Recorder and Mission Control, Third-Party Profiling Tools
- Chapter 5: Analyzing Heap Dumps and Memory SnapshotsGenerating and Capturing Heap Dumps, Analyzing Heap Dumps for Leaks, Identifying Suspicious Memory Patterns
- Chapter 6: Prevention Strategies and Best PracticesProper Resource Management and Cleanup, Using Weak and Soft References, Safe Listener and Observer Patterns, Code Review Practices for Memory Safety
- Chapter 7: Debugging and Troubleshooting Memory IssuesReading and Interpreting GC Logs, Tracking Memory Growth Over Time, Root Cause Analysis Techniques
- Chapter 8: Production Monitoring and AlertingKey Memory Metrics to Monitor, Setting Up Effective Alerts, Continuous Monitoring in Production
- Chapter 9: Real-World Case Studies and ExamplesCase Study: Diagnosing a Cache Leak, Case Study: Listener Registration Gone Wrong, Case Study: Third-Party Library Issues
- ConclusionKey Takeaways, Your Next Steps
- Appendix: Quick Reference GuideMemory Leak Prevention Checklist, Profiling Tools Reference, Further Reading and Resources
Introduction
A Java application that ran perfectly during testing starts slowing down after a few days in production. Response times creep up. The operations team restarts the service every weekend as a workaround. Nobody knows exactly why it happens, but everyone suspects memory. This scenario plays out in engineering teams around the world, and the culprit is almost always the same: objects accumulating in the heap because something, somewhere, is holding a reference that should have been released long ago. That is a memory leak, and it is one of the most frustrating problems a Java developer can face.
What makes memory leaks particularly tricky in Java is the expectation that garbage collection handles everything automatically. That expectation is mostly correct. The JVM's garbage collector is sophisticated, and for the vast majority of objects it does exactly what you expect. But garbage collection can only reclaim objects that are unreachable. If your code keeps a reference to an object, even accidentally, the collector cannot touch it. The result is memory that grows without bound, eventually triggering OutOfMemoryError or forcing restarts that mask the real problem.
This book is a practical guide to understanding, finding, and fixing memory leaks in Java applications. It covers the mechanics of how the JVM manages memory, the patterns that most commonly cause leaks, the tools you need to detect them, and the coding practices that prevent them from appearing in the first place. The goal is not just to help you solve the leak you have right now, but to give you a mental model and a toolkit that make you better at memory management for the rest of your career.
The material is aimed at intermediate Java developers who already understand the basics of the language and have some experience running JVM applications. You do not need to be a JVM internals expert to benefit from this book, but familiarity with concepts like object allocation, exception handling, and basic concurrency will help you move through the material quickly. Each chapter builds on the previous one, so reading in order gives you the clearest path from fundamentals to advanced diagnosis.
Why Memory Management Matters in Java
Java's automatic memory management is one of its most celebrated features. Developers coming from languages like C or C++ often describe it as liberating: no manual malloc and free, no dangling pointers, no buffer overflows from mismanaged allocations. The JVM takes care of reclaiming memory through garbage collection, and for most everyday code, that promise holds up well. The problem is that "automatic" does not mean "infallible," and the gap between those two words is where memory leaks live.
Memory management matters because memory is a finite resource shared across every component of a running application. When one part of the system holds onto memory it no longer needs, every other part has less to work with. The heap fills up, garbage collection runs more frequently and for longer periods, and the application spends an increasing fraction of its time collecting garbage instead of doing useful work. In severe cases, the collector cannot keep up at all, and the JVM throws an OutOfMemoryError that crashes the process entirely.
The performance impact is not always dramatic at first. A slow memory leak might take hours or days to become noticeable. During that time, the application appears to work correctly, but latency is gradually increasing and throughput is quietly dropping. By the time the problem becomes obvious to users, the heap may already be under serious pressure. This delayed visibility is one reason memory leaks are so dangerous in production systems: they are easy to miss until they become impossible to ignore.
Consider a concrete example. A web application uses a static HashMap to cache user session data. The cache is populated on login but never cleaned up on logout. Each new user session adds an entry. After a week of moderate traffic, the map holds tens of thousands of entries representing sessions that ended days ago. The heap grows steadily, GC pauses lengthen, and the application becomes sluggish. A restart clears the heap and the symptoms disappear, which makes the team think the problem is solved. It is not. The leak is still there, and the cycle will repeat.
Understanding memory management also matters because the tools and techniques for diagnosing leaks require some knowledge of how the JVM works internally. Concepts like reachability, GC roots, generational garbage collection, and the difference between shallow heap and retained heap are not just academic vocabulary. They are the framework you use to read a heap dump, interpret a GC log, and understand why a particular object is not being collected. Without that foundation, profiling output looks like noise. With it, the same output tells a clear story.
Java applications increasingly run in environments where memory is constrained and restarts are expensive. Containerized deployments on Kubernetes, for example, often set strict memory limits on pods. A memory leak in that environment does not just slow the application down; it causes the container to be killed and restarted by the orchestrator, which disrupts users and can cascade into broader availability problems. The stakes for getting memory management right have never been higher, and the tools available for doing so have never been better.
Finally, memory management matters because fixing a leak after it reaches production is far more costly than preventing it during development. A leak that is caught in a code review or a pre-production load test costs an hour of a developer's time. The same leak discovered after a production outage costs hours of incident response, potential data loss, user trust, and sometimes significant revenue. Building the habit of thinking about memory during development, not just during firefighting, is one of the highest-leverage skills a Java developer can develop.
A memory leak is not a bug that crashes your application immediately. It is a bug that slowly starves your application of the resources it needs to function, making it harder to diagnose precisely because the failure is gradual rather than sudden.
What You'll Learn in This Book
The book is organized to take you from foundational concepts to hands-on diagnosis and prevention. Each chapter focuses on a specific area of the memory leak problem, and together they form a complete picture of how to manage memory effectively in Java applications. Here is a map of the ground covered.
The first major area is how the JVM manages memory. Before you can find a leak, you need to understand what the JVM is doing with memory in the first place. This means understanding the different memory regions, including the heap, metaspace, and stack, and understanding how generational garbage collection works. You will learn how the mark-and-sweep algorithm identifies live objects using GC roots and reachability, and how different GC algorithms make different trade-offs between throughput and pause time. This foundation makes everything else in the book easier to understand.
The second area is what memory leaks actually are and why they occur. This goes beyond the simple definition to explore the root causes that produce leaks in real applications. You will learn why strong references are the primary mechanism behind most leaks, and how seemingly innocent code patterns can create retention chains that prevent garbage collection from doing its job. The chapter on leak causes is particularly important because it shifts your thinking from "the GC should handle this" to "what am I holding onto that I should not be?"
The third area is common memory leak patterns. Rather than cataloguing every possible way a leak can occur, this section focuses on the patterns that appear most frequently in production Java code. These include:
- Static collection leaks, where a static field holds a growing collection that is never pruned
- Listener leaks, where event listeners or callbacks are registered but never removed
- Resource leaks, where database connections, file handles, or streams are not closed properly
- ThreadLocal misuse, where thread-local variables in thread pools accumulate data across requests
Each pattern is illustrated with concrete code examples showing both the problematic version and the corrected version, so you can recognize and fix these issues in your own codebase.
The fourth area is profiling tools and techniques. Knowing that a leak exists is not enough; you need to find it. This section covers the tools available for observing live memory behavior in a JVM process, from built-in utilities like jmap and jstat to Java Flight Recorder and JDK Mission Control, to third-party profilers. You will learn how to select the right tool for the situation, how to set it up without disrupting production, and how to interpret the output it produces.
The fifth area is heap dump analysis. A heap dump is a snapshot of everything in the JVM's heap at a specific moment. Learning to read one is one of the most valuable skills in this book. You will learn how to generate heap dumps, how to load them into Eclipse MAT, and how to use concepts like the dominator tree, retained heap, and shallow heap to trace a leak back to its source. This is where abstract concepts become concrete evidence.
The sixth area is prevention strategies. The best memory leak is the one that never gets written. This section covers the coding practices, design patterns, and language features that make leaks less likely. Topics include proper use of try-with-resources, weak reference and soft reference types, WeakHashMap for cache implementations, and safe patterns for listener and observer registration. These are not theoretical recommendations; they are practical techniques with direct application to everyday Java code.
The seventh area is debugging and troubleshooting. Sometimes you know there is a problem but you are not sure where to start. This section covers how to read GC logs, how to recognize the sawtooth pattern that indicates healthy collection versus the heap growth trending that signals a leak, and how to perform root cause analysis when the evidence is ambiguous. You will also learn how to track old-generation growth rate over time as a leading indicator of trouble.
The eighth area is production monitoring and alerting. Finding a leak after it causes an outage is reactive. Setting up monitoring so you catch it early is proactive. This section covers the key heap utilisation metrics to track, how to set meaningful alert thresholds, and how to build a continuous monitoring strategy that gives you early warning before a leak becomes a crisis.
Finally, the book closes with real-world case studies that walk through complete investigations from symptom to fix. These case studies tie together every technique covered in the book and show how they work in combination on realistic problems. Reading them after the earlier chapters will reinforce the concepts and give you a sense of how an experienced developer approaches a memory problem methodically rather than by guesswork.
The goal of this book is not to make you memorize a list of rules. It is to give you a way of thinking about memory that lets you reason through problems you have never seen before, using tools and principles that apply across different Java versions, frameworks, and deployment environments.
How to Use This Book Effectively
This book is designed to be read in order, at least the first time through. The chapters build on each other deliberately. The chapter on profiling tools assumes you understand what the heap is and how garbage collection works. The chapter on heap dump analysis assumes you know what retained heap and the dominator tree mean. Jumping ahead without that foundation is possible, but you will likely find yourself backtracking to fill in gaps. A single read-through in sequence takes most developers a few hours and pays dividends for years.
That said, once you have read the book once, it works well as a reference. If you are debugging a specific problem, you can go directly to the chapter on heap dump analysis or GC logs without re-reading the fundamentals. The chapter on common memory leak patterns is particularly useful as a checklist when reviewing code or investigating a suspected leak. The appendix at the back of the book consolidates the most frequently referenced material into a quick-reference format for exactly this kind of targeted use.
The code examples throughout the book are written in standard Java and do not depend on any specific framework. Most examples are short enough to run in a simple main method or a unit test. Running the examples yourself, especially the ones that demonstrate leak patterns, is strongly recommended. Seeing a heap grow in a profiler while you watch a leaking program run is a more memorable lesson than reading about it. The experience of watching the old generation fill up and never come back down sticks with you in a way that prose alone cannot replicate.
Here is a practical approach to getting the most out of the hands-on sections:
- Read the concept explanation first, without running any code, to understand what you are about to observe.
- Run the example code with a profiler or monitoring tool attached so you can see the memory behavior in real time.
- Apply the fix shown in the corrected example and observe how the memory behavior changes.
- Try to reproduce the pattern in a small piece of your own code to confirm you understand it well enough to recognize it in context.
The chapters on profiling tools and heap dump analysis require some setup. You will need access to a JDK (not just a JRE) to use tools like jmap and jstat. Java Flight Recorder is available in OpenJDK builds from version 11 onward without a commercial license. Eclipse MAT is a free download. Third-party profilers like JProfiler and YourKit offer free trial periods that are more than sufficient for working through the examples in this book. Setting up these tools before you reach those chapters will save you time and let you focus on the concepts rather than the installation process.
If you are reading this book because you have an active memory problem in production, the fastest path to relief is to read the chapter on JVM memory architecture first, then skip to the chapters on profiling tools and heap dump analysis. Those three chapters together will give you enough to start a real investigation. Come back to the chapters on common patterns and prevention strategies once the immediate crisis is resolved, because they will help you understand how the leak got there and how to prevent the next one.
Pay particular attention to the case studies at the end of the book. They are not just illustrative; they are representative of the kinds of problems that appear repeatedly in real Java applications. The cache leak case study, the listener registration case study, and the third-party library case study each demonstrate a different investigation approach and a different set of tools. Reading them critically, asking yourself what you would have done at each decision point before reading the next paragraph, is a good way to test and reinforce your understanding.
A note on Java versions: the core concepts in this book apply to any modern JVM. Specific tool features and GC algorithm names vary between versions, and those differences are noted where they matter. The examples were written with Java 11 and later in mind, but the patterns, principles, and diagnostic approaches are relevant whether you are running Java 8 or the latest release. If you are on an older version, some tool features may not be available, but the underlying reasoning still applies.
Memory management is one of those topics where the more you know, the more you realize there is to know. This book covers the ground that matters most for the problems you are most likely to encounter. It does not attempt to be an exhaustive reference on JVM internals or garbage collector implementation details. Where deeper knowledge would help, pointers to further reading are provided. The goal is to make you effective, not encyclopedic, and effectiveness in this domain comes from understanding a small number of concepts deeply and applying them consistently.
The skills you build here transfer directly to production. Every technique in this book has been applied to real applications running real workloads. The patterns are real. The tools are real. The case studies are drawn from the kinds of problems that show up in incident reports and postmortems. By the time you finish, you will have a concrete, tested approach to memory management that you can apply the next time a production system starts behaving strangely, and the time after that, and the time after that.
This is the end of the free sample. The full book has 9 chapters.
Want this book written for you?
Tell us your goals and background, and get your own version of this book, tailored by AI to you.


Benefits of AI-tailored books
- Read one book, not ten:
- all the Java knowledge you need, gathered into a single book.
- Save days of learning:
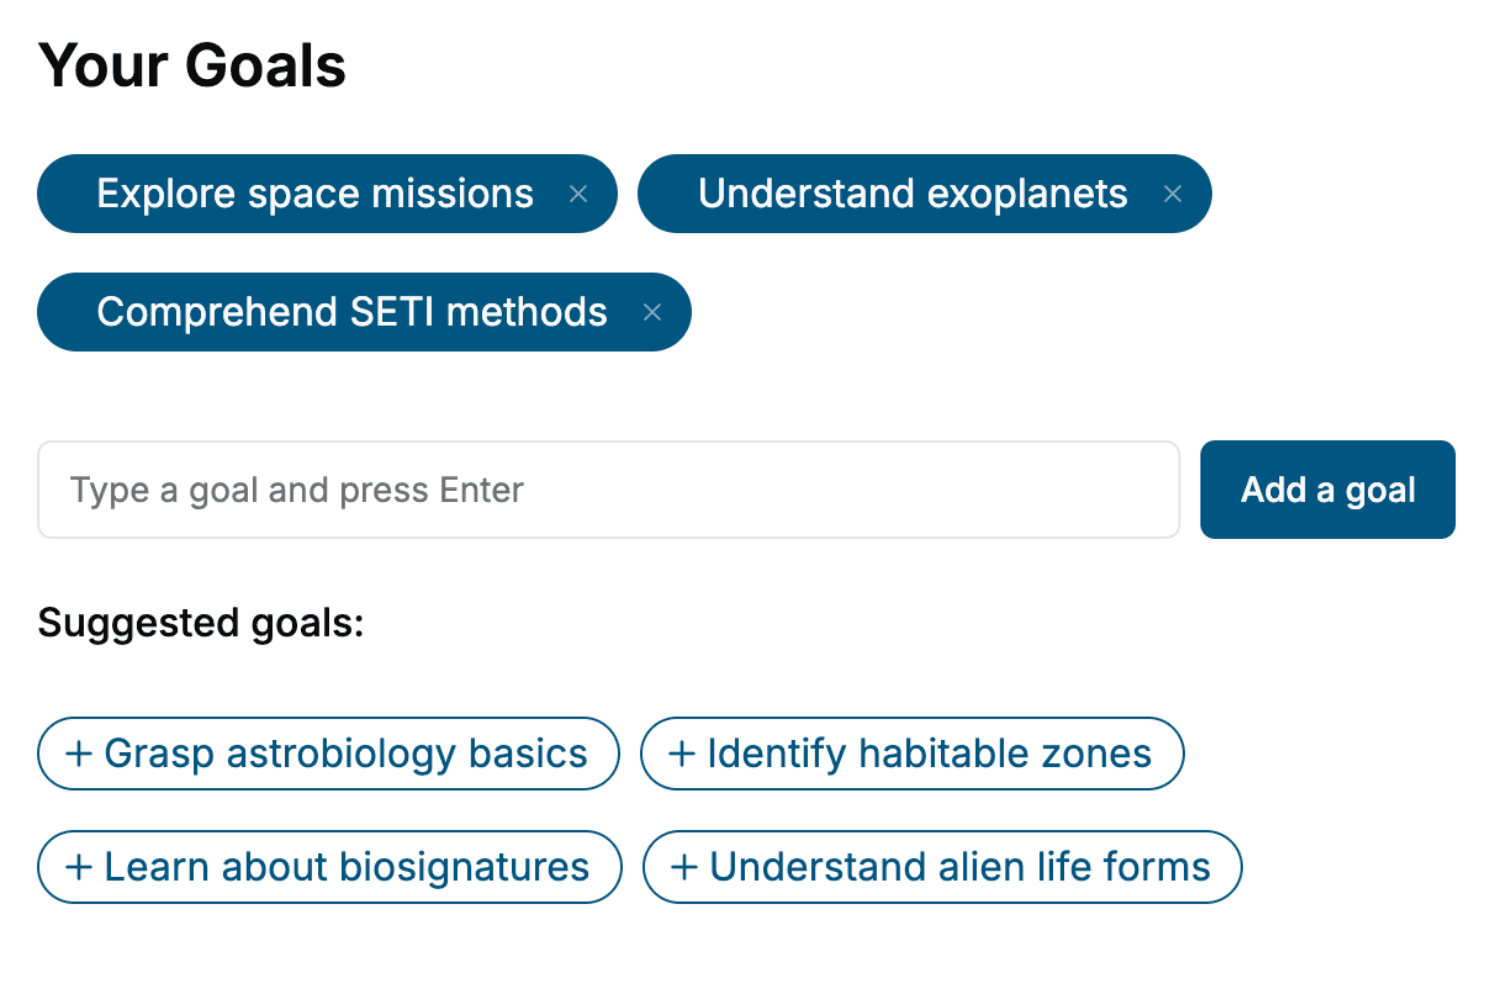
- tell us your goals, choose your topics, and the whole book is built around them.
- Learn effortlessly:
- Java book written for your specific background and expertise.
- Understand at a glance:
- includes charts, tables, timelines, checklists, decision trees, and more.
- Stay current:
- written the day you order it, not years ago.
- Trust what you read:
- every book is checked for accuracy, with real research when your subject needs it.
Create your unique book in 3 steps
- 1. Select your focus
Select the focus of your Java book and share your background
- 2. Personalize your book
Specify your goals and choose sub-topics to include
- 3. Get your tailored book
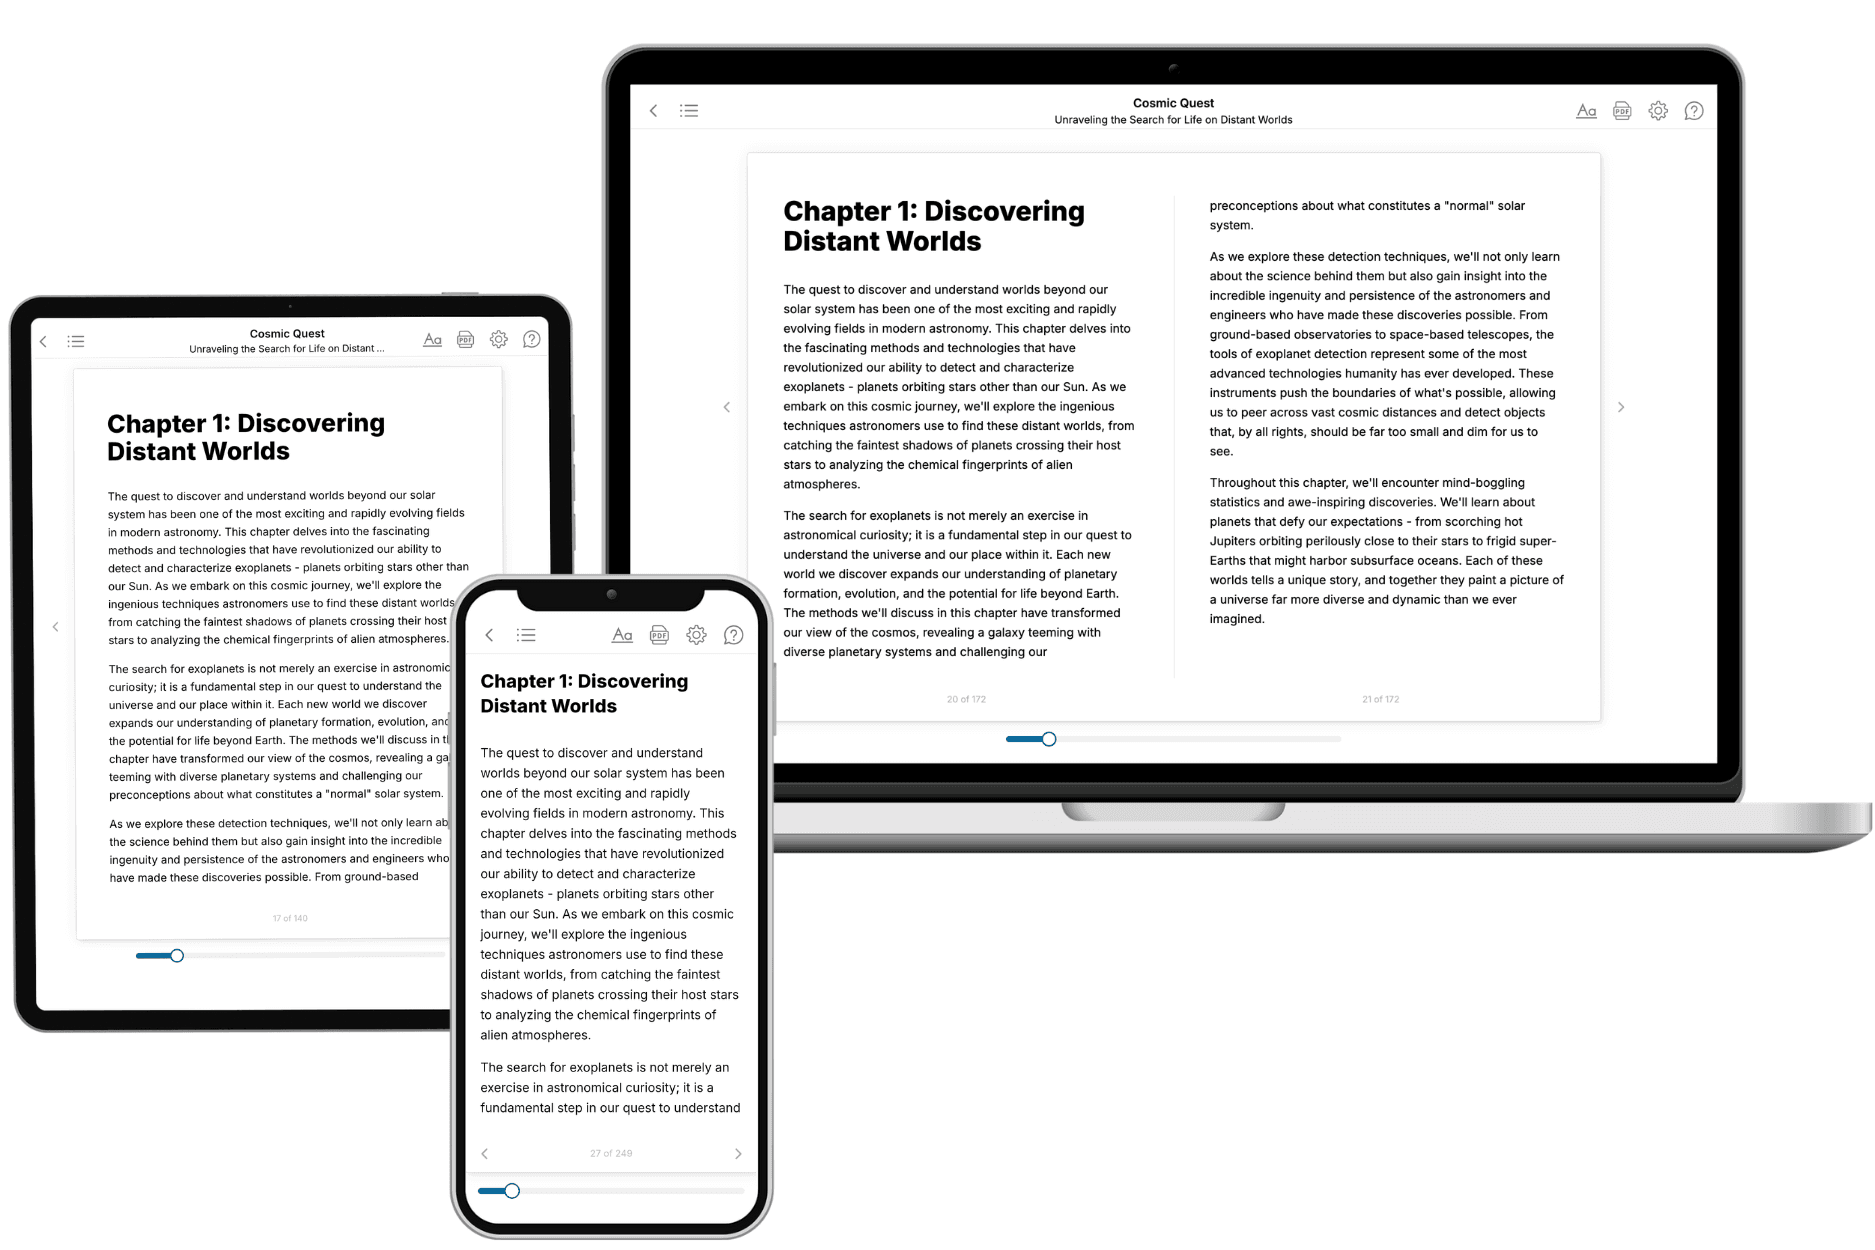
Your book is ready in 10 minutes. Read it online, download as EPUB or PDF, or send to Kindle.

Frequently asked questions
- What is TailoredRead?
TailoredRead creates complete, full-length nonfiction ebooks, written specifically for you. Tell us what you want to learn and why, and TailoredRead writes you a complete ebook on it, with charts, tables, and diagrams throughout. Read it online, on Kindle, or on any e-reader, or download it as a PDF or EPUB. Every book is written fresh the day you order it.
- How is the book tailored to me?
Before anything is written, you answer a few short questions about your goals, your background, and the topics you care about. Your book is then planned around your answers: written at your level, focused on your goals, and covering the topics you chose, instead of the one-size-fits-all book a store sells everyone.
- Will it read like generic AI content?
No. Your book isn't a chat transcript: it's planned chapter by chapter before a single word is written, told in a clear book voice, and explains ideas visually with charts, tables, and diagrams. After writing, every book goes through an editorial pass that polishes chapters so the book reads consistent from start to finish. Judge for yourself: browse thousands of sample books on our Explore Books page.
- How accurate is the content?
Our AI first checks whether your subject needs live research. Niche and fast-moving subjects are researched before writing, and the book plan and chapters are grounded in what it finds. After writing, every book goes through a quality pass that checks its facts and consistency, and researched books list their sources in a Notes section at the back.
- How long is the book?
You choose the length: Comprehensive (250-300 pages), Detailed (150-200 pages), Essential (70-100 pages), or Short (30-50 pages).
- Does the book include visuals?
Yes. Every book includes charts, tables, and diagrams: timelines, checklists, step-by-step guides, decision trees, comparison tables, matrices, and bar charts. A typical book includes dozens of these visual elements.
- Can I read it on Kindle? What formats can I download?
Yes. Every book can be read in our online reader or downloaded as a PDF or EPUB. The EPUB can be opened with Kindle, Apple Books, Kobo, and any e-reader. The Commercial and Author licenses also include an editable Word (DOCX) and Markdown download.
- How much does it cost?
About the price of a regular ebook. The exact price depends on your book's length and complexity, from $2 for the shortest books to $35 for the most comprehensive, and it's shown when you review your book, before you commit to anything. Each book is a one-time purchase, yours to keep, no subscription. Licenses that let you share, teach, or publish your book range from $35.99 to $49.99.
- Can I preview the book before purchasing?
Before you pay, you'll see what your book will cover: the title, a detailed description, the estimated length, and the complete chapter-by-chapter table of contents, so you know what you're getting before you decide. The full text itself is written after you purchase.
- How long does it take to create a book?
About 10 minutes. You can start reading the opening chapters while the rest is still being written.