Java Memory Management Mastery
Build High-Performance Applications by Understanding the JVM Memory Model
Imagine running Java applications that respond instantly, scale effortlessly, and never suffer from mysterious memory issues.
207 pages10 chaptersMay 13, 2026Java
About this book
This book reveals the hidden mechanics of Java memory management that separate high-performing applications from those that struggle under load. You'll discover how the JVM allocates memory, why garbage collection pauses occur, and exactly how to eliminate memory leaks that plague production systems. Through practical examples and real-world scenarios, you'll learn to read memory profiles, interpret GC logs, and make informed decisions about heap configuration and garbage collector selection. Whether you're debugging a slow application, preparing for high-traffic deployments, or simply want to write more efficient code, this comprehensive guide provides the knowledge and tools you need. You'll understand the trade-offs between different GC algorithms, master profiling techniques, and develop an intuition for memory-conscious programming that will serve you throughout your career.
Table of contents
- IntroductionWhy Memory Management Matters, What You'll Learn in This Book, How to Use This GuideRead below
- Chapter 1: JVM Memory ArchitectureUnderstanding Memory Regions, The Heap: Where Objects Live, Stack, Metaspace, and Other Memory Areas
- Chapter 2: Object Allocation and LifecycleHow Objects Are Allocated, Escape Analysis and Stack Allocation, References and Object Reachability
- Chapter 3: Garbage Collection FundamentalsWhat Is Garbage Collection?, Core GC Algorithms: Mark-Sweep and Copying, The Generational Hypothesis
- Chapter 4: Garbage Collectors in DepthSerial and Parallel Garbage Collectors, Concurrent Mark-Sweep (CMS) Collector, Modern Collectors: G1GC and ZGC
- Chapter 5: Identifying and Preventing Memory LeaksCommon Causes of Memory Leaks, Detecting Memory Leaks in Production, Patterns and Practices to Prevent Leaks
- Chapter 6: Profiling and Monitoring MemoryIntroduction to Memory Profilers, Reading and Interpreting GC Logs, Monitoring Memory in Production Systems
- Chapter 7: Heap Configuration and TuningDetermining Optimal Heap Size, Key GC Tuning Parameters, Tuning Strategies for Different Workloads
- Chapter 8: Concurrency and Memory VisibilityMemory Visibility in Concurrent Code, Happens-Before Relationships, Writing Thread-Safe Code
- Chapter 9: Memory Optimization TechniquesEfficient Object Allocation Patterns, Object Pooling and Reuse, Cache-Aware Programming
- Chapter 10: Real-World Case StudiesCase Study: Diagnosing a Memory Leak in Production, Case Study: Optimizing GC Pauses for Low-Latency Systems, Case Study: Scaling Applications with Memory Constraints
- ConclusionKey Takeaways, Your Path Forward
- Appendix: Quick ReferenceEssential JVM Flags, Memory Profiling Tools Reference
Introduction
Every Java developer has been there. An application that runs perfectly in testing starts slowing down after a few hours in production. Memory usage climbs steadily until the JVM throws an OutOfMemoryError, or garbage collection pauses stretch long enough to trigger timeouts and angry user reports. The logs offer cryptic clues, the heap dumps are enormous, and the root cause feels impossibly buried. These moments are frustrating, but they are also completely avoidable once you understand what is actually happening inside the JVM.
Java was designed to free developers from the burden of manual memory management. Unlike C or C++, you do not call malloc and free. The garbage collector handles cleanup automatically, and for many applications, it does a remarkable job without any intervention. But automatic does not mean invisible, and it certainly does not mean effortless. The JVM makes thousands of memory-related decisions every second, and those decisions have real consequences for your application's speed, stability, and scalability. Understanding those decisions is what separates developers who guess from developers who know.
This book is built around a simple premise: you cannot optimize what you do not understand. Memory management in Java is a deep topic, but it is not an impenetrable one. The concepts are logical, the tools are accessible, and the payoff for learning them is immediate and measurable. Whether you are chasing down a memory leak in a production system, trying to reduce GC pause times for a latency-sensitive service, or simply writing cleaner and more efficient code, the knowledge in these pages will give you a concrete advantage. The goal is not to turn you into a JVM engineer, but to give you enough understanding to make smart decisions and solve real problems.
Throughout this book, you will find practical examples, real-world scenarios, and specific techniques you can apply right away. The chapters build on each other, starting with how the JVM organizes memory and progressing through garbage collection, memory leaks, profiling, tuning, concurrency, and optimization. By the end, you will have a complete mental model of how Java manages memory, along with a toolkit of strategies for keeping your applications fast and healthy under any workload.
Why Memory Management Matters
Memory is one of the most fundamental resources in any computing system, and Java applications consume it constantly. Every object you create, every string you concatenate, every collection you populate takes up space in the JVM heap. When memory is managed well, applications run smoothly and predictably. When it is managed poorly, the consequences range from sluggish performance to complete application failure. Understanding memory management is not an advanced specialty reserved for performance engineers. It is a core skill for any developer who wants to build reliable software.
The impact of poor memory management shows up in several distinct ways. The most dramatic is the OutOfMemoryError, which crashes the JVM when it cannot allocate space for a new object. But the subtler problems are often more damaging in practice. Long garbage collection pauses can cause request timeouts in web applications, making the system appear unresponsive even though no code is actually broken. Excessive object allocation puts pressure on the GC, increasing CPU usage and reducing throughput. Memory leaks cause gradual degradation that is difficult to reproduce and even harder to diagnose without the right knowledge.
Consider a concrete example. A financial services company runs a Java-based order processing system that handles thousands of transactions per minute. During peak trading hours, GC pauses of just 500 milliseconds can cause cascading failures as queued requests pile up. The engineering team spends weeks adding hardware, only to find that the real problem is a misconfigured heap and a GC algorithm poorly suited to their workload. Switching from the default collector to ZGC and adjusting heap sizing reduces pause times to under 10 milliseconds, resolving the issue without any additional infrastructure cost.[1]
Memory management also matters for cost. Cloud infrastructure is billed by resource consumption, and applications that use memory inefficiently require larger instances or more nodes to handle the same load. A team that understands how to tune heap configuration and reduce unnecessary object allocation can often cut infrastructure costs significantly without sacrificing performance. This is not a theoretical benefit. It is a practical outcome that shows up directly in monthly cloud bills.
There is also a correctness dimension to memory management that goes beyond performance. In concurrent Java applications, memory visibility rules determine whether one thread can reliably see changes made by another. Getting these rules wrong leads to subtle, intermittent bugs that are notoriously difficult to reproduce and debug. Understanding the Java Memory Model and the happens-before relationship is essential for writing correct multithreaded code, not just fast code.
Finally, memory management knowledge makes you a better developer in everyday situations, not just during crises. When you understand how the JVM allocates objects, you write code that works with the runtime rather than against it. You make better choices about data structures, caching strategies, and object lifecycles. You recognize patterns that are likely to cause problems before they reach production. This kind of intuition is built through understanding, and that is exactly what this book is designed to provide.
A useful way to think about it: The JVM's garbage collector is like a highly efficient cleaning crew working in the background. If you understand their schedule and methods, you can organize your workspace to make their job easier and faster. If you ignore them entirely, you might find the whole office locked down for cleaning at the worst possible moment.
The good news is that Java's memory management system is genuinely well-designed. Modern garbage collectors like G1GC and ZGC are engineering marvels that handle enormous workloads with minimal intervention. The JVM's just-in-time compiler performs sophisticated optimizations like escape analysis that can eliminate object allocation entirely in some cases. These systems work remarkably well when you understand how to configure and work with them. The goal of this book is to give you that understanding.
What You'll Learn in This Book
This book covers Java memory management from the ground up, moving from foundational concepts to advanced optimization techniques. Each chapter builds on the previous ones, so by the time you reach the later chapters on tuning and concurrency, you will have the context needed to apply those techniques effectively. Here is a clear picture of what each part of the book covers and what you will be able to do after reading it.
Chapter 1: JVM Memory Architecture lays the foundation by explaining how the JVM organizes memory into distinct regions. You will learn the difference between the heap, the stack, metaspace, and other memory areas. You will understand why these regions exist, what gets stored in each one, and how they interact. This mental model is essential for everything that follows, because every memory management decision the JVM makes is rooted in this architecture.
Chapter 2: Object Allocation and Lifecycle explains what actually happens when you write new MyObject(). You will learn how the JVM allocates memory for objects, how it tracks object references to determine what is still in use, and how escape analysis can allow the JVM to allocate objects on the stack instead of the heap. Understanding object lifecycle helps you write code that minimizes unnecessary allocation and works efficiently with the garbage collector.
Chapters 3 and 4 cover garbage collection in depth. Chapter 3 introduces the core concepts: what garbage collection is, how mark-sweep and copying algorithms work, and why the generational hypothesis is the foundation of most modern GC design. Chapter 4 goes deeper into specific collectors, including Serial, Parallel, CMS, G1GC, and ZGC. You will understand the trade-offs each collector makes between pause time, throughput, and memory overhead, and you will know how to choose the right one for your application.
Chapter 5: Identifying and Preventing Memory Leaks addresses one of the most common and costly problems in production Java applications. You will learn the most frequent causes of memory leaks, including static collections, listener registrations, and improper use of caches. You will learn how to detect leaks using heap dumps and profiling tools, and you will learn coding patterns that prevent leaks from occurring in the first place.
Chapter 6: Profiling and Monitoring Memory covers the tools and techniques you need to measure and diagnose memory behavior. You will learn how to use profilers like VisualVM, JProfiler, and async-profiler. You will learn how to enable and read GC logs, and how to set up production monitoring using JMX and tools like Prometheus and Grafana. The core message of this chapter is simple: you cannot fix what you cannot see.
Chapter 7: Heap Configuration and Tuning gets into the practical details of JVM configuration. You will learn how to determine the right heap size for your application, which GC tuning flags matter most, and how to approach tuning for different workload types, including batch processing, web services, and real-time systems. This chapter includes specific flag examples and tuning strategies you can apply directly.
Chapter 8: Concurrency and Memory Visibility covers the Java Memory Model and its implications for multithreaded code. You will understand what memory visibility means, why it matters, and how the happens-before relationship governs what one thread can see from another. You will learn how to use volatile, synchronized, and the classes in java.util.concurrent correctly to write thread-safe code that avoids subtle memory bugs.
Chapter 9: Memory Optimization Techniques provides a toolkit of practical strategies for reducing memory pressure and improving performance. Topics include efficient object allocation patterns, object pooling and reuse, and cache-aware programming. Each technique is illustrated with concrete examples and explained in terms of when and why to apply it.
Chapter 10: Real-World Case Studies brings everything together through three detailed scenarios: diagnosing a memory leak in a production system, optimizing GC pauses for a low-latency service, and scaling an application under memory constraints. These case studies walk through the diagnostic process step by step, showing how the concepts from earlier chapters apply to real problems.
By the end of this book, you will be able to:
- Explain the JVM memory model and describe the purpose of each memory region
- Choose the right garbage collector for a given application's requirements
- Identify and fix memory leaks using profiling tools and heap analysis
- Configure heap size and GC parameters for optimal performance
- Read and interpret GC logs to diagnose performance problems
- Write concurrent code that correctly handles memory visibility
- Apply memory optimization techniques to reduce allocation pressure
- Set up production monitoring to catch memory problems before they become crises
These are not abstract skills. They are practical capabilities that apply directly to the Java applications you build and maintain every day. Each chapter is designed to give you knowledge you can use immediately, not just concepts to file away for later.
How to Use This Guide
This book is written for intermediate Java developers who already understand the basics of the language and want to go deeper into how the JVM actually works. You should be comfortable writing Java classes, working with collections, and understanding basic object-oriented concepts. You do not need prior experience with JVM internals, garbage collection, or performance tuning. Those topics are introduced from the ground up, with enough context to make them accessible without assuming prior knowledge.
The chapters are designed to be read in order. Each one builds on concepts introduced in the previous chapters, and the later chapters on tuning and optimization will make much more sense if you have read the earlier material on memory architecture and garbage collection. That said, if you are already familiar with JVM fundamentals and want to jump directly to a specific topic, such as memory leaks or GC tuning, each chapter is written to be reasonably self-contained. Cross-references throughout the text will point you back to foundational material when needed.
As you read, pay particular attention to the code examples. They are written to illustrate specific concepts, and many of them show both a problematic pattern and a corrected version. Reading the examples carefully and thinking about why the corrected version works better is one of the most effective ways to build the intuition this book is trying to develop. Where possible, try running the examples in your own environment and experimenting with variations.
Recommended approach for active learning: After finishing each chapter, take five minutes to write down the two or three most important things you learned. Then think of one place in your current codebase where that knowledge might apply. This simple habit dramatically accelerates the process of turning reading into practical skill.
The profiling and monitoring chapters (Chapter 6) are especially valuable when paired with hands-on practice. Setting up VisualVM or enabling GC logging on a real application, even a small personal project, will teach you far more than reading alone. The tools are free, the setup is straightforward, and the experience of seeing real memory data from a real application makes the concepts click in a way that text descriptions cannot fully replicate.
For developers who are working through a specific production problem right now, here is a suggested reading path based on common scenarios:
- Investigating a suspected memory leak: Start with Chapter 1 for context, then go directly to Chapters 5 and 6. Return to Chapters 2 and 3 afterward to deepen your understanding of why leaks occur.
- Reducing GC pause times: Read Chapters 3 and 4 to understand GC algorithms, then Chapter 7 for tuning strategies. Chapter 6 will help you measure the impact of your changes.
- Debugging a concurrency bug: Go directly to Chapter 8, which covers memory visibility and the Java Memory Model. Chapters 1 and 2 provide useful background if the concepts feel unfamiliar.
- General performance optimization: Read the book in order. The full picture is the most valuable thing this book offers, and skipping ahead means missing context that makes the later chapters more actionable.
Throughout the book, you will encounter several recurring elements designed to make the content more useful. Key concepts are highlighted in bold when they are first introduced, so you can identify the vocabulary that matters most. Code examples are formatted clearly and annotated where the important details might not be immediately obvious. Footnotes point to external sources, research, and documentation for readers who want to go deeper on a particular topic.
The appendix at the end of the book serves as a quick reference for the most commonly used JVM flags and profiling tools. Once you have read the main chapters and understand the context behind these flags, the appendix gives you a fast way to look up specific options without rereading entire chapters. It is designed to be the kind of reference you keep open in a browser tab during a tuning session.
One final note on mindset. Memory management can feel overwhelming at first because there are many moving parts and the consequences of getting things wrong can be severe. But the underlying principles are consistent and logical. The JVM behaves predictably once you understand its rules. Every concept in this book follows from a small set of core ideas about how memory is organized, how objects are tracked, and how the garbage collector decides what to clean up. Keep those core ideas in mind as you read, and the details will fall into place much more easily than you might expect.
The developers who are most effective at diagnosing and solving memory problems are not necessarily the ones who have memorized the most JVM flags. They are the ones who have built a clear mental model of how the system works and can reason from first principles when they encounter something unexpected. That is the kind of understanding this book is designed to build. The flags and tools are important, but the mental model is what makes them useful. Start with the concepts, practice with the tools, and the expertise will follow.
Notes
Introduction
- 1. This scenario reflects common patterns documented in JVM performance engineering literature. See: Gough, J., Hennessy, M. (2016). Java Performance: The Definitive Guide. O'Reilly Media.
This is the end of the free sample. The full book has 10 chapters.
Want this book written for you?
Tell us your goals and background, and get your own version of this book, tailored by AI to you.


Benefits of AI-tailored books
- Read one book, not ten:
- all the Java knowledge you need, gathered into a single book.
- Save days of learning:
- tell us your goals, choose your topics, and the whole book is built around them.
- Learn effortlessly:
- Java book written for your specific background and expertise.
- Understand at a glance:
- includes charts, tables, timelines, checklists, decision trees, and more.
- Stay current:
- written the day you order it, not years ago.
- Trust what you read:
- every book is checked for accuracy, with real research when your subject needs it.
Create your unique book in 3 steps
- 1. Select your focus
Select the focus of your Java book and share your background
- 2. Personalize your book
Specify your goals and choose sub-topics to include
- 3. Get your tailored book
Your book is ready in 10 minutes. Read it online, download as EPUB or PDF, or send to Kindle.


Frequently asked questions
- What is TailoredRead?
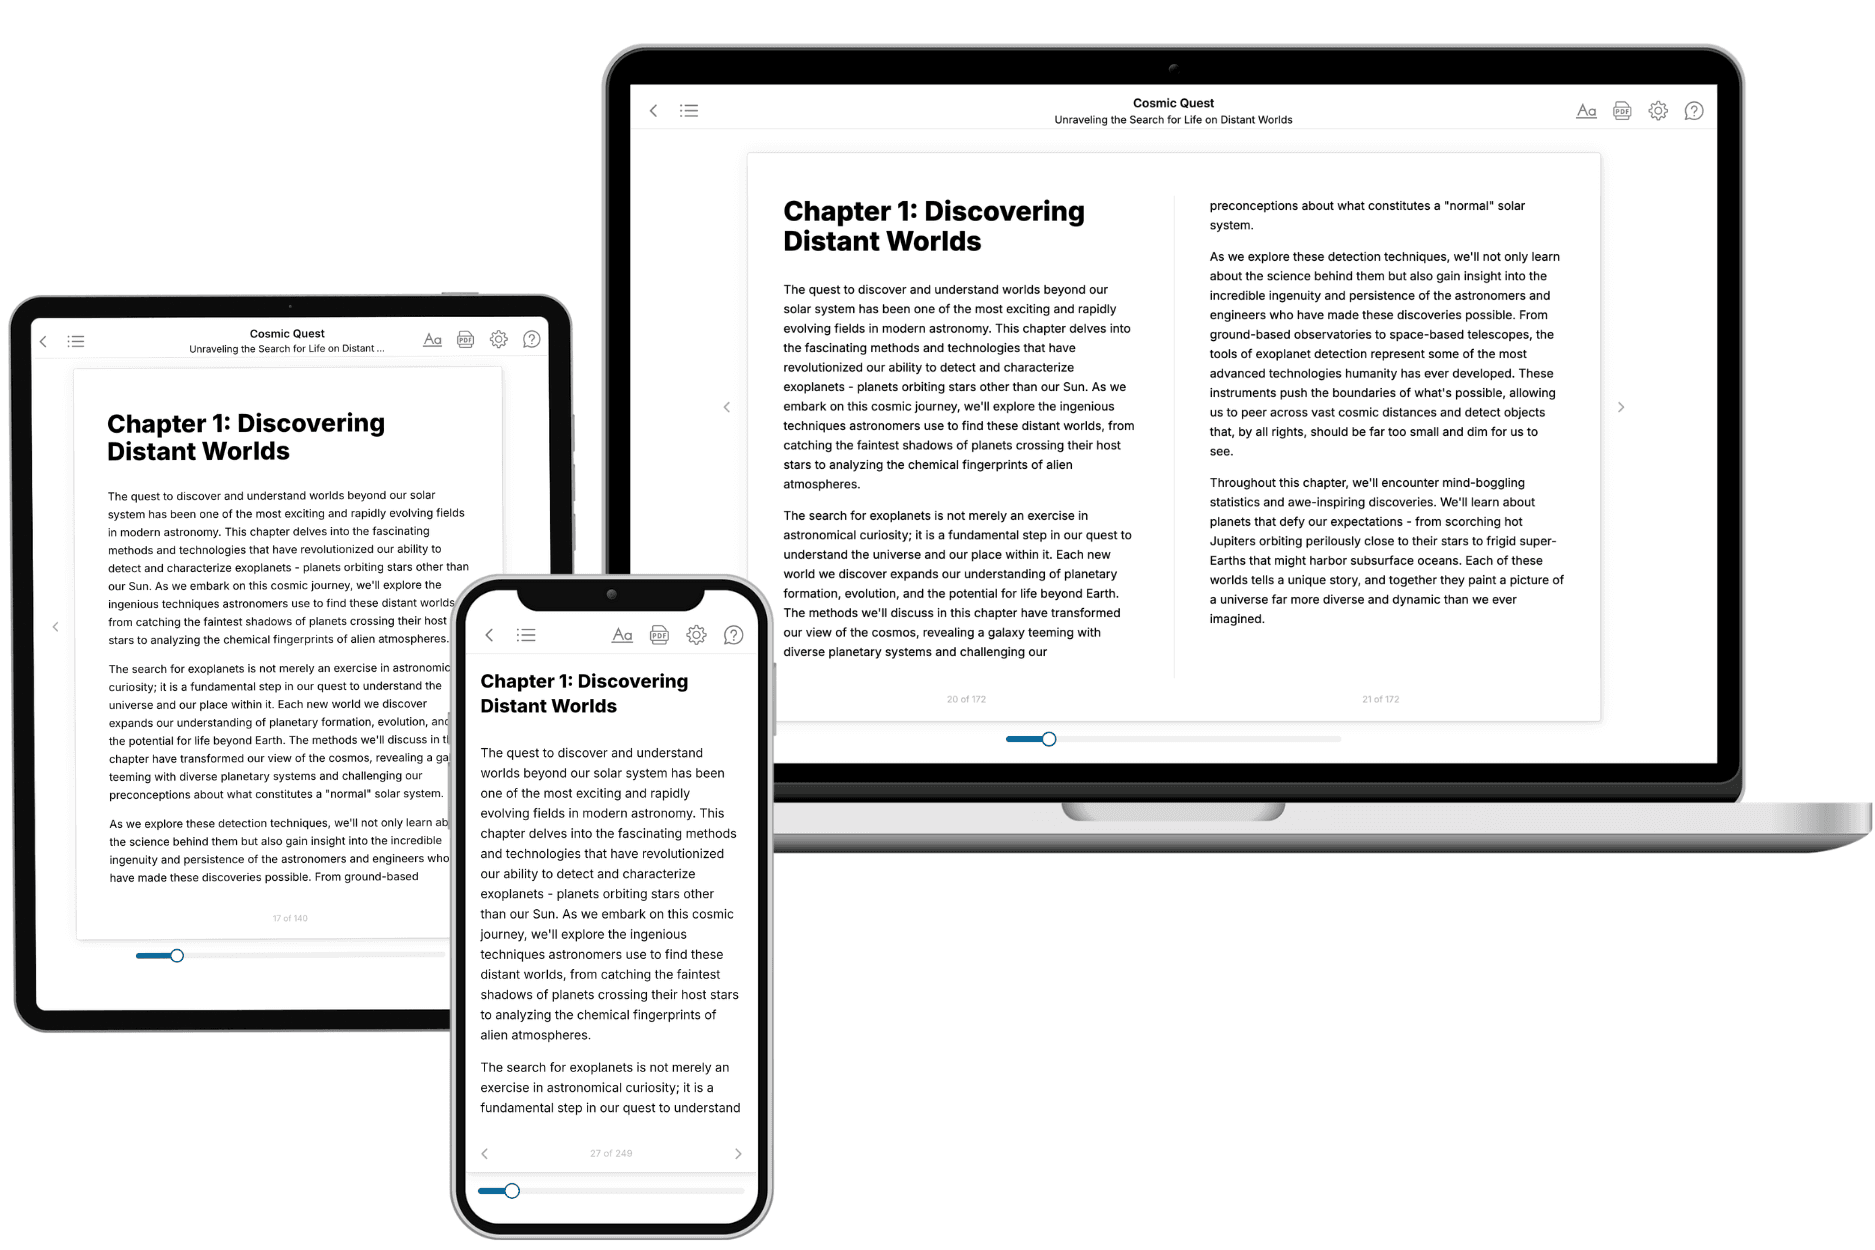
TailoredRead creates complete, full-length nonfiction ebooks, written specifically for you. Tell us what you want to learn and why, and TailoredRead writes you a complete ebook on it, with charts, tables, and diagrams throughout. Read it online, on Kindle, or on any e-reader, or download it as a PDF or EPUB. Every book is written fresh the day you order it.
- How is the book tailored to me?
Before anything is written, you answer a few short questions about your goals, your background, and the topics you care about. Your book is then planned around your answers: written at your level, focused on your goals, and covering the topics you chose, instead of the one-size-fits-all book a store sells everyone.
- Will it read like generic AI content?
No. Your book isn't a chat transcript: it's planned chapter by chapter before a single word is written, told in a clear book voice, and explains ideas visually with charts, tables, and diagrams. After writing, every book goes through an editorial pass that polishes chapters so the book reads consistent from start to finish. Judge for yourself: browse thousands of sample books on our Explore Books page.
- How accurate is the content?
Our AI first checks whether your subject needs live research. Niche and fast-moving subjects are researched before writing, and the book plan and chapters are grounded in what it finds. After writing, every book goes through a quality pass that checks its facts and consistency, and researched books list their sources in a Notes section at the back.
- How long is the book?
You choose the length: Comprehensive (250-300 pages), Detailed (150-200 pages), Essential (70-100 pages), or Short (30-50 pages).
- Does the book include visuals?
Yes. Every book includes charts, tables, and diagrams: timelines, checklists, step-by-step guides, decision trees, comparison tables, matrices, and bar charts. A typical book includes dozens of these visual elements.
- Can I read it on Kindle? What formats can I download?
Yes. Every book can be read in our online reader or downloaded as a PDF or EPUB. The EPUB can be opened with Kindle, Apple Books, Kobo, and any e-reader. The Commercial and Author licenses also include an editable Word (DOCX) and Markdown download.
- How much does it cost?
About the price of a regular ebook. The exact price depends on your book's length and complexity, from $2 for the shortest books to $35 for the most comprehensive, and it's shown when you review your book, before you commit to anything. Each book is a one-time purchase, yours to keep, no subscription. Licenses that let you share, teach, or publish your book range from $35.99 to $49.99.
- Can I preview the book before purchasing?
Before you pay, you'll see what your book will cover: the title, a detailed description, the estimated length, and the complete chapter-by-chapter table of contents, so you know what you're getting before you decide. The full text itself is written after you purchase.
- How long does it take to create a book?
About 10 minutes. You can start reading the opening chapters while the rest is still being written.