JVM Bytecode Mastery
Advanced Debugging, Memory Analysis, and Custom Tool Development
Picture yourself confidently diving into the most complex production issues, armed with deep knowledge of how the JVM actually executes your code.
98 pages5 chaptersSep 10, 2025Java
About this book
You'll trace through bytecode with precision, understand exactly how memory is allocated and managed, and build custom tools that solve problems others can't even diagnose. This comprehensive guide takes you beyond surface-level Java programming into the heart of the JVM itself. You'll master the art of bytecode analysis, learning to read and interpret the low-level instructions that drive your applications. Through practical examples and real-world scenarios, you'll develop the skills to debug issues that traditional debugging approaches simply cannot reach. You'll explore advanced stack frame analysis techniques, gaining intimate knowledge of how method calls, local variables, and operand stacks interact during program execution. The book provides detailed coverage of JVM memory layout, enabling you to optimize performance and diagnose memory-related issues with surgical precision. By the end of this journey, you'll possess the expertise to create sophisticated bytecode debugging tools, build custom classloaders for specialized requirements, and approach JVM-related challenges with the confidence of a true platform expert. Your understanding of Java will be transformed from knowing the language to mastering the runtime environment that powers it.
Table of contents
- IntroductionJVM Architecture Overview, Bytecode Fundamentals, The Bytecode Debugging Mindset, Essential Toolchain SetupRead below
- Chapter 1: Bytecode Structure and Instruction SetClass File Format Deep Dive, Instruction Categories and Patterns, Constant Pool Analysis, Method Signatures and Descriptors
- Chapter 2: JVM Stack Frame AnalysisStack Frame Structure and Components, Local Variable Table Management, Operand Stack Operations, Method Call and Return Mechanics
- Chapter 3: JVM Memory Layout and ManagementHeap Organization and Object Storage, Method Area and Metaspace, Stack Regions and Thread Isolation, Memory-Related Debugging Techniques
- Chapter 4: Bytecode Debugging Tools and TechniquesAdvanced javap Usage, ASM Framework for Bytecode Analysis, Building Custom Debugging Solutions, Integrating with Profiling Tools
- Chapter 5: Custom Classloader DevelopmentClassloader Hierarchy and Delegation, Bytecode Verification Process
Introduction
The Java Virtual Machine represents one of the most sophisticated runtime environments ever created, yet most developers interact with it only through the high-level abstractions of the Java language. Beneath the familiar syntax of classes, methods, and objects lies a complex world of bytecode instructions, stack frames, and memory management that directly determines how your applications behave in production. Understanding these internals transforms you from someone who writes Java code into someone who truly comprehends how that code executes at the machine level.
When production systems fail in mysterious ways, when performance bottlenecks appear without obvious cause, or when debugging tools provide insufficient insight into runtime behavior, the answers often lie in the bytecode itself. The JVM's execution model follows precise rules that govern everything from method invocation to garbage collection, and these rules become visible only when you can read and interpret the low-level instructions that drive your applications. This knowledge enables you to diagnose issues that surface-level debugging approaches simply cannot reach.
Modern software development increasingly demands deeper platform expertise as applications become more complex and performance requirements more stringent. The ability to analyze bytecode, understand stack frame mechanics, and create custom debugging tools represents a significant competitive advantage in today's development landscape. This book provides the comprehensive foundation you need to master these advanced concepts and apply them to real-world challenges.
Throughout this journey, you'll develop practical skills that extend far beyond theoretical knowledge. You'll learn to read bytecode as fluently as Java source code, understand exactly how the JVM manages memory and execution flow, and build sophisticated tools that solve problems others cannot even identify. The techniques covered here will fundamentally change how you approach debugging, performance optimization, and system architecture decisions.
JVM Architecture Overview
The Java Virtual Machine operates as a sophisticated execution environment that transforms bytecode into native machine instructions while providing platform independence and memory safety. At its core, the JVM consists of several interconnected subsystems that work together to load, verify, and execute Java programs. The class loading subsystem handles the dynamic loading and linking of classes, while the execution engine interprets or compiles bytecode into native code. The memory management system provides automatic allocation and garbage collection, ensuring that applications can focus on business logic rather than manual memory management.
Understanding the JVM's architecture begins with recognizing its role as an abstract machine that provides a consistent execution environment across different operating systems and hardware platforms. The specification defines precise behavior for bytecode execution, memory layout, and thread management, ensuring that Java programs behave identically regardless of the underlying platform. This abstraction layer enables the write once, run anywhere
philosophy while providing the foundation for advanced debugging and analysis techniques.
The JVM's execution model centers around the concept of stack-based computation, where operations manipulate values on an operand stack rather than using registers like traditional processors. This design simplifies bytecode generation and verification while providing a clean abstraction for method execution. Each thread maintains its own stack containing frames for active method invocations, and each frame contains local variables, an operand stack, and references to the runtime constant pool. Understanding this model is crucial for effective bytecode analysis and debugging.
Memory organization within the JVM follows a carefully designed structure that separates different types of data and provides efficient access patterns for common operations. The heap stores object instances and arrays, organized into generations to optimize garbage collection performance. The method area (or metaspace in modern JVMs) contains class metadata, method bytecode, and the runtime constant pool. Thread-specific areas include the program counter register, JVM stack, and native method stack, each serving specific roles in program execution.
The relationship between these architectural components becomes critical when analyzing runtime behavior and diagnosing complex issues. For example, understanding how the constant pool resolves symbolic references enables you to trace method invocation patterns and identify performance bottlenecks. Similarly, comprehending stack frame structure allows you to analyze variable scoping, exception handling, and method call overhead with precision that traditional debugging tools cannot provide.
Modern JVM implementations include sophisticated optimization engines that perform just-in-time compilation, method inlining, and dead code elimination. These optimizations can significantly alter the runtime behavior compared to naive bytecode interpretation, making it essential to understand both the specification and implementation details. The HotSpot JVM, for instance, uses adaptive optimization based on runtime profiling data, which means that frequently executed code paths receive more aggressive optimization than cold code.
Class loading represents one of the most complex aspects of JVM architecture, involving multiple phases of loading, linking, and initialization. The bootstrap classloader loads core Java classes, while extension and application classloaders handle additional libraries and user code. Understanding the delegation model and security constraints of class loading becomes essential when building custom classloaders or diagnosing classpath-related issues in complex applications.
The JVM's threading model provides the foundation for concurrent execution while maintaining memory consistency and thread safety. Each thread operates independently with its own stack and program counter, but threads share access to the heap and method area. The Java Memory Model defines precise rules for how threads interact with shared memory, including visibility guarantees and ordering constraints that directly impact the correctness of concurrent programs.
Bytecode Fundamentals
Java bytecode serves as the intermediate representation between high-level Java source code and native machine instructions, providing a platform-independent instruction set that the JVM can execute efficiently. Each bytecode instruction consists of a single-byte opcode followed by zero or more operands, creating a compact and well-defined instruction format. The instruction set includes approximately 200 opcodes covering arithmetic operations, object manipulation, control flow, and method invocation, each designed to operate on the JVM's stack-based execution model.
The transformation from Java source code to bytecode follows predictable patterns that become recognizable with experience. Simple arithmetic expressions translate to sequences of load, operation, and store instructions, while method calls involve more complex sequences of argument preparation, invocation, and result handling. Understanding these patterns enables you to predict bytecode structure from source code and, conversely, infer the original source structure from bytecode analysis. This bidirectional understanding proves invaluable when debugging optimized or obfuscated code where source-level debugging provides insufficient information.
Bytecode instructions operate on a typed stack machine where each value has an associated type that determines valid operations and storage requirements. The JVM maintains strict type safety at the bytecode level, preventing operations that could compromise memory safety or program correctness. For example, the iadd instruction specifically adds two integer values, while fadd handles floating-point addition. This type specificity extends to load and store operations, with separate instructions for different data types and storage locations.
Control flow in bytecode uses explicit jump instructions rather than the structured control statements familiar from high-level languages. Conditional branches like ifeq (jump if equal to zero) and if_icmpne (jump if integers not equal) provide the building blocks for implementing if statements, loops, and switch constructs. Understanding how the compiler translates high-level control structures into these primitive jump instructions helps you analyze complex control flow patterns and identify optimization opportunities.
Method invocation represents one of the most complex aspects of bytecode, involving multiple instruction types depending on the invocation context. The invokevirtual instruction handles normal instance method calls with dynamic dispatch, while invokespecial handles constructor calls and private method invocations. The invokestatic instruction manages static method calls, and invokeinterface handles interface method invocations with additional overhead for interface resolution. Modern JVMs also support invokedynamic, which enables dynamic language features and lambda expressions through runtime method resolution.
Object creation and manipulation in bytecode involves a sequence of instructions that allocate memory, initialize fields, and establish object references. The new instruction allocates memory for an object instance, followed by dup to duplicate the reference for constructor invocation, then invokespecial to call the constructor. Field access uses getfield and putfield for instance fields, or getstatic and putstatic for static fields. Array operations have their own instruction set, including newarray for primitive arrays and anewarray for object arrays.
Exception handling in bytecode relies on exception tables that map instruction ranges to exception handlers, rather than the try-catch syntax visible in source code. Each method contains an exception table that specifies which instructions are protected, what exception types are caught, and where control should transfer when exceptions occur. The athrow instruction explicitly throws exceptions, while the JVM automatically throws exceptions for runtime errors like null pointer dereferences or array bounds violations.
Local variable management in bytecode uses numbered slots rather than named variables, with specific instructions for loading and storing values in these slots. The iload_0 instruction loads an integer from local variable slot 0, while astore_3 stores an object reference in slot 3. The compiler optimizes local variable usage by reusing slots for variables with non-overlapping lifetimes, making it essential to understand the relationship between source-level variable names and bytecode slot numbers when debugging.
Constant values in bytecode are handled through the runtime constant pool, with instructions like ldc (load constant) retrieving values by index. The constant pool contains not only literal values but also symbolic references to classes, methods, and fields that are resolved during class loading and linking. This indirection enables dynamic linking and supports features like reflection, but it also adds complexity to bytecode analysis since the full meaning of an instruction often depends on constant pool contents.
The Bytecode Debugging Mindset
Developing proficiency in bytecode debugging requires a fundamental shift in how you approach problem-solving and system analysis. Traditional debugging focuses on source code behavior, variable values, and method execution flow as presented by the compiler and IDE. Bytecode debugging, however, demands that you think in terms of stack operations, memory layout, and instruction-level execution patterns. This perspective reveals the underlying mechanics that drive program behavior and exposes issues that remain invisible at the source code level.
The most significant mental adjustment involves understanding that the JVM operates on a different abstraction level than your source code suggests. When you write int result = a + b;, you're actually describing a sequence of operations: load variable a onto the operand stack, load variable b onto the stack, execute an integer addition instruction, and store the result in the local variable slot for result. Each of these steps can potentially fail or behave unexpectedly, and bytecode-level analysis allows you to examine each operation individually.
Effective bytecode debugging requires developing pattern recognition skills that connect high-level programming constructs to their low-level implementations. Method calls translate to argument preparation, invocation instructions, and result handling. Exception handling becomes a matter of exception table entries and stack unwinding. Object creation involves memory allocation, reference management, and constructor invocation sequences. By recognizing these patterns, you can quickly navigate between source code understanding and bytecode analysis.
One of the most powerful aspects of the bytecode debugging mindset is the ability to reason about program behavior independent of source code availability. When working with third-party libraries, obfuscated code, or dynamically generated classes, source-level debugging becomes impossible or misleading. Bytecode analysis provides a consistent foundation for understanding program behavior regardless of how the code was originally written or transformed. This capability proves invaluable when diagnosing issues in complex enterprise applications with multiple layers of frameworks and libraries.
The debugging mindset also emphasizes the importance of understanding the JVM's execution model rather than just the Java language semantics. For example, method overriding involves virtual method table lookups that can be analyzed at the bytecode level to understand performance characteristics and potential optimization opportunities. Similarly, interface method calls have different performance implications than class method calls due to the additional resolution overhead, which becomes apparent only through bytecode analysis.
Memory-related issues require particular attention to the relationship between bytecode instructions and JVM memory management. Object allocation patterns, reference management, and garbage collection behavior all have direct connections to the bytecode instruction sequences that create and manipulate objects. Understanding these connections enables you to identify memory leaks, optimize allocation patterns, and diagnose garbage collection performance issues with precision that heap dumps and profilers cannot provide.
Concurrency issues present another area where bytecode-level understanding provides crucial insights. The Java Memory Model defines specific rules about how bytecode instructions interact with shared memory, including visibility guarantees and ordering constraints. Race conditions, deadlocks, and other concurrency bugs often manifest as subtle interactions between bytecode instruction sequences executing on different threads. Analyzing these interactions requires understanding both the bytecode instruction semantics and the JVM's memory consistency model.
The bytecode debugging mindset also emphasizes the importance of tool integration and automation. While manual bytecode analysis provides deep insights, practical debugging often requires combining multiple tools and techniques to build a complete picture of program behavior. This might involve using javap to disassemble classes, ASM to analyze bytecode programmatically, profilers to identify hotspots, and custom instrumentation to gather runtime data. The key is developing workflows that leverage each tool's strengths while compensating for their limitations.
Perhaps most importantly, the bytecode debugging mindset recognizes that understanding the JVM's behavior enables you to write better Java code from the beginning. When you understand how different language constructs translate to bytecode, you can make informed decisions about performance trade-offs, memory usage patterns, and optimization strategies. This knowledge transforms debugging from a reactive process of fixing problems to a proactive approach of preventing issues through better design and implementation choices.
Essential Toolchain Setup
Building an effective bytecode analysis and debugging environment requires carefully selecting and configuring tools that complement each other while providing comprehensive coverage of JVM internals. The foundation of any bytecode debugging toolkit starts with the standard JDK utilities, particularly javap for disassembly and jcmd for runtime analysis. These tools provide immediate access to bytecode structure and JVM state without requiring additional installations or complex configurations. However, their capabilities represent only the starting point for serious bytecode analysis work.
The javap disassembler serves as your primary window into compiled bytecode, offering multiple verbosity levels and output formats to suit different analysis needs. The basic command javap -c ClassName displays method bytecode with instruction mnemonics, while javap -v ClassName provides verbose output including constant pool contents, method signatures, and class metadata. For detailed analysis, the combination javap -c -v -p ClassName reveals private members alongside complete bytecode and metadata, giving you full visibility into class structure and implementation details.
Advanced bytecode manipulation and analysis requires the ASM framework, a powerful library that provides both high-level and low-level APIs for reading, writing, and transforming Java bytecode. ASM's visitor pattern enables efficient processing of large codebases while maintaining memory efficiency, making it suitable for both interactive analysis and automated tooling. The framework includes utilities for bytecode verification, control flow analysis, and instruction pattern matching that significantly extend your analytical capabilities beyond what command-line tools can provide.
Setting up ASM for bytecode analysis involves adding the core ASM dependencies to your development environment and creating utility classes for common analysis tasks. A typical setup includes the asm, asm-tree, and asm-util modules, which provide the core API, tree-based representation, and debugging utilities respectively. The tree API proves particularly useful for complex analysis tasks that require multiple passes over the bytecode or sophisticated pattern matching across instruction sequences.
Memory analysis and heap debugging require specialized tools that can correlate bytecode execution with memory allocation patterns. Eclipse Memory Analyzer (MAT) provides sophisticated heap dump analysis capabilities, while JProfiler and YourKit offer real-time profiling with bytecode-level granularity. These tools become particularly powerful when combined with custom instrumentation that correlates specific bytecode instruction sequences with memory allocation and garbage collection behavior.
For runtime bytecode analysis and dynamic instrumentation, Java agents provide the foundation for building custom monitoring and debugging solutions. The java.lang.instrument package enables bytecode transformation at class loading time, while libraries like Byte Buddy simplify the creation of dynamic proxies and runtime code generation. Setting up a development environment for agent-based debugging involves understanding the agent lifecycle, classloader interactions, and the constraints of runtime bytecode modification.
IDE integration plays a crucial role in efficient bytecode debugging workflows. IntelliJ IDEA provides built-in bytecode viewing capabilities through the "Show Bytecode" action, while Eclipse offers similar functionality through plugins like the Bytecode Outline. However, these built-in tools often lack the depth required for serious analysis, making it valuable to configure external tool integration that allows seamless switching between source code editing and bytecode analysis.
Version control and reproducibility considerations become important when working with bytecode analysis tools, particularly when investigating issues that may be compiler or JVM version specific. Maintaining consistent tool versions across development environments ensures that bytecode analysis results remain comparable and reproducible. This includes not only the analysis tools themselves but also the target JDK versions, compiler settings, and any build-time bytecode processing tools that may affect the final class files.
Creating an effective workspace for bytecode debugging involves organizing tools, scripts, and reference materials in a way that supports efficient investigation workflows. This might include custom shell scripts for common javap invocations, template projects for ASM-based analysis tools, and reference documentation for bytecode instruction semantics. The goal is to minimize the friction between identifying a problem and beginning detailed bytecode analysis, enabling you to maintain focus on the investigation rather than tool configuration.
Finally, establishing connections between your bytecode analysis toolkit and production monitoring systems enables proactive identification of issues that require deep analysis. This might involve custom metrics that correlate bytecode patterns with performance characteristics, alerting systems that trigger detailed analysis when specific conditions occur, or automated tools that generate bytecode analysis reports for performance regressions. The key is building bridges between high-level system monitoring and low-level bytecode analysis to create a comprehensive debugging and optimization workflow.
This is the end of the free sample. The full book has 5 chapters.
Want this book written for you?
Tell us your goals and background, and get your own version of this book, tailored by AI to you.


Benefits of AI-tailored books
- Read one book, not ten:
- all the Java knowledge you need, gathered into a single book.
- Save days of learning:
- tell us your goals, choose your topics, and the whole book is built around them.
- Learn effortlessly:
- Java book written for your specific background and expertise.
- Understand at a glance:
- includes charts, tables, timelines, checklists, decision trees, and more.
- Stay current:
- written the day you order it, not years ago.
- Trust what you read:
- every book is checked for accuracy, with real research when your subject needs it.
Create your unique book in 3 steps
- 1. Select your focus
Select the focus of your Java book and share your background
- 2. Personalize your book
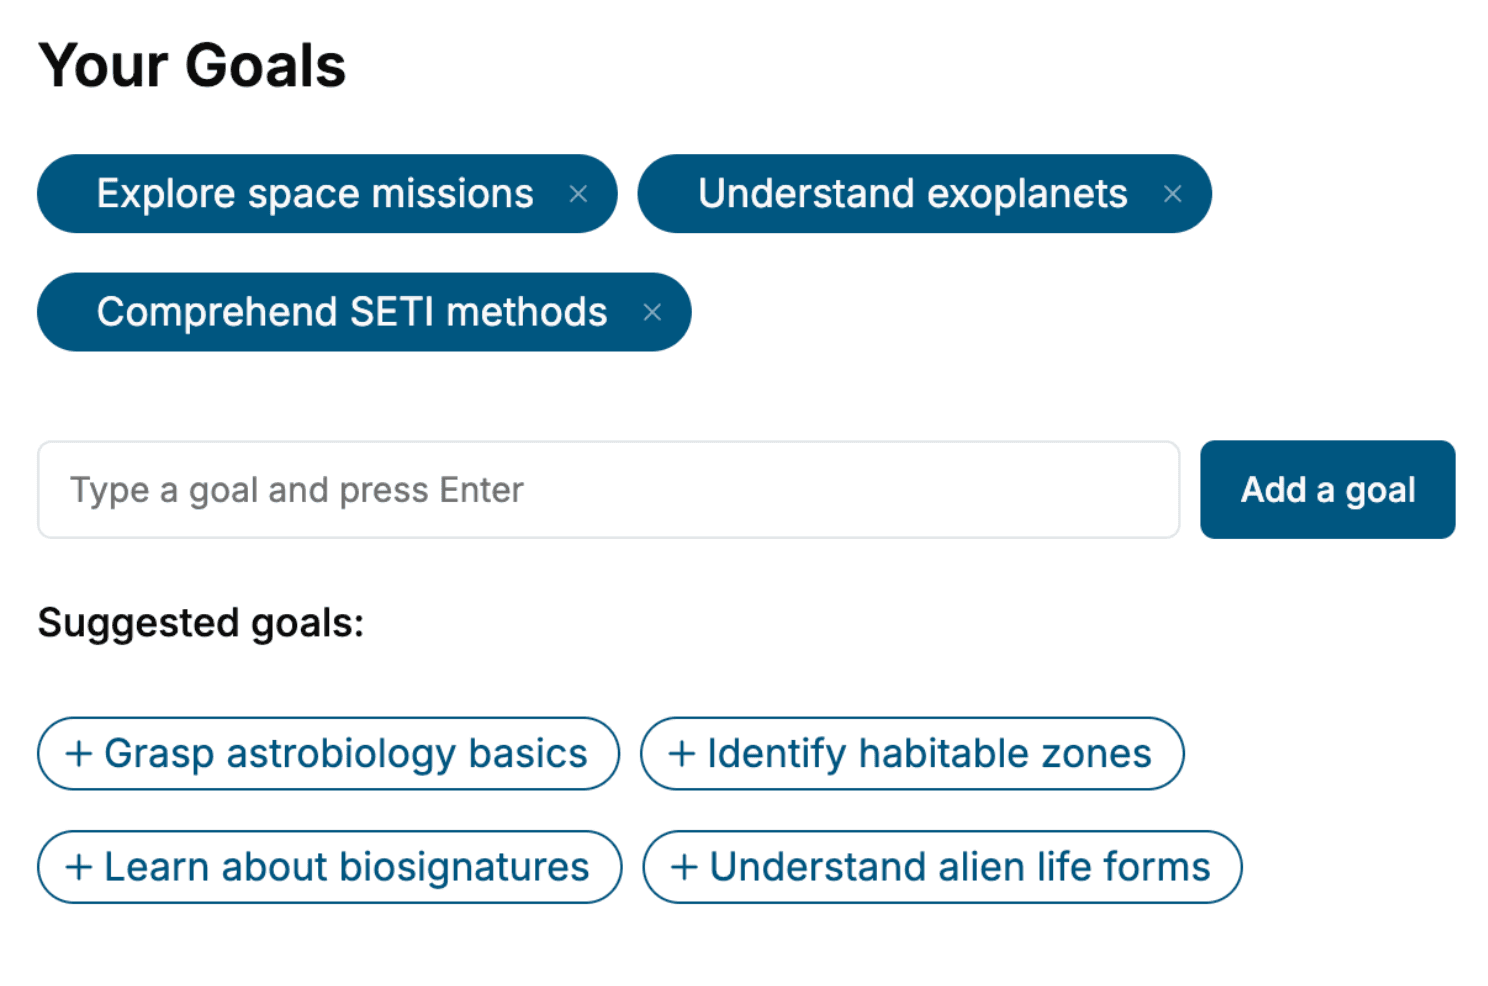
Specify your goals and choose sub-topics to include
- 3. Get your tailored book
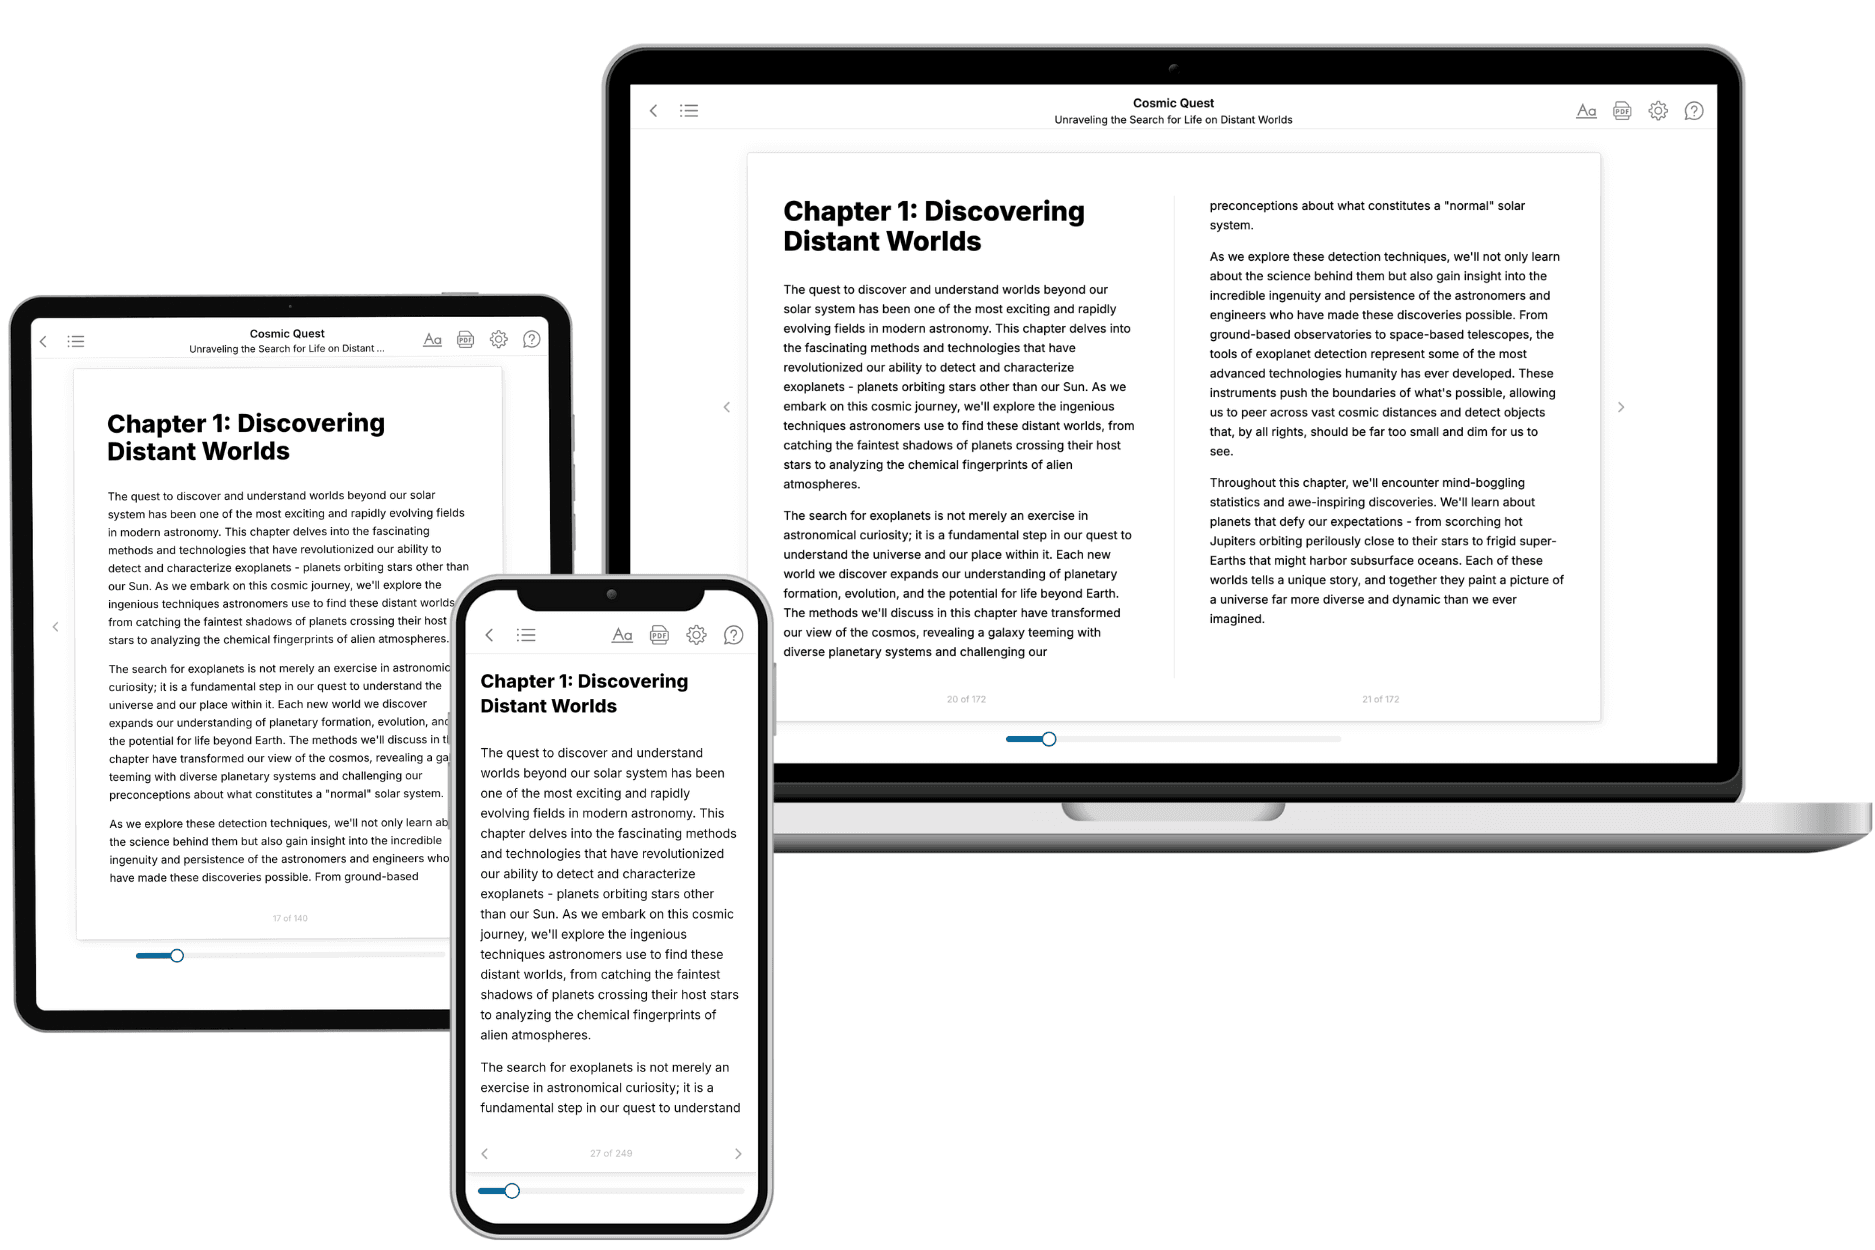
Your book is ready in 10 minutes. Read it online, download as EPUB or PDF, or send to Kindle.

Frequently asked questions
- What is TailoredRead?
TailoredRead creates complete, full-length nonfiction ebooks, written specifically for you. Tell us what you want to learn and why, and TailoredRead writes you a complete ebook on it, with charts, tables, and diagrams throughout. Read it online, on Kindle, or on any e-reader, or download it as a PDF or EPUB. Every book is written fresh the day you order it.
- How is the book tailored to me?
Before anything is written, you answer a few short questions about your goals, your background, and the topics you care about. Your book is then planned around your answers: written at your level, focused on your goals, and covering the topics you chose, instead of the one-size-fits-all book a store sells everyone.
- Will it read like generic AI content?
No. Your book isn't a chat transcript: it's planned chapter by chapter before a single word is written, told in a clear book voice, and explains ideas visually with charts, tables, and diagrams. After writing, every book goes through an editorial pass that polishes chapters so the book reads consistent from start to finish. Judge for yourself: browse thousands of sample books on our Explore Books page.
- How accurate is the content?
Our AI first checks whether your subject needs live research. Niche and fast-moving subjects are researched before writing, and the book plan and chapters are grounded in what it finds. After writing, every book goes through a quality pass that checks its facts and consistency, and researched books list their sources in a Notes section at the back.
- How long is the book?
You choose the length: Comprehensive (250-300 pages), Detailed (150-200 pages), Essential (70-100 pages), or Short (30-50 pages).
- Does the book include visuals?
Yes. Every book includes charts, tables, and diagrams: timelines, checklists, step-by-step guides, decision trees, comparison tables, matrices, and bar charts. A typical book includes dozens of these visual elements.
- Can I read it on Kindle? What formats can I download?
Yes. Every book can be read in our online reader or downloaded as a PDF or EPUB. The EPUB can be opened with Kindle, Apple Books, Kobo, and any e-reader. The Commercial and Author licenses also include an editable Word (DOCX) and Markdown download.
- How much does it cost?
About the price of a regular ebook. The exact price depends on your book's length and complexity, from $2 for the shortest books to $35 for the most comprehensive, and it's shown when you review your book, before you commit to anything. Each book is a one-time purchase, yours to keep, no subscription. Licenses that let you share, teach, or publish your book range from $35.99 to $49.99.
- Can I preview the book before purchasing?
Before you pay, you'll see what your book will cover: the title, a detailed description, the estimated length, and the complete chapter-by-chapter table of contents, so you know what you're getting before you decide. The full text itself is written after you purchase.
- How long does it take to create a book?
About 10 minutes. You can start reading the opening chapters while the rest is still being written.