Linear Regression Mastery
From Theory to Predictive Models in Data Science and Machine Learning
Elevate your data science capabilities by mastering linear regression—the most fundamental yet powerful predictive modeling technique in machine learning.
207 pages9 chaptersMar 9, 2026Machine Learning
About this book
This comprehensive guide bridges the gap between statistical theory and practical application, equipping you with both the conceptual understanding and hands-on skills needed to build robust predictive models. You'll learn how to formulate regression problems, validate critical assumptions, engineer features effectively, and interpret results with confidence. Discover how regularization techniques prevent overfitting, explore advanced topics like multicollinearity and heteroscedasticity, and understand why linear regression remains essential even in the age of deep learning. Through real-world examples and practical workflows, you'll develop the intuition to know when and how to apply linear regression, troubleshoot common issues, and communicate findings to stakeholders. Whether you're building your first predictive model or refining your machine learning expertise, this book provides the clarity and depth needed to excel.
Table of contents
- IntroductionWhy Linear Regression Matters in Modern Data Science, How to Use This Book, What You Need to Know Before StartingRead below
- Chapter 1: Foundations of Linear RegressionUnderstanding Regression as a Predictive Tool, Simple vs. Multiple Linear Regression, The Regression Equation and Its Components, The Cost Function and Least Squares Method
- Chapter 2: Mathematical Foundations and OptimizationMatrix Algebra in Regression, Gradient Descent and Parameter Estimation, The Normal Equation and Closed-Form Solutions, Convergence and Optimization Challenges
- Chapter 3: Model Assumptions and DiagnosticsThe Five Critical Assumptions of Linear Regression, Testing for Linearity, Residual Analysis and Diagnostic Plots, What to Do When Assumptions Are Violated
- Chapter 4: Feature Engineering and SelectionIdentifying and Creating Relevant Features, Scaling, Normalization, and Encoding Techniques, Feature Selection Methods and Best Practices, Polynomial and Interaction Features
- Chapter 5: Regularization and Preventing OverfittingUnderstanding Overfitting and Underfitting, Ridge Regression (L2 Regularization), Lasso Regression (L1 Regularization), Elastic Net and Hybrid Approaches
- Chapter 6: Model Evaluation and ValidationTrain-Test Splitting and Data Leakage Prevention, Cross-Validation Strategies, Regression Metrics: MSE, RMSE, MAE, and R-squared, Comparing and Selecting Models
- Chapter 7: Advanced Topics and Common ChallengesDetecting and Handling Multicollinearity, Heteroscedasticity and Weighted Regression, Outliers, Leverage, and Influential Points, Autocorrelation in Time Series Data
- Chapter 8: Interpreting Results and Communicating InsightsInterpreting Regression Coefficients, P-values, Confidence Intervals, and Statistical Significance, Translating Statistical Results into Business Insights, Effective Visualization of Regression Results
- Chapter 9: Practical Implementation and WorkflowsBuilding Regression Models in Python, End-to-End Regression Project Workflow, Deploying and Monitoring Regression Models
- ConclusionKey Takeaways and Next Steps, Advancing Beyond Linear Regression
- Glossary of Terms
- Further Reading and Resources
Introduction
Every predictive model you will ever build rests on a foundation. That foundation, more often than not, is linear regression. It is the algorithm that statisticians have trusted for over two centuries, the benchmark that machine learning engineers reach for first, and the conceptual lens through which more complex models become understandable. Yet despite its age and apparent simplicity, linear regression is routinely misunderstood, misapplied, and underestimated. This book exists to change that.
Linear regression is not just a stepping stone to "real" machine learning. It is a powerful, production-ready tool that drives decisions in finance, healthcare, marketing, real estate, and dozens of other industries every single day. When a bank estimates the credit risk of a loan applicant, when a retailer forecasts next quarter's sales, or when a hospital predicts patient readmission rates, linear regression is frequently at the core of that analysis. Understanding it deeply is not optional for a serious data professional. It is essential.
This book is designed for intermediate data professionals and aspiring machine learning practitioners who already have some exposure to statistics and programming but want to move beyond surface-level familiarity. You will not just learn what linear regression is. You will learn how it works mathematically, why its assumptions matter, how to diagnose and fix problems, and how to communicate results in ways that drive real decisions. By the end, you will have both the theory and the practical workflow to build regression models you can trust and defend.
The journey ahead covers everything from the basic regression equation to regularization techniques like Ridge and Lasso, from residual diagnostics to production deployment. Each chapter builds on the last, so the concepts compound as you progress. Whether you are building your first predictive model or refining work you have already done in the field, there is something here that will sharpen your thinking and improve your practice.
Why Linear Regression Matters in Modern Data Science
It is tempting to dismiss linear regression as old technology in a field that celebrates neural networks, gradient boosting, and transformer architectures. That temptation is worth resisting. Linear regression has survived and thrived for a reason: it works, it is interpretable, and it provides a clear baseline against which every other model must be measured. In many real-world scenarios, it outperforms far more complex alternatives because it avoids overfitting on limited data.
Consider a concrete example. A mid-sized e-commerce company wants to predict how much a customer will spend in the next 30 days based on their browsing history, past purchases, and account age. A data scientist might immediately reach for a gradient boosting model or a deep neural network. But a well-tuned linear regression model, built with thoughtful feature engineering, will often produce predictions that are nearly as accurate while being far easier to explain to a product manager or a CFO. Interpretability is not a luxury. In regulated industries, it is a legal requirement.
Linear regression also serves as the conceptual backbone for understanding more advanced algorithms. Logistic regression, which is used for classification, is a direct extension of the linear model. Support vector machines share geometric intuitions with regression. Neural networks, at their most basic level, are stacked linear transformations with nonlinear activations applied on top. If you do not understand linear regression deeply, you will always be working with more complex models at a surface level, unable to diagnose why they fail or how to improve them.
The interpretability advantage of linear regression is particularly valuable in business settings. When a regression model tells you that each additional year of customer tenure is associated with a $47 increase in annual spending, that is an actionable insight. A marketing team can design retention programs around it. A pricing team can factor it into their models. A neural network might achieve slightly better predictive accuracy, but it cannot give you that kind of clear, quantified relationship between inputs and outputs.
Research consistently shows that simpler models generalize better when data is limited or noisy. A landmark study in machine learning benchmarking found that linear models were competitive with or superior to complex alternatives in a significant portion of tabular data tasks, particularly when datasets had fewer than 10,000 rows.[1] This does not mean you should always use linear regression, but it does mean you should always consider it and understand when it is the right tool.
Finally, linear regression is the standard starting point for any regression problem because it establishes a performance floor. If your fancy model cannot beat a simple linear regression baseline, something is wrong, either with your model, your features, or your data. Building that baseline correctly, and knowing how to interpret it, is a skill that separates competent data scientists from great ones.
A practical rule of thumb: Always build a linear regression baseline before reaching for a more complex model. If the complex model does not meaningfully outperform it, the simpler model is almost always the better choice for production use.
The modern data science landscape is full of tools that make it easy to train a model in three lines of code. What is harder, and more valuable, is knowing what that model is actually doing, whether its outputs can be trusted, and how to improve it when it falls short. That deeper understanding starts with linear regression, and this book will give it to you.
How to Use This Book
This book is structured as a progressive journey. Each chapter introduces new concepts that build on what came before, so reading from start to finish will give you the most coherent experience. That said, if you already have solid grounding in certain areas, the chapters are designed to be self-contained enough that you can jump to the sections most relevant to your current work.
Here is a quick map of what each part of the book covers and who will benefit most from it:
- Chapters 1 and 2 (Foundations and Mathematics): These chapters cover the regression equation, the least squares method, matrix algebra, and gradient descent. If you are new to regression or want to solidify your mathematical intuition, start here. If you already know these topics well, a quick skim will confirm whether you can move ahead.
- Chapter 3 (Assumptions and Diagnostics): This is one of the most practically important chapters in the book. Many practitioners skip assumption checking and pay for it later with unreliable models. Do not skip this chapter.
- Chapter 4 (Feature Engineering): This chapter covers how to prepare and transform your data for regression. It is highly practical and includes techniques you can apply immediately to any dataset.
- Chapter 5 (Regularization): Ridge, Lasso, and Elastic Net are covered here. If you are working with high-dimensional data or struggling with overfitting, this chapter is essential.
- Chapter 6 (Evaluation and Validation): Learn how to measure model performance honestly, avoid data leakage, and use cross-validation correctly. This chapter is critical for anyone preparing models for production.
- Chapter 7 (Advanced Challenges): Multicollinearity, heteroscedasticity, outliers, and autocorrelation are covered here. This is where you learn to troubleshoot models that are not behaving as expected.
- Chapter 8 (Interpretation and Communication): Learn how to translate statistical outputs into business language. This chapter is especially valuable if you present findings to non-technical stakeholders.
- Chapter 9 (Implementation and Deployment): End-to-end Python workflows, project structure, and model deployment are covered here. This is the most hands-on chapter in the book.
Throughout the book, you will find several recurring elements designed to reinforce learning. Concrete examples ground every concept in a realistic scenario. Code snippets in Python show you exactly how to implement what you are learning. Diagnostic checklists give you structured tools to apply in your own projects. Common pitfalls highlight the mistakes that practitioners make most often, so you can avoid them.
The best way to use this book is actively, not passively. When you encounter a concept, try to apply it to a dataset you are already working with or one you find interesting. The California Housing dataset, the Boston Housing dataset, and the Ames Housing dataset are all freely available and make excellent practice grounds for regression.[2] Working through examples on real data will accelerate your understanding far more than reading alone.
If you are using this book as part of a structured learning program or course, the chapter order maps naturally to a semester-length curriculum. Each chapter represents roughly one to two weeks of focused study, including time for practice and experimentation. The final chapter on implementation is designed to serve as a capstone project framework.
One important note on the code examples: all Python code in this book uses widely adopted libraries including scikit-learn, pandas, numpy, matplotlib, and statsmodels. These are the standard tools of the trade, and familiarity with them is assumed. If you need a refresher on any of these libraries, the Further Reading section at the end of the book points you to the best resources.
Finally, do not rush. Linear regression rewards careful thinking. The practitioners who get the most out of this material are the ones who slow down at the diagnostic and interpretation stages, ask hard questions about their data, and resist the urge to move on before they truly understand what their model is telling them. Take that time. It will pay off in every model you build from here forward.
What You Need to Know Before Starting
This book is written for intermediate practitioners, not complete beginners. That means certain foundational knowledge is assumed from the start. Being honest about what you need to know upfront will save you frustration and help you get the most out of every chapter. If you find gaps in your background, the Further Reading section provides targeted resources to fill them quickly.
Here is what you should be comfortable with before diving in:
- Basic statistics: You should understand mean, variance, standard deviation, correlation, and the concept of a probability distribution. You should know what a p-value is, even if you are not yet confident interpreting it in a regression context. Chapter 8 will deepen your understanding of statistical significance considerably.
- Algebra and basic calculus: You do not need to be a mathematician, but you should be comfortable with equations, variables, and the concept of a derivative. Chapter 2 introduces gradient descent, which relies on derivatives. The explanations are designed to be accessible, but some prior exposure helps.
- Linear algebra basics: Vectors and matrices appear throughout the book, especially in Chapter 2. You should know what a matrix is, how matrix multiplication works, and what a transpose is. Deep expertise is not required, but basic familiarity is.
- Python programming: All code examples are in Python. You should be able to write and run Python scripts, work with
pandasDataFrames, and usenumpyarrays. You do not need to be an expert, but you should be past the beginner stage. - Basic data manipulation: You should know how to load a dataset, inspect it for missing values, and perform basic transformations. These skills are assumed throughout the practical chapters.
If you are solid on all of the above, you are ready to start. If some of these areas feel shaky, here is a practical approach: do not wait until you feel fully prepared before starting the book. Instead, begin reading and note the specific concepts that feel unfamiliar. Then use targeted resources to fill those gaps as they come up. Learning in context is almost always faster than trying to master prerequisites in isolation.
One area worth addressing specifically is mathematics anxiety. Many data professionals have a complicated relationship with math. They can run models in Python without difficulty but feel uncertain when equations appear on the page. This book takes a deliberate approach to mathematical content: every formula is explained in plain language before and after it appears. The goal is always intuition first, formalism second. You will not be asked to derive proofs. You will be asked to understand what equations mean and why they matter for your work.
For example, when the book introduces the ordinary least squares formula in Chapter 1, it will first explain the concept in words: the algorithm finds the line that minimizes the total squared distance between the predicted values and the actual values. Then it will show the equation. Then it will walk through a numerical example. This pattern repeats throughout the book, so even if the math feels unfamiliar at first, the layered explanations will bring it into focus.
It is also worth setting expectations about what this book does not cover. It is not a general introduction to machine learning. It does not cover classification algorithms, clustering, or deep learning in depth. It does not teach Python from scratch. It is specifically and deliberately focused on linear regression, treated with the depth and rigor that a foundational technique deserves. That focus is a feature, not a limitation. Mastery comes from depth, not breadth.
A note on tools: All examples in this book were developed and tested using Python 3.10 and the following library versions:
scikit-learn 1.3,pandas 2.0,numpy 1.24,statsmodels 0.14, andmatplotlib 3.7. Minor syntax differences may exist in other versions, but the core concepts and APIs are stable across recent releases.
One final thought before you begin: the goal of this book is not to make you someone who can recite regression theory. The goal is to make you someone who can look at a real dataset, formulate a regression problem correctly, build a model that is statistically sound, evaluate it honestly, and communicate what it means to the people who need to act on it. That is a practical, professional skill. Everything in the chapters ahead is in service of that outcome.
With that context in place, it is time to get started. Chapter 1 begins with the foundations: what regression is, where it comes from, and how the basic equation works. By the end of that chapter, you will have a clear mental model of what linear regression is actually doing when it fits a line to your data. That mental model is the seed from which everything else in this book grows.
This is the end of the free sample. The full book has 9 chapters.
Want this book written for you?
Tell us your goals and background, and get your own version of this book, tailored by AI to you.


Benefits of AI-tailored books
- Read one book, not ten:
- all the Machine Learning knowledge you need, gathered into a single book.
- Save days of learning:
- tell us your goals, choose your topics, and the whole book is built around them.
- Learn effortlessly:
- Machine Learning book written for your specific background and expertise.
- Understand at a glance:
- includes charts, tables, timelines, checklists, decision trees, and more.
- Stay current:
- written the day you order it, not years ago.
- Trust what you read:
- every book is checked for accuracy, with real research when your subject needs it.
Create your unique book in 3 steps
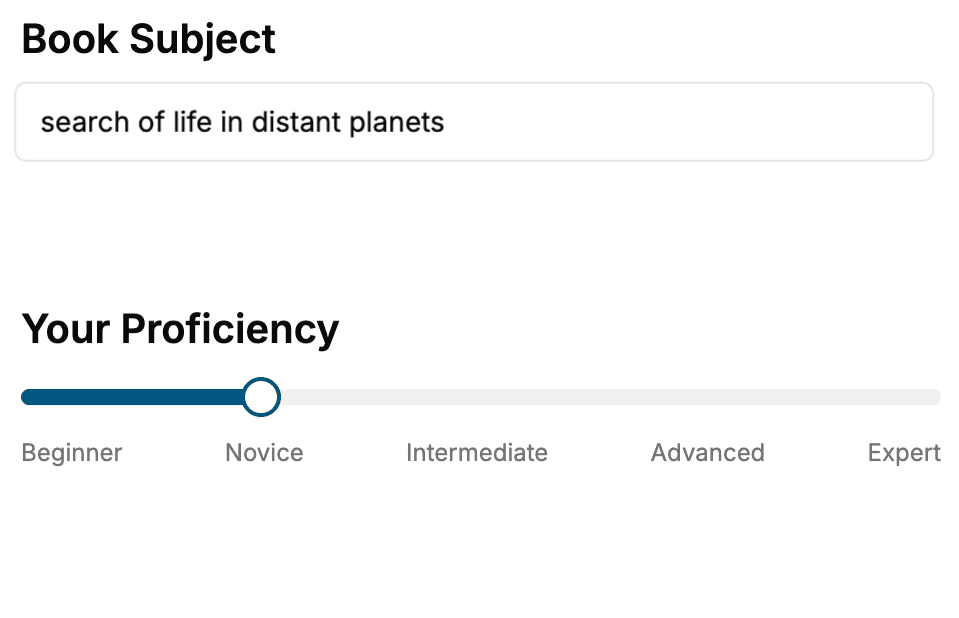
- 1. Select your focus
Select the focus of your Machine Learning book and share your background
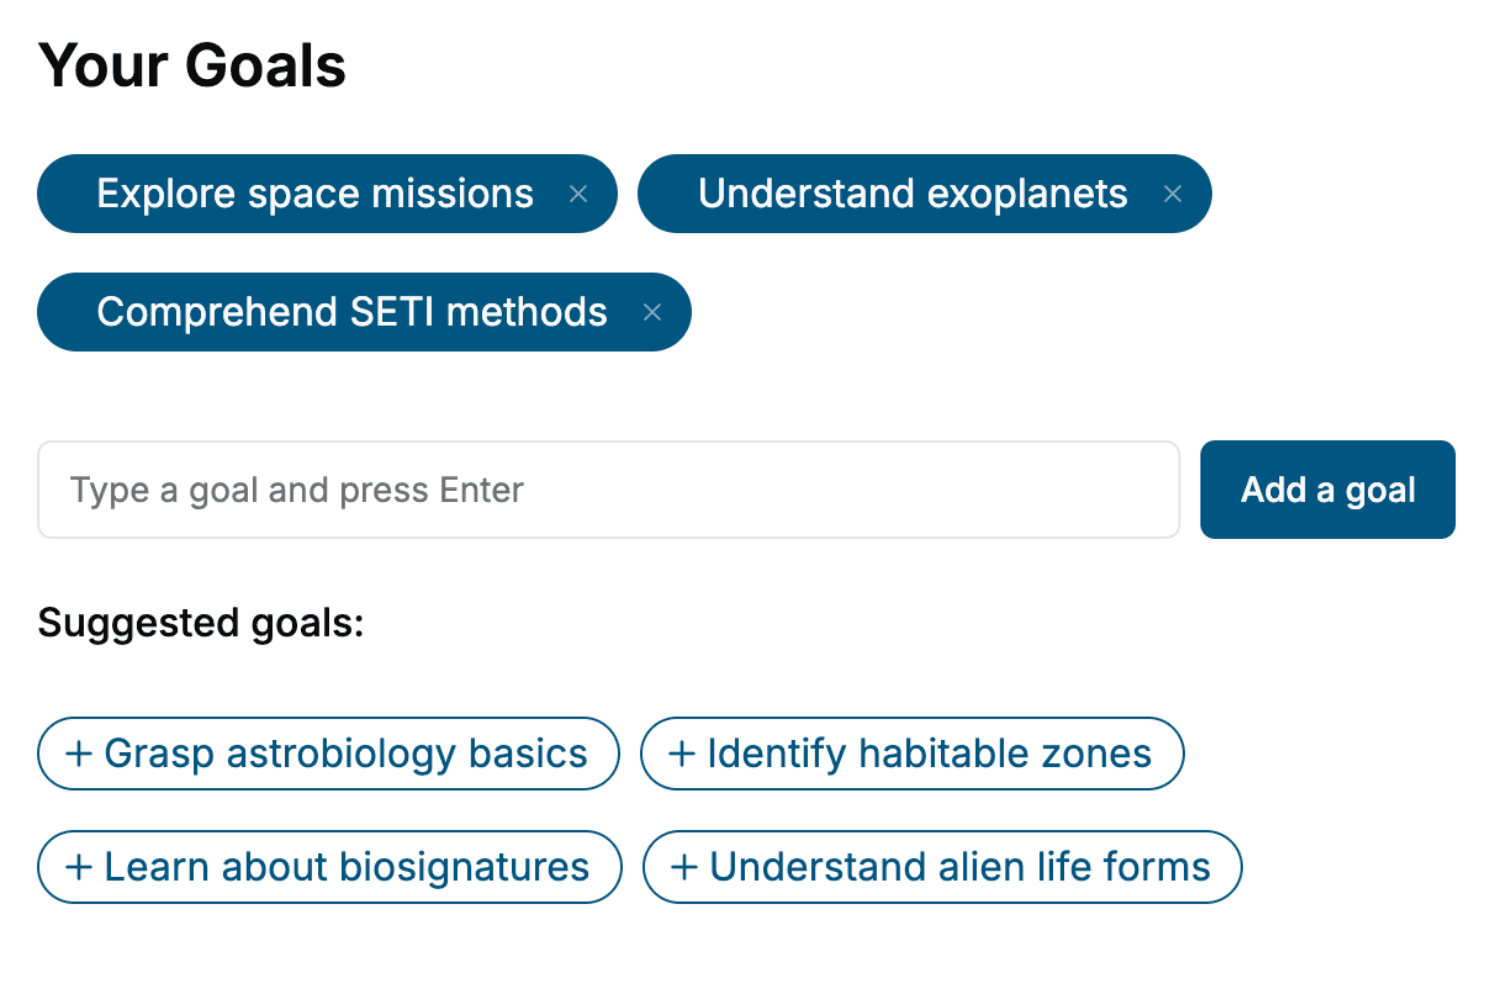
- 2. Personalize your book
Specify your goals and choose sub-topics to include
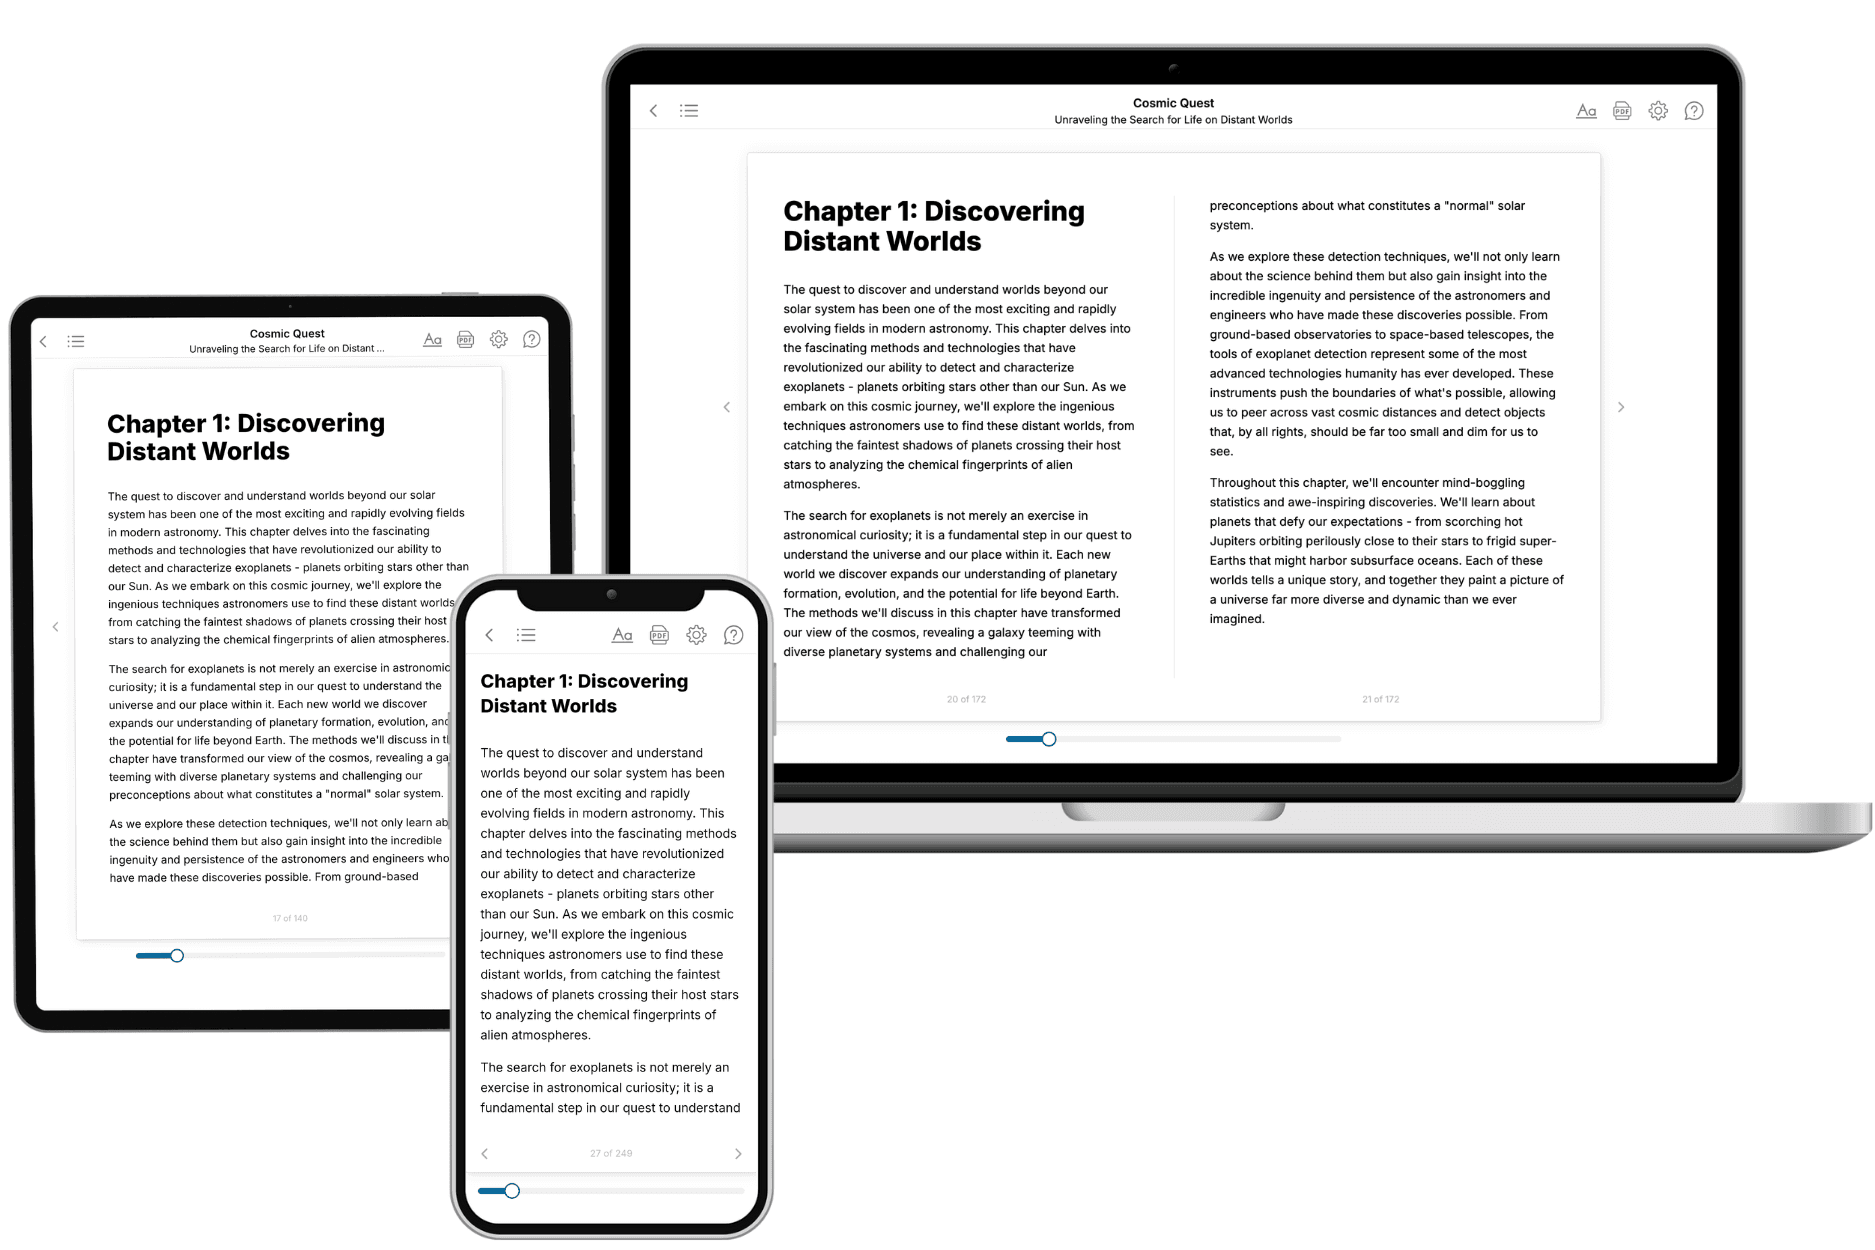
- 3. Get your tailored book
Your book is ready in 10 minutes. Read it online, download as EPUB or PDF, or send to Kindle.
Frequently asked questions
- What is TailoredRead?
TailoredRead creates complete, full-length nonfiction ebooks, written specifically for you. Tell us what you want to learn and why, and TailoredRead writes you a complete ebook on it, with charts, tables, and diagrams throughout. Read it online, on Kindle, or on any e-reader, or download it as a PDF or EPUB. Every book is written fresh the day you order it.
- How is the book tailored to me?
Before anything is written, you answer a few short questions about your goals, your background, and the topics you care about. Your book is then planned around your answers: written at your level, focused on your goals, and covering the topics you chose, instead of the one-size-fits-all book a store sells everyone.
- Will it read like generic AI content?
No. Your book isn't a chat transcript: it's planned chapter by chapter before a single word is written, told in a clear book voice, and explains ideas visually with charts, tables, and diagrams. After writing, every book goes through an editorial pass that polishes chapters so the book reads consistent from start to finish. Judge for yourself: browse thousands of sample books on our Explore Books page.
- How accurate is the content?
Our AI first checks whether your subject needs live research. Niche and fast-moving subjects are researched before writing, and the book plan and chapters are grounded in what it finds. After writing, every book goes through a quality pass that checks its facts and consistency, and researched books list their sources in a Notes section at the back.
- How long is the book?
You choose the length: Comprehensive (250-300 pages), Detailed (150-200 pages), Essential (70-100 pages), or Short (30-50 pages).
- Does the book include visuals?
Yes. Every book includes charts, tables, and diagrams: timelines, checklists, step-by-step guides, decision trees, comparison tables, matrices, and bar charts. A typical book includes dozens of these visual elements.
- Can I read it on Kindle? What formats can I download?
Yes. Every book can be read in our online reader or downloaded as a PDF or EPUB. The EPUB can be opened with Kindle, Apple Books, Kobo, and any e-reader. The Commercial and Author licenses also include an editable Word (DOCX) and Markdown download.
- How much does it cost?
About the price of a regular ebook. The exact price depends on your book's length and complexity, from $2 for the shortest books to $35 for the most comprehensive, and it's shown when you review your book, before you commit to anything. Each book is a one-time purchase, yours to keep, no subscription. Licenses that let you share, teach, or publish your book range from $35.99 to $49.99.
- Can I preview the book before purchasing?
Before you pay, you'll see what your book will cover: the title, a detailed description, the estimated length, and the complete chapter-by-chapter table of contents, so you know what you're getting before you decide. The full text itself is written after you purchase.
- How long does it take to create a book?
About 10 minutes. You can start reading the opening chapters while the rest is still being written.