Logistic Regression Mastery
From Binary Outcomes to Actionable Insights—A Practical Guide for Data Analysts
Imagine confidently presenting logistic regression results to your stakeholders, where every coefficient tells a clear story and every prediction comes with quantified uncertainty.
191 pages8 chaptersJan 1, 2026StatisticsCreated by David
About this book
This practical guide bridges the gap between statistical theory and real-world application, designed specifically for analysts who understand the fundamentals but need to master the nuances of logistic regression modeling. You'll learn how to build models that accurately predict binary outcomes, interpret odds ratios in business language, and rigorously assess performance using confusion matrices and ROC curves. This book walks you through diagnostic procedures that catch hidden problems before they compromise your analysis, techniques for handling correlated data and ordinal variables, and strategies to prevent overfitting that undermines generalization. Whether you're analyzing customer behavior, predicting program outcomes, or evaluating intervention effectiveness, you'll gain the technical depth and practical skills to deliver insights that drive decisions. Each chapter combines conceptual understanding with hands-on application, ensuring you can immediately apply these techniques to your own data analysis challenges.
Table of contents
- IntroductionWhy Logistic Regression Matters for Performance Analysis, How to Use This Book, Core Assumptions and PrerequisitesRead below
- Chapter 1: Foundations of Logistic RegressionUnderstanding Binary Outcomes and Dichotomous Variables, The Logistic Function: From Linear to Probability, Odds, Probabilities, and Log-Odds
- Chapter 2: Building Your First Logistic Regression ModelData Preparation and Variable Selection, Maximum Likelihood Estimation and Model Fitting, Interpreting Coefficients and Intercepts
- Chapter 3: Mastering Odds Ratio InterpretationWhat Odds Ratios Tell You About Predictor Effects, Odds Ratios for Continuous and Categorical Predictors, Translating Odds Ratios into Business Language
- Chapter 4: Assessing Model PerformanceConfusion Matrices: Sensitivity, Specificity, and Accuracy, Pseudo R-Squared Metrics and Goodness-of-Fit, ROC Curves and AUC: Threshold-Independent Evaluation
- Chapter 5: Quantifying Uncertainty with Confidence IntervalsConfidence Intervals Around Parameter Estimates, Confidence Intervals for Predicted Probabilities, Statistical Significance and Practical Importance
- Chapter 6: Logistic Regression DiagnosticsResidual Analysis and Model Violations, Detecting and Addressing Multicollinearity, Influence Diagnostics and Outlier Detection
- Chapter 7: Advanced Modeling TechniquesHandling Correlated Data and Clustered Observations, Working with Ordinal Variables and Proportional Odds, Preventing Overfitting and Ensuring Generalization
- Chapter 8: Real-World Applications and Case StudiesPredicting Educational Attainment and Program Success, Performance Prediction in Organizational Settings, Comparing and Selecting Among Competing Models
- ConclusionIntegrating Logistic Regression into Your Analytical Workflow, Continuing Your Development as a Data Analyst
- Glossary of Key Terms
- Further Reading and Resources
Introduction
Every day, performance analysts face questions that demand more than simple averages or correlations. Will this student complete the program? Is this employee likely to stay with the organization? Did the intervention increase the probability of success? These questions share a common thread: they involve predicting binary outcomes—yes or no, success or failure, present or absent. Linear regression, the workhorse of many analytical toolkits, falls short when your dependent variable takes only two values. Attempting to predict probabilities with linear models produces nonsensical results: predicted values below zero or above one, relationships that ignore the bounded nature of probability, and fundamentally flawed assumptions about error distributions. This is where logistic regression becomes indispensable.
Logistic regression transforms the challenge of binary prediction into a mathematically elegant and practically powerful framework. By modeling the relationship between predictors and outcomes through the logistic function, this technique ensures predictions remain within the valid probability range while capturing nonlinear relationships between variables and outcomes. The method produces odds ratios that translate directly into business language, allowing you to communicate findings in terms stakeholders immediately understand. Beyond simple prediction, logistic regression provides a complete inferential framework: hypothesis tests for individual predictors, confidence intervals that quantify uncertainty, and diagnostic tools that reveal when assumptions fail. For performance analysts working with binary outcomes, logistic regression represents not just another statistical technique but a fundamental analytical capability.
This book addresses a specific gap in the analytical landscape. Many resources either provide superficial overviews that leave you unable to implement the technique properly, or dive into mathematical derivations that obscure practical application. You bring foundational knowledge in psychology and statistics—you understand hypothesis testing, confidence intervals, and basic regression concepts. What you need is a bridge from that foundation to confident, rigorous application of logistic regression in real-world performance analysis contexts. This introduction establishes why logistic regression matters for your work, how the book is structured to build your expertise systematically, and what assumptions and prerequisites will guide your learning journey. By the end of this book, you will not only understand logistic regression conceptually but will possess the technical skills to build, diagnose, and communicate results from logistic regression models that drive evidence-based decisions.
Why Logistic Regression Matters for Performance Analysis
Performance analysis frequently centers on understanding factors that influence binary outcomes. Consider a university retention analyst examining which students complete their degree programs versus those who withdraw. The outcome is dichotomous: completion or non-completion. Traditional linear regression applied to this scenario creates immediate problems. A linear model might predict a completion probability of 1.3 for students with high engagement scores or -0.2 for those with low attendance—values that are mathematically impossible for probabilities. More fundamentally, linear regression assumes the relationship between predictors and outcomes is constant across the entire range of predictor values, an assumption that rarely holds for binary outcomes. As predictor values increase, the probability of the outcome must eventually level off as it approaches the boundaries of zero and one, creating an inherently nonlinear relationship that linear models cannot capture.
Logistic regression solves these problems by modeling the log-odds of the outcome rather than the probability directly. The logistic function transforms any real-valued linear combination of predictors into a probability between zero and one, respecting the bounded nature of probability while maintaining interpretability. This transformation means you can include predictors of any scale—continuous variables like test scores, categorical variables like program type, or interactions between variables—and always produce valid probability predictions. The resulting model coefficients, when exponentiated, become odds ratios that quantify how changes in predictors affect the likelihood of outcomes. An odds ratio of 2.5 for study hours, for example, tells you that each additional hour of study multiplies the odds of passing by 2.5, a statement that translates directly into actionable insights for students and advisors.
The practical advantages extend beyond valid probability predictions. Logistic regression provides a complete inferential framework that supports rigorous decision-making in performance contexts:
- Hypothesis testing: Each predictor receives a statistical test determining whether its relationship with the outcome differs significantly from zero, allowing you to identify which factors genuinely influence outcomes versus those that appear important due to chance
- Confidence intervals: Every parameter estimate and predicted probability comes with confidence bounds that quantify uncertainty, enabling you to distinguish between precise estimates that warrant strong conclusions and uncertain estimates that require caution
- Model comparison: Likelihood-based fit statistics allow you to compare competing models objectively, determining whether additional predictors improve prediction sufficiently to justify increased model complexity
- Diagnostic tools: Residual analysis, influence diagnostics, and goodness-of-fit tests reveal when model assumptions fail or when specific observations exert disproportionate influence on results
Consider a concrete example from organizational performance analysis. A human resources analyst investigates factors predicting employee turnover within the first year. The outcome is binary: the employee either leaves or stays. Potential predictors include pre-hire assessment scores, starting salary, manager experience, and department size. Linear regression applied to this problem would produce predictions outside the valid range and would incorrectly assume that the effect of salary on turnover probability is constant whether salary increases from $30,000 to $40,000 or from $80,000 to $90,000. Logistic regression naturally accommodates the reality that turnover probability decreases rapidly at lower salary levels but levels off at higher salaries, capturing the nonlinear relationship accurately. The resulting odds ratios communicate findings in terms managers understand: Each $10,000 increase in starting salary reduces the odds of first-year turnover by 35%
provides clearer guidance than a linear regression coefficient.
The technique also addresses practical challenges common in performance analysis. Many datasets contain correlated predictors—employee engagement scores and job satisfaction ratings, for instance, often correlate highly. Logistic regression includes diagnostic procedures for detecting multicollinearity and assessing its impact on parameter estimates. Performance data frequently involves clustered or hierarchical structures: students nested within schools, employees within departments, repeated measures on the same individuals. While basic logistic regression assumes independent observations, extensions like mixed-effects logistic regression handle these dependencies appropriately. The framework also accommodates various predictor types seamlessly: continuous variables, categorical variables with multiple levels, ordinal variables, and interactions between variables all integrate into a single coherent model.
Beyond technical capabilities, logistic regression aligns with how stakeholders think about performance questions. Decision-makers rarely ask about mean differences or correlation coefficients. Instead, they ask probability questions: What is the likelihood this intervention will succeed? How much does this factor increase the chances of a positive outcome? Which applicants have the highest probability of success? Logistic regression answers these questions directly, producing probability predictions and odds ratios that require minimal translation for non-technical audiences. This alignment between analytical output and stakeholder needs makes logistic regression not just statistically appropriate but strategically valuable for performance analysts who must communicate findings to diverse audiences.
The method's widespread adoption across fields reinforces its practical value. Medical researchers use logistic regression to identify risk factors for diseases and predict patient outcomes. Marketing analysts apply it to predict customer conversion and churn. Educational researchers employ it to understand factors influencing student success and program completion. This cross-disciplinary adoption means that logistic regression skills transfer across contexts, and the extensive literature provides validated approaches for common challenges. When you master logistic regression, you gain not just a statistical technique but entry into a community of practice with established standards, diagnostic procedures, and communication conventions that enhance the credibility and impact of your analyses.
Finally, logistic regression serves as a foundation for more advanced techniques. Understanding logistic regression deeply prepares you for extensions like multinomial logistic regression for outcomes with more than two categories, ordinal logistic regression for ordered outcomes, and mixed-effects models for hierarchical data. The conceptual framework—modeling transformed outcomes, interpreting exponentiated coefficients, assessing model fit through likelihood-based metrics—carries forward to these advanced methods. By investing in logistic regression mastery now, you build capabilities that will support increasingly sophisticated analyses as your career progresses and your analytical challenges grow more complex.
How to Use This Book
This book follows a deliberate progression from conceptual foundations through practical application, designed to build your expertise systematically. Each chapter addresses a specific aspect of logistic regression, with concepts introduced in the order you will need them when conducting actual analyses. The structure assumes you have foundational statistical knowledge—you understand hypothesis testing, confidence intervals, and basic regression—but does not assume prior experience with logistic regression or maximum likelihood estimation. Early chapters establish core concepts and mechanics, middle chapters develop interpretation and assessment skills, and later chapters address advanced topics and real-world complications. This progression ensures you can begin applying logistic regression to simple problems quickly while building toward the sophisticated analyses required for complex performance questions.
Chapter 1 establishes the conceptual foundation by explaining why binary outcomes require a different modeling approach than continuous outcomes. You will learn how the logistic function transforms linear combinations of predictors into valid probabilities, understand the relationship between probabilities, odds, and log-odds, and see why maximum likelihood estimation replaces ordinary least squares for parameter estimation. This chapter emphasizes conceptual understanding over mathematical derivation, focusing on building intuition about what logistic regression does and why it works. By the end of Chapter 1, you will understand the fundamental logic of logistic regression and be prepared to build your first model.
Chapter 2 walks through the complete process of building a logistic regression model, from data preparation through model estimation and initial interpretation. You will learn how to prepare variables for analysis, including coding categorical predictors and handling missing data. The chapter explains maximum likelihood estimation at a conceptual level, showing how software finds parameter values that maximize the likelihood of observing your data. You will learn to interpret raw coefficients in log-odds units and understand what the intercept represents in logistic regression. Practical examples demonstrate each step using realistic performance analysis scenarios, ensuring you can immediately apply these techniques to your own data.
Chapter 3 focuses exclusively on odds ratio interpretation, the skill that transforms logistic regression from a mathematical exercise into a communication tool. You will learn to calculate and interpret odds ratios for both continuous and categorical predictors, understand how to communicate odds ratios to non-technical audiences, and recognize when odds ratios provide misleading impressions. The chapter includes extensive examples showing how to translate odds ratios into plain language statements that stakeholders can act upon. Special attention goes to common interpretation errors, such as confusing odds ratios with risk ratios or failing to account for baseline probability when communicating effect sizes.
Chapters 4 and 5 address model assessment and uncertainty quantification, essential skills for ensuring your models are reliable and your conclusions are appropriately cautious. Chapter 4 introduces multiple complementary approaches to assessing model performance: confusion matrices that reveal classification accuracy at specific thresholds, pseudo R-squared metrics that quantify overall model fit, and ROC curves that evaluate discriminative ability across all possible thresholds. You will learn when each metric is appropriate, how to interpret them correctly, and how to use them together to form a complete picture of model performance. Chapter 5 focuses on confidence intervals, showing how to construct and interpret intervals around parameter estimates and predicted probabilities. These chapters ensure you can not only build models but also assess their quality and communicate uncertainty appropriately.
Chapter 6 introduces diagnostic procedures that reveal when models violate assumptions or when specific observations exert undue influence on results. You will learn to conduct residual analysis for logistic regression, detect multicollinearity among predictors, and identify influential observations that may distort parameter estimates. This chapter emphasizes that diagnostics are not optional refinements but essential steps in any rigorous analysis. The diagnostic procedures introduced here will help you catch problems before they compromise your conclusions and will increase your confidence that your models are trustworthy.
Chapter 7 addresses advanced topics that arise frequently in real-world performance analysis: handling correlated data from clustered or repeated-measures designs, working with ordinal predictors and outcomes, and preventing overfitting that undermines model generalization. These topics build on the foundation established in earlier chapters, showing how the basic logistic regression framework extends to handle more complex data structures and research designs. By the end of Chapter 7, you will have the technical skills to handle the complications that arise in actual performance analysis projects, not just textbook examples.
Chapter 8 brings everything together through detailed case studies drawn from realistic performance analysis contexts. You will see complete analyses from initial research questions through data preparation, model building, diagnostic checking, and final interpretation. These case studies demonstrate how the techniques from earlier chapters integrate into coherent analytical workflows and how to make the many small decisions that arise in real analyses. The chapter also addresses model comparison, showing how to choose among competing models when multiple reasonable specifications exist.
To get the most from this book, consider the following approach:
- Work through chapters sequentially: Later chapters assume knowledge from earlier ones, and the progression is designed to build skills systematically
- Practice with your own data: Apply each technique to your own performance analysis questions as soon as you learn it, reinforcing concepts through hands-on experience
- Focus on interpretation: Technical execution matters, but the real skill lies in interpreting results correctly and communicating them effectively
- Use the case studies as templates: Chapter 8's detailed examples provide models for structuring your own analyses and reports
- Return to diagnostic chapters regularly: As you gain experience, you will appreciate the diagnostic procedures in Chapter 6 more deeply and apply them more rigorously
- Consult the glossary: When you encounter unfamiliar terms in later chapters, the glossary provides quick reference definitions
The book balances conceptual explanation with practical application throughout. Each major concept includes concrete examples showing how it applies in performance analysis contexts. Code examples are provided where appropriate, but the focus remains on understanding what techniques do and when to use them rather than on software-specific implementation details. This approach ensures the book remains useful regardless of which statistical software you use and emphasizes transferable analytical skills over mechanical procedures. Footnotes throughout provide references to primary sources and additional resources for readers who want to explore specific topics more deeply.
You will notice that the book emphasizes interpretation and communication as much as technical execution. This reflects the reality of performance analysis work: your value comes not from running statistical procedures but from generating insights that inform decisions. Every chapter includes guidance on communicating results to stakeholders, translating statistical findings into actionable recommendations, and avoiding common interpretation errors that undermine credibility. By the time you complete this book, you will be able not only to build rigorous logistic regression models but also to explain what they mean and why they matter to audiences with varying levels of statistical sophistication.
Core Assumptions and Prerequisites
Logistic regression, like all statistical techniques, rests on specific assumptions that must hold for results to be valid and interpretable. Understanding these assumptions is essential for two reasons: first, you need to verify assumptions are reasonably satisfied before trusting your results, and second, you need to recognize when violations occur so you can address them appropriately. Unlike some statistical methods where assumption violations produce obviously nonsensical results, logistic regression can produce seemingly reasonable output even when assumptions fail badly. This makes explicit knowledge of assumptions and systematic diagnostic checking critical components of competent practice.
The most fundamental assumption is that the outcome variable is truly binary or can be meaningfully treated as binary. Logistic regression models the probability that the outcome equals one versus zero, which requires that observations fall into one of two mutually exclusive categories. This seems straightforward but requires careful thought in practice. Consider an analyst studying program completion. If some participants are still enrolled and have neither completed nor withdrawn, treating them as non-completers violates the binary outcome assumption because their final status remains unknown. Similarly, if the outcome has more than two categories—such as low, medium, and high performance—collapsing it into a binary variable discards information and may obscure important patterns. When outcomes have more than two categories, multinomial or ordinal logistic regression may be more appropriate than binary logistic regression.
Logistic regression assumes observations are independent of one another. This means that knowing the outcome for one observation provides no information about the outcome for another observation beyond what the predictor variables already tell you. Independence violations are common in performance analysis data and can severely distort results. Consider these scenarios where independence fails:
- Clustered data: Students nested within schools, employees within departments, or patients within clinics share unmeasured characteristics that make their outcomes more similar than outcomes from different clusters
- Repeated measures: Multiple observations from the same individual over time are inherently dependent because they share individual-specific characteristics
- Matched designs: Pairs or groups of observations deliberately matched on characteristics are dependent by design
- Network effects: Outcomes for connected individuals—friends, coworkers, team members—may influence each other directly
The model assumes a linear relationship between predictors and the log-odds of the outcome. This is more subtle than it sounds. The assumption does not require a linear relationship between predictors and the probability of the outcome—in fact, that relationship is necessarily nonlinear due to the logistic transformation. Rather, it requires that the log-odds change linearly as predictors change. For continuous predictors, this means that each one-unit increase in the predictor produces the same change in log-odds regardless of the predictor's starting value. This assumption can fail when relationships are truly nonlinear—for example, when the effect of age on an outcome is U-shaped, or when the effect of a dose is logarithmic. Diagnostic procedures in Chapter 6 help detect linearity violations, and transformations or polynomial terms can address them when they occur.
Logistic regression assumes the absence of perfect multicollinearity among predictors, meaning no predictor can be perfectly predicted from a linear combination of other predictors. Perfect multicollinearity makes parameter estimation impossible because multiple parameter combinations produce identical model fit. More commonly, analysts encounter high but not perfect multicollinearity, where predictors are strongly correlated. High multicollinearity does not bias parameter estimates but inflates their standard errors, making it difficult to detect significant effects and producing unstable estimates that change dramatically with small data changes. For example, if you include both a raw test score and a standardized version of the same score as predictors, perfect multicollinearity prevents estimation. If you include highly correlated measures like job satisfaction and organizational commitment, high multicollinearity may make it impossible to determine which variable drives the outcome.
The model assumes that all relevant predictors are included and that the functional form is correctly specified. Omitting important predictors that correlate with included predictors produces omitted variable bias, where the effects of included predictors are distorted because they partially capture the effects of omitted variables. For instance, if you model employee turnover using only salary but omit job satisfaction, and satisfaction correlates with both salary and turnover, the estimated salary effect will be biased. Similarly, if you include predictors in the wrong functional form—treating a nonlinear relationship as linear, for example—the model misrepresents the true relationships. These assumptions are challenging because you can never be certain you have included all relevant variables or specified all relationships correctly. Theoretical knowledge of the phenomenon you are studying, careful variable selection, and diagnostic checking help address these concerns.
Regarding prerequisites, this book assumes you have foundational statistical knowledge equivalent to an undergraduate degree in psychology or a related social science. Specifically, you should be comfortable with:
- Descriptive statistics: Means, standard deviations, correlations, and basic data visualization
- Probability concepts: Understanding probability as a proportion, basic probability rules, and the distinction between probability and odds
- Hypothesis testing: Null and alternative hypotheses, p-values, Type I and Type II errors, and the logic of statistical significance
- Confidence intervals: What confidence intervals represent, how to interpret them, and their relationship to hypothesis tests
- Linear regression basics: The concept of modeling an outcome as a function of predictors, interpreting regression coefficients, and understanding residuals
You should also have access to statistical software capable of fitting logistic regression models. Common options include R, Python (with appropriate libraries), SPSS, Stata, and SAS. While the book does not focus on software-specific implementation, you will need software to practice the techniques on your own data. Most examples can be implemented in any standard statistical package, and the conceptual focus ensures the material remains relevant regardless of which software you use. If you are new to statistical programming, consider starting with software that provides both point-and-click interfaces and scripting capabilities, allowing you to transition gradually from menu-driven analysis to reproducible scripted workflows.
Finally, this book assumes you work with or aspire to work with real performance analysis data in applied settings. The examples, case studies, and communication guidance are designed for analysts who must translate statistical findings into actionable insights for stakeholders. If your interest is primarily theoretical or mathematical, you may find the emphasis on interpretation and communication less relevant, though the technical content remains rigorous. Conversely, if you are a practicing analyst who needs to apply logistic regression immediately, the practical focus and realistic examples will directly support your work. The book aims to serve as both a learning resource for developing new skills and a reference guide for analysts conducting logistic regression analyses in professional contexts.
This is the end of the free sample. The full book has 8 chapters.
Want this book written for you?
Tell us your goals and background, and get your own version of this book, tailored by AI to you.


Benefits of AI-tailored books
- Read one book, not ten:
- all the Statistics knowledge you need, gathered into a single book.
- Save days of learning:
- tell us your goals, choose your topics, and the whole book is built around them.
- Learn effortlessly:
- Statistics book written for your specific background and expertise.
- Understand at a glance:
- includes charts, tables, timelines, checklists, decision trees, and more.
- Stay current:
- written the day you order it, not years ago.
- Trust what you read:
- every book is checked for accuracy, with real research when your subject needs it.
Create your unique book in 3 steps
- 1. Select your focus
Select the focus of your Statistics book and share your background
- 2. Personalize your book
Specify your goals and choose sub-topics to include
- 3. Get your tailored book
Your book is ready in 10 minutes. Read it online, download as EPUB or PDF, or send to Kindle.

Frequently asked questions
- What is TailoredRead?
TailoredRead creates complete, full-length nonfiction ebooks, written specifically for you. Tell us what you want to learn and why, and TailoredRead writes you a complete ebook on it, with charts, tables, and diagrams throughout. Read it online, on Kindle, or on any e-reader, or download it as a PDF or EPUB. Every book is written fresh the day you order it.
- How is the book tailored to me?
Before anything is written, you answer a few short questions about your goals, your background, and the topics you care about. Your book is then planned around your answers: written at your level, focused on your goals, and covering the topics you chose, instead of the one-size-fits-all book a store sells everyone.
- Will it read like generic AI content?
No. Your book isn't a chat transcript: it's planned chapter by chapter before a single word is written, told in a clear book voice, and explains ideas visually with charts, tables, and diagrams. After writing, every book goes through an editorial pass that polishes chapters so the book reads consistent from start to finish. Judge for yourself: browse thousands of sample books on our Explore Books page.
- How accurate is the content?
Our AI first checks whether your subject needs live research. Niche and fast-moving subjects are researched before writing, and the book plan and chapters are grounded in what it finds. After writing, every book goes through a quality pass that checks its facts and consistency, and researched books list their sources in a Notes section at the back.
- How long is the book?
You choose the length: Comprehensive (250-300 pages), Detailed (150-200 pages), Essential (70-100 pages), or Short (30-50 pages).
- Does the book include visuals?
Yes. Every book includes charts, tables, and diagrams: timelines, checklists, step-by-step guides, decision trees, comparison tables, matrices, and bar charts. A typical book includes dozens of these visual elements.
- Can I read it on Kindle? What formats can I download?
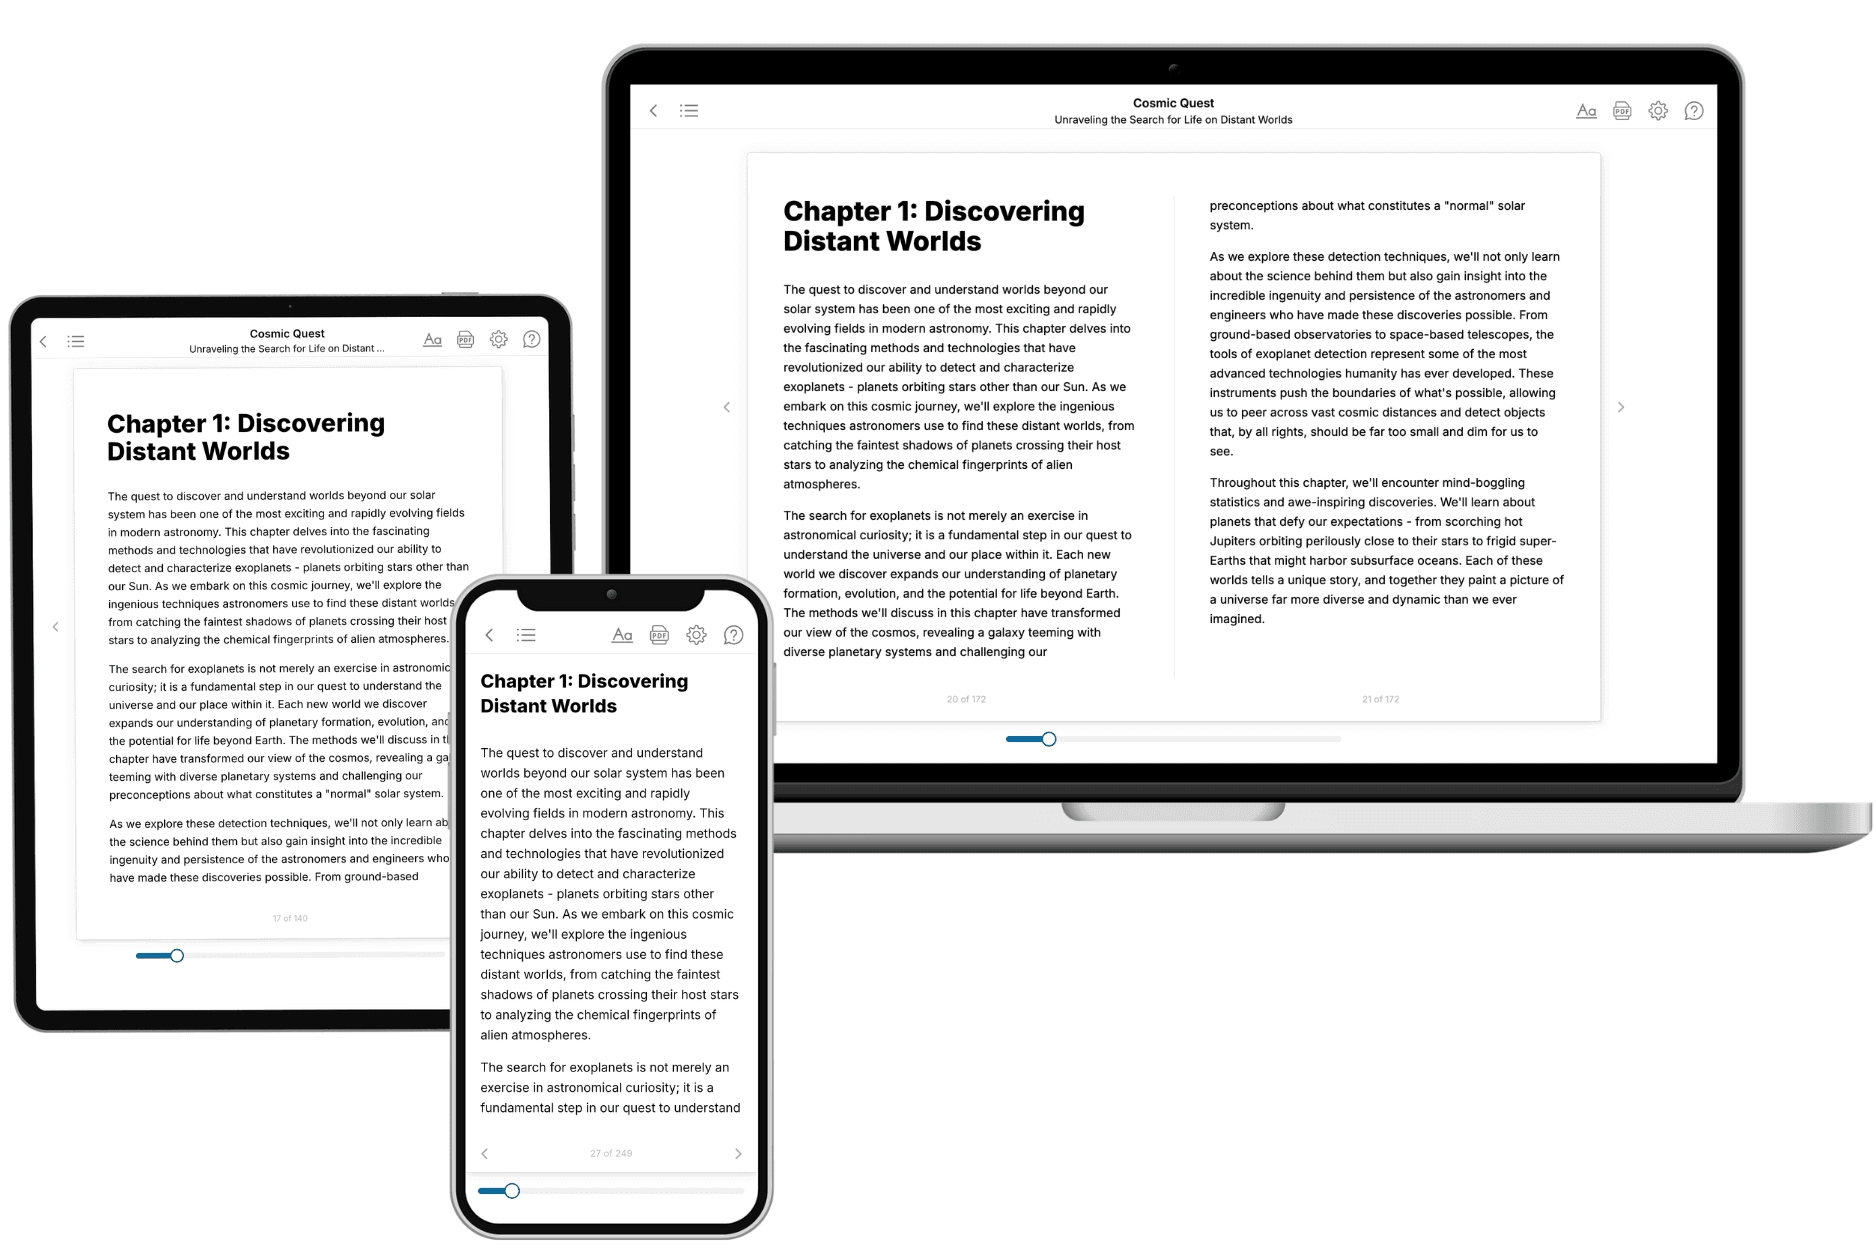
Yes. Every book can be read in our online reader or downloaded as a PDF or EPUB. The EPUB can be opened with Kindle, Apple Books, Kobo, and any e-reader. The Commercial and Author licenses also include an editable Word (DOCX) and Markdown download.
- How much does it cost?
About the price of a regular ebook. The exact price depends on your book's length and complexity, from $2 for the shortest books to $35 for the most comprehensive, and it's shown when you review your book, before you commit to anything. Each book is a one-time purchase, yours to keep, no subscription. Licenses that let you share, teach, or publish your book range from $35.99 to $49.99.
- Can I preview the book before purchasing?
Before you pay, you'll see what your book will cover: the title, a detailed description, the estimated length, and the complete chapter-by-chapter table of contents, so you know what you're getting before you decide. The full text itself is written after you purchase.
- How long does it take to create a book?
About 10 minutes. You can start reading the opening chapters while the rest is still being written.