Mapping Reality
Understanding Cartographic Projections and How Maps Shape Our World
Have you ever noticed that Greenland looks enormous on most world maps, yet it's actually smaller than Australia?
207 pages9 chaptersNov 27, 2025Cartography
About this book
This visual paradox reveals a fundamental truth: every map lies. The question isn't whether maps distort reality—they must—but rather how, why, and what we lose in the process. Cartographic projections are the mathematical solutions cartographers use to flatten Earth's curved surface onto paper or screens, and each choice involves deliberate trade-offs. This book demystifies the science and art behind map-making, exploring how projections work, why different maps serve different purposes, and how understanding these choices transforms the way you read and interpret spatial information. From the Mercator projection that shaped colonial empires to cutting-edge digital mapping technologies, you'll discover how the maps we use daily influence our understanding of geography, politics, and our place in the world. Whether you're a student, professional, or curious explorer, this guide equips you with the knowledge to evaluate maps critically and appreciate the elegant mathematics that makes global representation possible.
Table of contents
- IntroductionWhy Maps Matter More Than You Think, The Projection Problem: Why Flat Maps Can't Tell the Whole Truth, What You'll Learn in This BookRead below
- Chapter 1: The Geometry of EarthUnderstanding Earth's True Shape, How We Measure and Model Our Planet, Latitude, Longitude, and Coordinate Systems
- Chapter 2: The Fundamental ChallengeThe Impossible Task: Flattening a Sphere, Four Types of Distortion and What They Mean, Understanding the Trade-Offs
- Chapter 3: Conformal ProjectionsPreserving Angles: How Conformal Projections Work, The Mercator Projection and Its Legacy, Other Conformal Projections and Their Uses
- Chapter 4: Equal-Area ProjectionsPreserving Area: The Equal-Area Approach, Mollweide, Sinusoidal, and Other Equal-Area Methods, When Equal-Area Projections Matter Most
- Chapter 5: Equidistant and Azimuthal ProjectionsPreserving Distance: Equidistant Projections, Azimuthal Projections and Directional Accuracy, Practical Applications in Navigation and Planning
- Chapter 6: Compromise ProjectionsBalancing Multiple Distortions, The Robinson Projection: A Balanced Approach, Other Compromise Projections and Their Strengths
- Chapter 7: Projection Selection and ApplicationChoosing the Right Projection for Your Purpose, Regional Projections and Local Accuracy, Projections in Real-World Applications
- Chapter 8: The History and Politics of ProjectionsHow Projections Evolved Through History, Cultural and Political Bias in Map-Making, How Projections Shape Worldviews and Influence Policy
- Chapter 9: Digital Mapping and Modern ProjectionsWeb Mercator and the Age of Digital Maps, Dynamic and Interactive Projections, The Future of Cartographic Representation
- ConclusionKey Takeaways: Becoming a Projection-Literate Map Reader, Next Steps in Your Cartographic Journey
- Glossary
- Further Reading and Resources
Introduction
Every day, you encounter maps. You check your phone for directions, glance at weather patterns moving across a continent, or scroll through news articles showing global events plotted on colorful graphics. These maps feel authoritative and objective, presenting geographic information as simple fact. Yet every single one of them contains deliberate distortions—mathematical compromises that fundamentally alter how you perceive distances, sizes, and relationships between places. The map on your screen isn't reality; it's one of countless possible interpretations of reality, each emphasizing different truths while obscuring others.
Understanding cartographic projections transforms how you read the world. When you recognize that Greenland appears larger than Africa on most wall maps despite being roughly fourteen times smaller in reality, you begin to question what other geographic misconceptions shape your thinking. When you learn why airline routes appear curved on flat maps but represent the shortest path between cities, navigation suddenly makes intuitive sense. When you discover that the projection dominating digital mapping was chosen for computational efficiency rather than geographic accuracy, you gain insight into how technology shapes perception. This knowledge isn't merely academic—it's practical literacy for interpreting the spatial information that increasingly governs decision-making in fields from urban planning to climate science.
This book bridges the gap between casual map users and cartographic professionals. You already understand basic geography—you know continents, recognize coordinate systems, and grasp that Earth is roughly spherical. Now you're ready to explore the mathematical and conceptual frameworks that determine how three-dimensional reality becomes two-dimensional representation. You'll discover why certain projections dominated different historical periods, how to evaluate which projection serves specific analytical purposes, and what questions to ask when encountering unfamiliar maps. By the end, you won't just consume maps passively; you'll read them critically, understanding both their power and their limitations.
Why Maps Matter More Than You Think
Maps are cognitive tools that structure how you think about space, distance, and relationships between places. Unlike photographs or satellite images that capture specific moments from particular vantage points, maps are abstractions—deliberate simplifications that highlight certain features while suppressing others. A road map emphasizes transportation networks while ignoring topography. A climate map shows temperature zones but omits political boundaries. A population density map reveals human settlement patterns while hiding the natural landscape beneath. Each map answers specific questions, and understanding what questions a map was designed to answer helps you recognize what it might misrepresent or omit entirely.
The influence of maps extends far beyond navigation. Urban planners use maps to decide where to build infrastructure, potentially determining which neighborhoods receive investment and which face neglect. Environmental scientists rely on maps to track deforestation, ocean acidification, and species migration patterns, with projection choices affecting how they calculate areas and measure change over time. Political analysts use electoral maps that can make narrow victories appear overwhelming or close races seem decided, shaping public perception of democratic legitimacy. International organizations use world maps to allocate resources, and the projection they choose literally determines which regions appear central and which seem peripheral[1]. These aren't neutral technical decisions—they're choices with real consequences.
Consider how maps shape your mental geography. If you grew up seeing Mercator projection world maps in classrooms, you likely internalized a distorted sense of relative country sizes. You might imagine Europe as roughly equivalent in size to South America, when South America is actually nearly twice as large. You might think of Alaska as enormous and Brazil as modest, when Brazil is five times larger. These misperceptions aren't your fault—they're artifacts of a projection system designed in 1569 for maritime navigation, not geographic education. Yet they persist because maps create powerful mental models that resist correction even when you intellectually know they're wrong. Recognizing this phenomenon helps you approach all maps with appropriate skepticism.
Maps also encode cultural and political perspectives. The choice to center a world map on the Prime Meridian running through Greenwich, England, reflects historical British naval dominance, not geographic necessity. Maps could just as easily center on the Pacific Ocean, Tokyo, or any other longitude. The convention of placing north at the top is similarly arbitrary—early Islamic maps often oriented south upward, while medieval European maps placed east at the top (hence "orientation" from "orient," meaning east). These choices seem natural only because they're familiar. When you encounter maps with unfamiliar orientations or centers, the initial disorientation reveals how deeply conventional cartographic choices shape your spatial intuitions.
The digital revolution has made map creation and consumption ubiquitous, but it hasn't eliminated the fundamental challenges of projection. Every time you use a mapping application on your phone, algorithms are making projection decisions on your behalf. When you zoom from a city view to a continental view, the software switches between different projections optimized for different scales. When you measure distances or calculate areas using digital tools, the underlying projection determines whether those measurements are accurate. Understanding these hidden processes helps you use digital mapping tools more effectively and interpret their outputs more critically. The technology may be new, but the mathematical constraints remain unchanged.
Maps matter because they're interfaces between complex geographic reality and human cognition. Your brain can't directly comprehend a three-dimensional, rotating sphere with irregular surfaces and constantly changing features. You need simplified representations that reduce complexity to manageable patterns. Maps provide these representations, but the simplification process inevitably involves choices about what to preserve and what to sacrifice. Becoming literate in these choices doesn't diminish the utility of maps—it enhances it. You learn to select appropriate maps for specific purposes, to recognize when a map's distortions might mislead, and to appreciate the elegant mathematical solutions that make cartography possible. This literacy is increasingly essential in a world where spatial data informs decisions at every scale, from personal navigation to global policy.
The stakes of cartographic literacy extend to how you understand global challenges. Climate change maps showing temperature increases, sea level rise, or shifting agricultural zones all depend on projection choices that affect how you perceive the magnitude and distribution of impacts. Maps of refugee movements, disease spread, or economic inequality shape public discourse and policy responses. When these maps use projections that distort areas or distances, they can inadvertently misrepresent the phenomena they're trying to illustrate. A map showing migration routes might make journeys appear shorter or longer than they actually are, affecting how you understand the challenges migrants face. A map of deforestation might understate or overstate the area affected depending on the projection used. Learning to recognize these potential distortions helps you engage more thoughtfully with the spatial dimensions of complex issues.
The Projection Problem: Why Flat Maps Can't Tell the Whole Truth
The fundamental challenge of cartography is mathematically insurmountable: you cannot flatten a sphere onto a plane without distortion. This isn't a limitation of current technology or a problem waiting for a clever solution—it's a geometric impossibility proven by Carl Friedrich Gauss in his Theorema Egregium (Remarkable Theorem) in 1827. The theorem demonstrates that a curved surface and a flat surface have fundamentally different intrinsic geometries, and no transformation can preserve all geometric properties when converting between them[2]. Every flat map must sacrifice something—the only question is what to sacrifice and how much.
To understand why this matters, imagine trying to flatten an orange peel. If you carefully remove the peel in one piece and try to press it flat, you'll find it tears or wrinkles. The peel's curved surface simply won't lie flat without distortion. You could cut the peel into segments and arrange them on a table, leaving gaps between pieces, but then you'd lose continuity. You could stretch some parts and compress others, but then the peel's shape would change. Cartographers face this same challenge with Earth's surface, except they need continuous coverage without gaps or tears. The mathematical techniques they've developed over centuries are essentially sophisticated methods for deciding where and how to introduce distortion in ways that serve specific purposes.
Four fundamental properties can potentially be preserved in a map, but no single projection can maintain all four simultaneously:
- Shape (conformality): Preserving local angles and the shapes of small features, crucial for navigation and detailed regional mapping
- Area (equivalence): Maintaining accurate relative sizes, essential for comparing regions or analyzing spatial distributions
- Distance (equidistance): Keeping accurate distances from one or more points, important for measuring travel or calculating ranges
- Direction (azimuthality): Preserving accurate compass bearings from a central point, valuable for navigation and orientation
The distortion introduced by projections isn't uniform across a map. Most projections have a standard line or standard point where distortion is minimal or zero, with distortion increasing as you move away from this reference. A map centered on the equator might show tropical regions with high accuracy while severely distorting polar areas. A map centered on the North Pole might accurately represent Arctic regions while distorting the Southern Hemisphere beyond recognition. This means that the same projection can be excellent for mapping one region and terrible for mapping another. There's no universal "best" projection—only projections better or worse suited for specific geographic areas and analytical purposes.
Consider a practical example: measuring the area of the Amazon rainforest. If you use a Mercator projection (which preserves shapes but distorts areas, especially near the poles), your area calculation will be inaccurate because the projection doesn't preserve area relationships. If you use an equal-area projection like the Mollweide or Albers, your area calculation will be accurate, but the rainforest's shape might appear distorted compared to how it looks on a globe. For this specific task—measuring area—you'd choose the equal-area projection despite its shape distortion, because area accuracy is what matters for your purpose. This exemplifies the fundamental principle of projection selection: match the projection's preserved properties to your analytical needs.
The projection problem becomes even more complex when mapping large areas or the entire globe. Local maps of small regions (a city, a county, even a small country) can use projections with minimal distortion because the curvature of Earth is negligible over short distances. A map of Manhattan can be nearly distortion-free because the island is small enough that Earth's curvature barely affects it. But as the mapped area increases, curvature becomes impossible to ignore. A map of the United States must account for significant curvature, and a world map must grapple with representing an entire sphere on a flat surface. This is why you'll encounter different projections at different scales—what works for a city map fails for a continental map, and what works for a continental map fails for a global map.
Understanding the projection problem helps you recognize that all maps are models, not reality. Just as a subway map simplifies complex transit networks into schematic diagrams that sacrifice geographic accuracy for clarity, cartographic projections simplify Earth's geometry in ways that serve specific purposes. The subway map isn't "wrong" for showing straight lines and regular spacing instead of actual routes and distances—it's optimized for a different purpose than geographic accuracy. Similarly, a Mercator projection isn't "wrong" for exaggerating polar regions—it's optimized for navigation, not area comparison. The error lies not in the projections themselves but in using them for purposes they weren't designed to serve or in failing to recognize their limitations.
What You'll Learn in This Book
This book provides a structured journey through the world of cartographic projections, building from fundamental concepts to practical applications. You'll start by examining Earth's actual shape and the coordinate systems we use to describe locations on its surface. Understanding Earth's geometry—not as a perfect sphere but as an oblate spheroid with irregular features—provides the foundation for appreciating why projection is necessary and why it's challenging. You'll learn how geodesists measure and model our planet, creating reference ellipsoids that approximate Earth's shape with mathematical precision. This groundwork makes the subsequent exploration of projection methods concrete rather than abstract.
The early chapters establish the theoretical framework you need to evaluate any projection. You'll explore the four types of distortion in depth, learning to recognize them visually and understand their mathematical basis. You'll discover Tissot's indicatrix, a powerful tool that visualizes distortion patterns across a map by showing how circles on Earth's surface transform into ellipses on projected maps. You'll examine why certain trade-offs are inevitable and how cartographers have approached these trade-offs differently across history and cultures. This theoretical foundation isn't merely academic—it's the lens through which you'll evaluate every map you encounter afterward, enabling you to quickly assess what a projection preserves and what it distorts.
The middle chapters systematically examine major projection families, organized by the properties they preserve:
- Conformal projections that maintain shapes and angles, including the famous Mercator and its variants, with detailed exploration of why these projections dominated maritime navigation and how they continue to influence digital mapping
- Equal-area projections that preserve relative sizes, essential for thematic mapping and spatial analysis, with examples ranging from the Mollweide to the Albers conic projection
- Equidistant and azimuthal projections that maintain accurate distances or directions from specific points, crucial for navigation, telecommunications, and understanding spatial relationships
- Compromise projections that balance multiple distortions without perfectly preserving any single property, offering aesthetically pleasing and functionally versatile solutions for general-purpose mapping
You'll learn practical projection selection skills through real-world scenarios. When should you use a Lambert conformal conic projection versus a transverse Mercator? How do you choose an appropriate projection for mapping climate data across Africa? What projection works best for showing airline routes across the Pacific? These aren't hypothetical questions—they're decisions that cartographers, GIS analysts, and data visualization specialists make regularly. You'll develop a decision-making framework based on three key questions: What geographic area am I mapping? What properties must be accurate for my purpose? What distortions can I accept? This framework transforms projection selection from mysterious art to systematic process.
The book also explores the historical and political dimensions of cartography. You'll discover how the Mercator projection became ubiquitous despite its area distortions, and how this ubiquity shaped Western perceptions of global geography. You'll examine the Peters projection controversy of the 1970s, when debates about equal-area world maps became proxy battles over Eurocentrism and colonial legacies. You'll learn how different cultures developed different cartographic traditions, from Chinese maps that centered the Middle Kingdom to Islamic maps that oriented toward Mecca. These historical perspectives reveal that projection choices are never purely technical—they reflect and reinforce cultural values, political priorities, and worldviews. Understanding this context helps you recognize bias in contemporary mapping and make more conscious choices in your own cartographic work.
The final chapters address modern developments in digital cartography. You'll explore Web Mercator, the projection that powers most online mapping services, understanding both its technical advantages and its limitations for spatial analysis. You'll discover how dynamic projections can adapt to user interactions, changing as you zoom or pan to optimize accuracy for the currently visible area. You'll examine emerging technologies like adaptive projections that use machine learning to minimize distortion for specific datasets, and immersive cartography that uses virtual reality to present geographic information in three-dimensional environments. These innovations don't eliminate the fundamental projection problem, but they offer new approaches to managing it, making maps more flexible and context-aware than ever before.
Throughout the book, you'll encounter practical tools and resources. You'll learn to use online projection visualization tools that let you compare how different projections represent the same geographic data. You'll discover how to identify projections from their visual characteristics—the distinctive shapes of continents, the patterns of graticules (latitude and longitude lines), and the distribution of distortion. You'll gain familiarity with projection notation systems like EPSG codes that standardize projection definitions for GIS software. You'll explore resources for continued learning, from interactive websites that demonstrate projection properties to academic papers that delve into advanced mathematical details. These tools transform abstract concepts into tangible skills you can apply immediately.
By the conclusion, you'll possess a comprehensive understanding of cartographic projections that serves multiple purposes. If you work with geographic data professionally, you'll be able to select appropriate projections for analysis, recognize when projection-related errors might affect your results, and communicate projection choices clearly to stakeholders. If you're a student, you'll have the foundation to pursue advanced cartographic studies or apply projection knowledge in fields from environmental science to urban planning. If you're simply a curious map enthusiast, you'll never look at maps the same way again—you'll see the mathematical elegance behind their construction, recognize their limitations, and appreciate the centuries of innovation that make modern cartography possible. Most importantly, you'll understand that every map tells a story not just about the places it represents, but about the choices its creator made in representing them.
This is the end of the free sample. The full book has 9 chapters.
Want this book written for you?
Tell us your goals and background, and get your own version of this book, tailored by AI to you.


Benefits of AI-tailored books
- Read one book, not ten:
- all the Cartography knowledge you need, gathered into a single book.
- Save days of learning:
- tell us your goals, choose your topics, and the whole book is built around them.
- Learn effortlessly:
- Cartography book written for your specific background and expertise.
- Understand at a glance:
- includes charts, tables, timelines, checklists, decision trees, and more.
- Stay current:
- written the day you order it, not years ago.
- Trust what you read:
- every book is checked for accuracy, with real research when your subject needs it.
Create your unique book in 3 steps
- 1. Select your focus
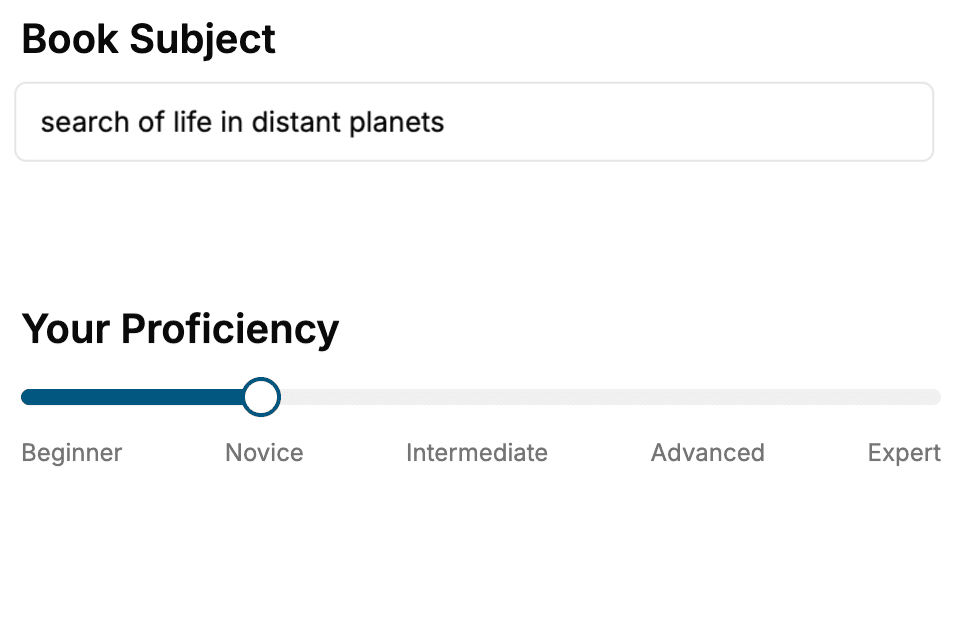
Select the focus of your Cartography book and share your background
- 2. Personalize your book
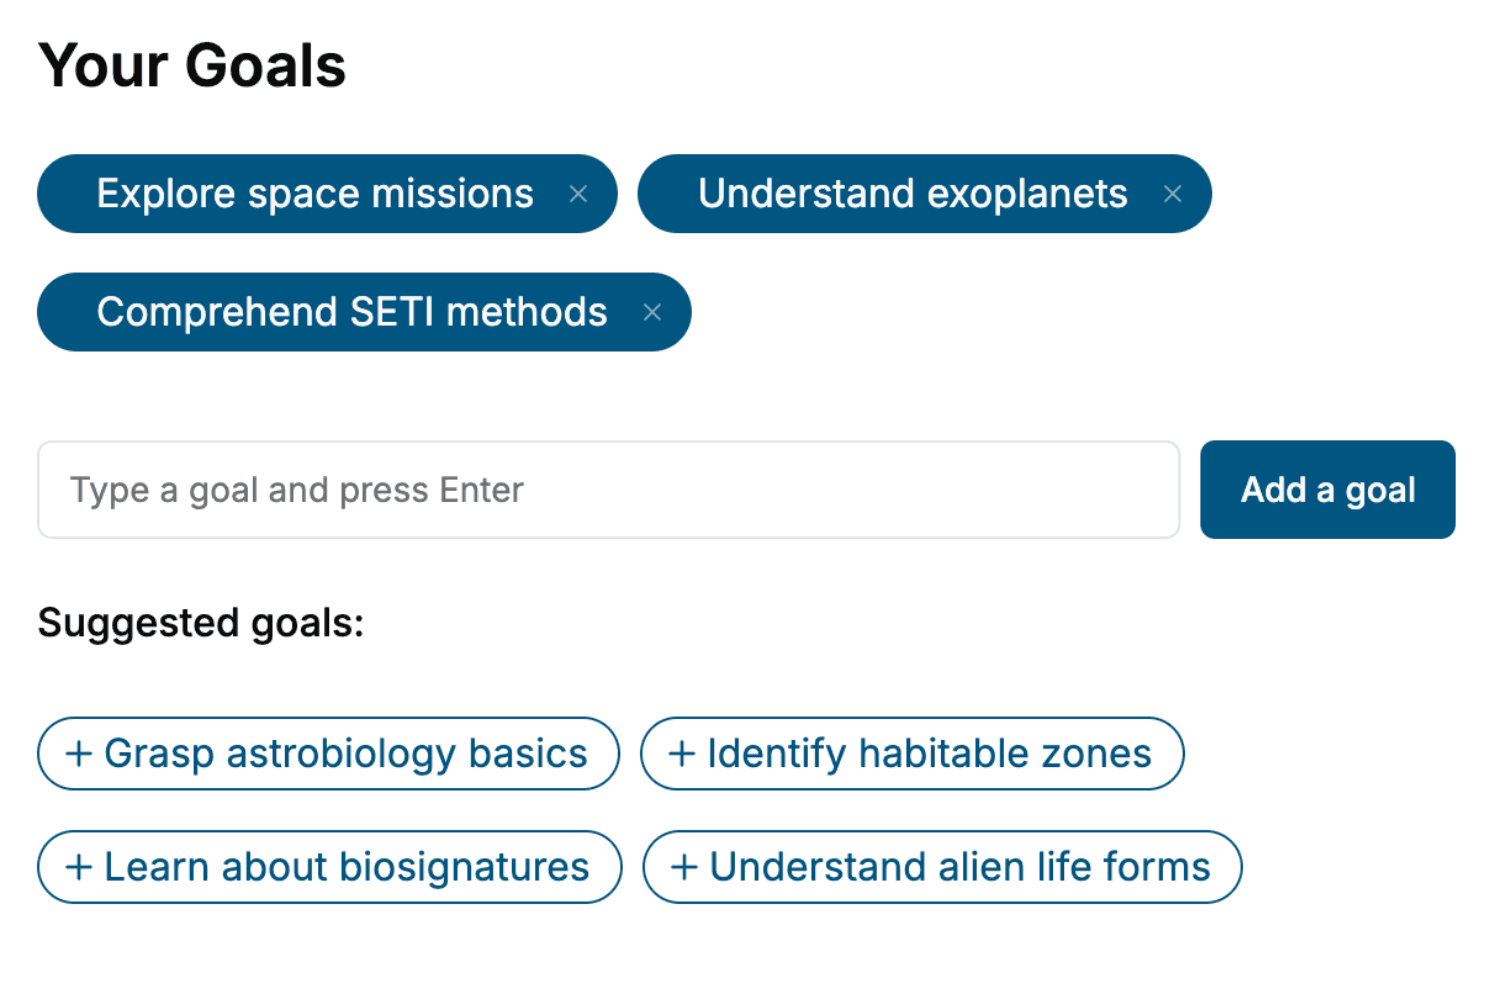
Specify your goals and choose sub-topics to include
- 3. Get your tailored book
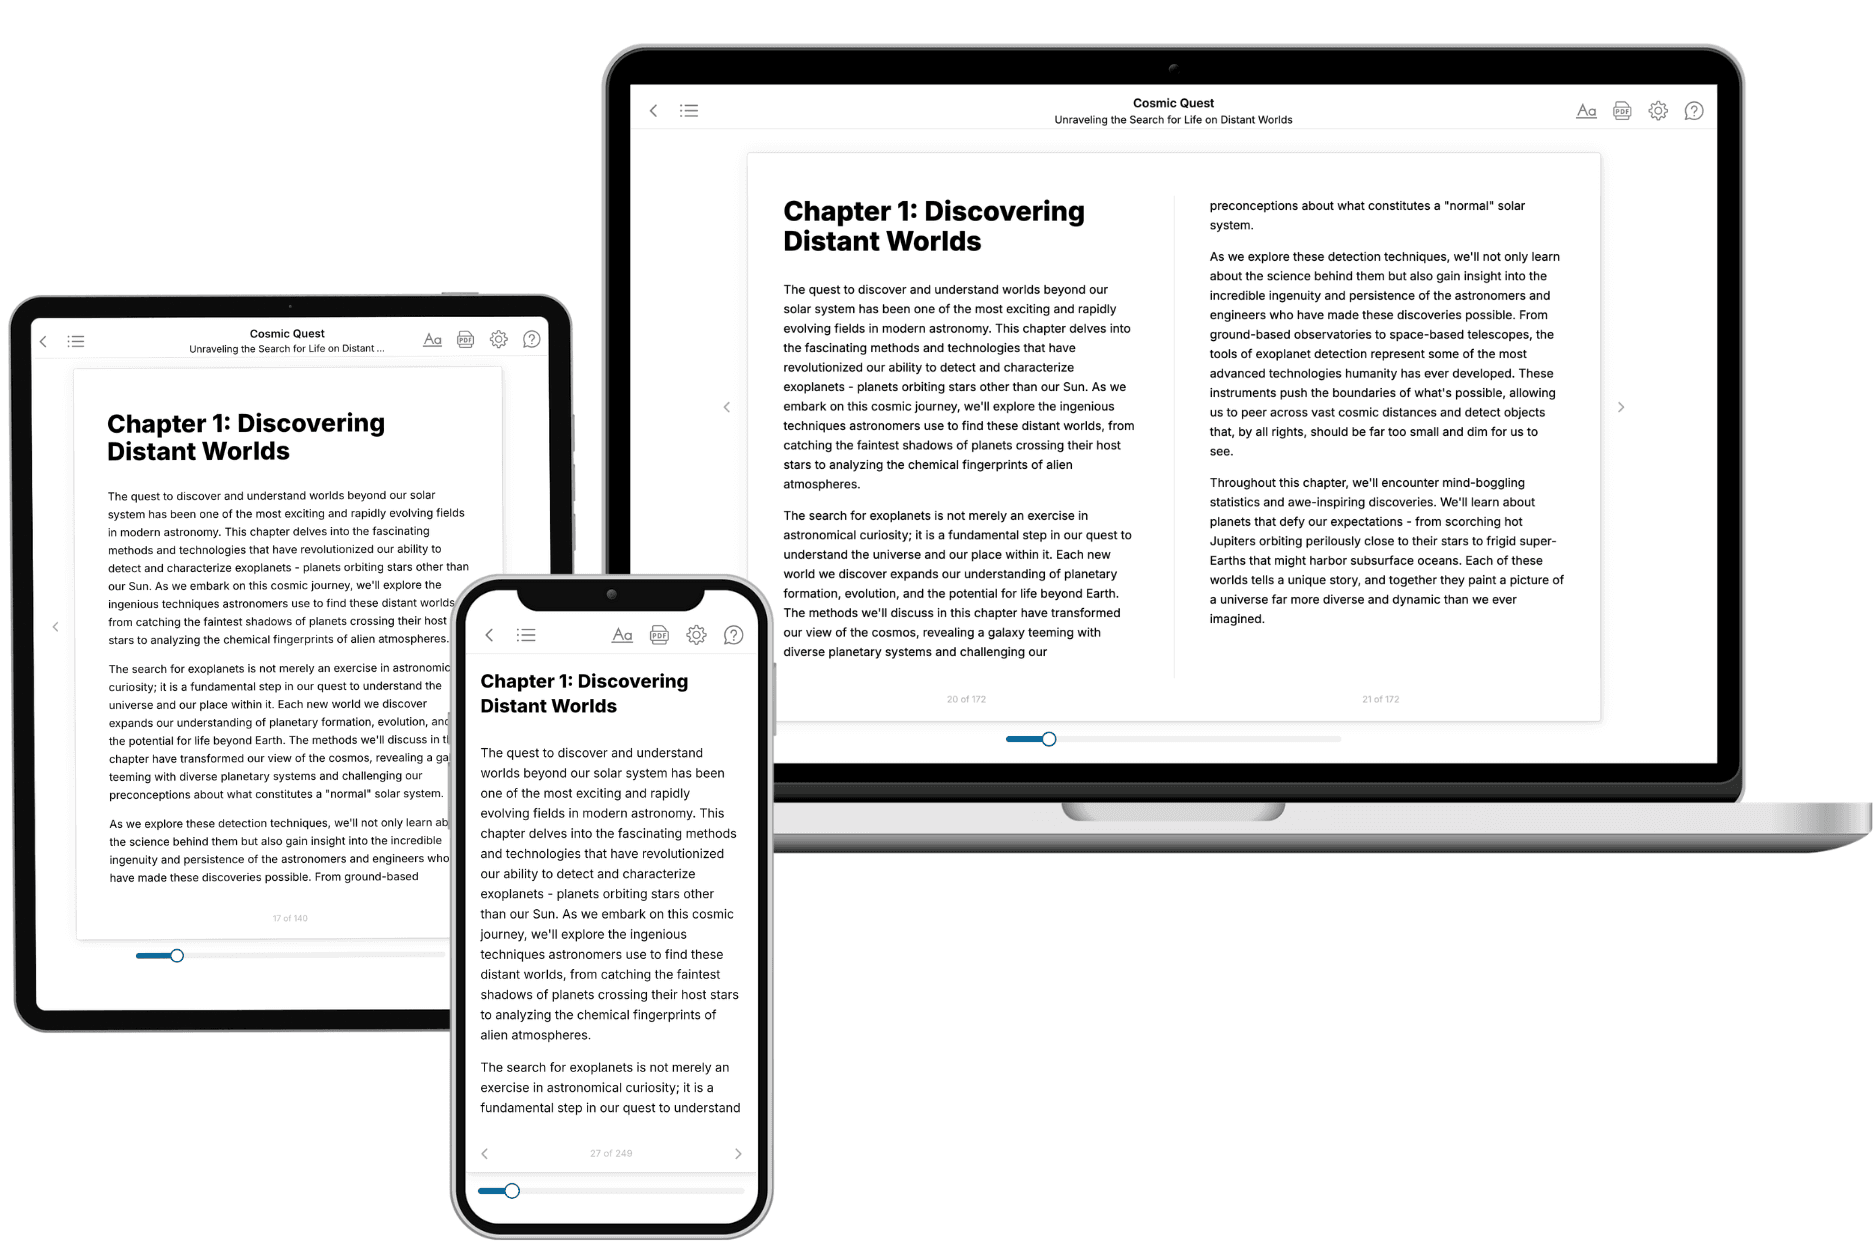
Your book is ready in 10 minutes. Read it online, download as EPUB or PDF, or send to Kindle.
Frequently asked questions
- What is TailoredRead?
TailoredRead creates complete, full-length nonfiction ebooks, written specifically for you. Tell us what you want to learn and why, and TailoredRead writes you a complete ebook on it, with charts, tables, and diagrams throughout. Read it online, on Kindle, or on any e-reader, or download it as a PDF or EPUB. Every book is written fresh the day you order it.
- How is the book tailored to me?
Before anything is written, you answer a few short questions about your goals, your background, and the topics you care about. Your book is then planned around your answers: written at your level, focused on your goals, and covering the topics you chose, instead of the one-size-fits-all book a store sells everyone.
- Will it read like generic AI content?
No. Your book isn't a chat transcript: it's planned chapter by chapter before a single word is written, told in a clear book voice, and explains ideas visually with charts, tables, and diagrams. After writing, every book goes through an editorial pass that polishes chapters so the book reads consistent from start to finish. Judge for yourself: browse thousands of sample books on our Explore Books page.
- How accurate is the content?
Our AI first checks whether your subject needs live research. Niche and fast-moving subjects are researched before writing, and the book plan and chapters are grounded in what it finds. After writing, every book goes through a quality pass that checks its facts and consistency, and researched books list their sources in a Notes section at the back.
- How long is the book?
You choose the length: Comprehensive (250-300 pages), Detailed (150-200 pages), Essential (70-100 pages), or Short (30-50 pages).
- Does the book include visuals?
Yes. Every book includes charts, tables, and diagrams: timelines, checklists, step-by-step guides, decision trees, comparison tables, matrices, and bar charts. A typical book includes dozens of these visual elements.
- Can I read it on Kindle? What formats can I download?
Yes. Every book can be read in our online reader or downloaded as a PDF or EPUB. The EPUB can be opened with Kindle, Apple Books, Kobo, and any e-reader. The Commercial and Author licenses also include an editable Word (DOCX) and Markdown download.
- How much does it cost?
About the price of a regular ebook. The exact price depends on your book's length and complexity, from $2 for the shortest books to $35 for the most comprehensive, and it's shown when you review your book, before you commit to anything. Each book is a one-time purchase, yours to keep, no subscription. Licenses that let you share, teach, or publish your book range from $35.99 to $49.99.
- Can I preview the book before purchasing?
Before you pay, you'll see what your book will cover: the title, a detailed description, the estimated length, and the complete chapter-by-chapter table of contents, so you know what you're getting before you decide. The full text itself is written after you purchase.
- How long does it take to create a book?
About 10 minutes. You can start reading the opening chapters while the rest is still being written.