Mastering Grafana Variables
Dynamic Dashboards and Flexible Monitoring for DevOps Teams
Take your Grafana dashboards from static to dynamic.
207 pages10 chaptersAug 22, 2026Grafana
About this book
You'll learn how to leverage variables to create flexible, reusable dashboards that adapt to your infrastructure without manual reconfiguration. This guide walks you through everything from basic text variables to advanced query-based filtering, multi-select options, and chained variables that create intelligent cascading filters. Discover how to combine variables with annotations, alerts, and conditional logic to build comprehensive monitoring solutions. You'll master regex patterns, value mapping, and variable scoping to ensure your dashboards remain clean and maintainable as they scale. Whether you're managing multiple environments, teams, or complex infrastructure, this book provides practical techniques and real-world examples that transform how you approach dashboard design. Stop duplicating dashboards—start building once and monitoring everywhere.
Table of contents
- IntroductionWhy Variables Matter in Modern Monitoring, What You'll Learn in This Book, How to Use This GuideRead below
- Chapter 1: Variable FundamentalsWhat Are Variables and Why Use Them, Overview of Variable Types, Anatomy of a Variable: Key Components, Dashboard-Level vs Global Variables
- Chapter 2: Text and Constant VariablesCreating and Using Text Variables, Constant Variables for Fixed Values, Common Text Variable Patterns
- Chapter 3: Query Variables and Data Source IntegrationBuilding Query Variables from Data Sources, Query Variables with Prometheus, Query Variables with Other Data Sources, Optimizing Query Variable Performance
- Chapter 4: Multi-Select and Chained VariablesEnabling Multi-Select Options, Creating Chained Variables for Cascading Filters, Advanced Multi-Select Patterns
- Chapter 5: Regex, Formatting, and Value MappingUsing Regex to Transform Variable Values, Value Mapping for User-Friendly Options, Formatting and Display Options, Practical Transformation Examples
- Chapter 6: Variables in Queries and ExpressionsVariable Interpolation in Panel Queries, Variable Syntax and Escaping, Building Conditional Queries with Variables, Using Variables in Expressions and Calculations
- Chapter 7: Advanced Variable TechniquesConditional Panel Visibility Based on Variables, Dynamic Thresholds and Alert Rules, Managing Variable Dependencies and Refresh Behavior, Advanced Variable Patterns and Use Cases
- Chapter 8: Variables with Annotations and AlertsUsing Variables in Annotations, Variables in Alert Rules and Notifications, Building Dynamic Monitoring Solutions
- Chapter 9: Dashboard Design and Best PracticesOrganizing Variables for Clarity, Designing for User Experience, Naming Conventions and Documentation, Scalability Patterns for Large Deployments
- Chapter 10: Testing, Troubleshooting, and OptimizationTesting Variables Across Data Sources, Common Variable Issues and Solutions, Debugging Variable Behavior, Performance Optimization Strategies
- ConclusionKey Takeaways, Next Steps in Your Grafana Journey
- Appendix: Quick ReferenceVariable Types Quick Reference, Common Regex Patterns, Troubleshooting Checklist
Introduction
Picture a monitoring team running fourteen separate dashboards for the same application stack, one per environment and region combination. Every time someone adds a new service, an engineer opens all fourteen files, copies a panel, edits the data source label, and republishes. Six months later, three of those dashboards show stale metrics because a naming change never made it to every copy. This is not a hypothetical edge case. It is the default outcome for teams that build dashboards without a plan for handling change, and it is exactly the problem that Grafana variables were designed to solve.
A single dashboard built around variables can replace that entire fleet of fourteen. Instead of hardcoding us-east-1 into a query, the dashboard asks a variable named region what value to use, and that value comes from a dropdown at the top of the screen. Change the selection, and every panel, every query, every threshold tied to that variable updates instantly. The dashboard becomes a template rather than a snapshot, something that adapts to whatever data exists at the moment someone looks at it. That shift, from static artifact to living template, is the central idea this book builds on from the first page to the last.
None of this is new territory invented for this book. Grafana's variable system has existed since early versions of the platform and has grown alongside the templating engine that powers it[1]. What has changed is how central variables have become to serious production dashboards. As infrastructure has grown more dynamic, with containers spinning up and down and services multiplying across clusters, the old approach of manually building a dashboard per target has become impossible to sustain. Variables are the mechanism that lets a dashboard keep pace with infrastructure that no longer holds still.
This introduction sets the stage for everything that follows. It explains why variables deserve serious study rather than a quick glance at the dropdown menu, lays out the path this book takes from basic concepts to advanced patterns, and offers concrete advice on how to get the most value out of the chapters ahead. None of the three sections require a Grafana instance open in front of you, though having one nearby will make the examples easier to follow. Read this section first, even if the instinct is to jump straight to query variables or regex patterns. The reasoning here explains why later chapters are ordered the way they are.
Why Variables Matter in Modern Monitoring
Infrastructure used to be relatively fixed. A company might run a handful of physical servers with names like web-01 and db-02, and a dashboard built for that environment could stay accurate for years. That world has largely disappeared. Modern infrastructure runs on orchestration platforms that create and destroy resources constantly, autoscaling groups that change size hourly, and multi-region deployments that multiply every metric by the number of regions in play. A dashboard hardcoded against yesterday's infrastructure is a dashboard describing a system that may no longer exist by the time someone views it.
Variables solve this by decoupling the dashboard's structure from any specific set of values. Rather than a query that reads node_cpu_seconds_total{instance="10.0.1.42:9100"}, a variable-driven query reads node_cpu_seconds_total{instance="$instance"}, where $instance resolves at render time to whatever the user selects, or to a live list pulled from the data source. The dashboard no longer needs to be rebuilt when instances change. It simply reflects whatever instances currently exist, because the list populating the dropdown is generated from the same data source the panels query.
Consider a concrete before-and-after. A team running Kubernetes across three namespaces (staging, qa, and production) might start with three nearly identical dashboards, one per namespace, each maintained separately.
- Adding a new panel means editing all three dashboards.
- Fixing a typo in a query means finding and correcting it three times.
- Onboarding a fourth namespace means duplicating an entire dashboard from scratch.
namespace variable, and all three problems disappear at once. A fourth namespace appears automatically in the dropdown the moment it exists in the cluster, with zero dashboard edits required.
This consolidation has a direct financial and operational cost benefit that is easy to underestimate. Every duplicated dashboard is a maintenance liability: a place where configuration drift can quietly introduce inconsistency, where one copy gets an alert threshold updated and another does not, where a departing team member's tribal knowledge about which of the fourteen dashboards is the current one walks out the door with them. Teams that consolidate around variable-driven dashboards typically report not just less duplicated work but fewer incidents caused by someone looking at a stale or wrong dashboard during an outage, when accuracy matters most.
Variables also change who can safely use a dashboard. A dashboard hardcoded to a specific service requires an engineer familiar with that service's naming conventions to adapt it for anything else. A variable-driven dashboard, by contrast, can be handed to a new team member, a different service team, or an on-call engineer covering someone else's rotation, and it will present the right options because it discovers them dynamically. This lowers the expertise barrier for using dashboards effectively, which matters enormously during incident response when the person paged at 3 a.m. may not be the dashboard's original author.
The rise of platforms like Prometheus, which expose rich label metadata alongside every metric, made this kind of dynamic discovery practical at scale. A query variable can call label_values against a Prometheus data source and receive back a live, current list of every namespace, pod, or job label present in the system right now[2]. That mechanism, covered in depth in a later chapter, is one of the reasons Prometheus and Grafana became such a common pairing in cloud-native monitoring stacks. The metadata that Prometheus already tracks becomes, almost for free, the fuel for a dynamic dashboard interface.
There is also a cognitive benefit that is less obvious than the maintenance savings but arguably just as important. A dashboard cluttered with panels for every environment, service, and region at once is overwhelming to read, even if all the data is technically present. A variable-driven dashboard can show one environment, one service, one region at a time, with the ability to pivot instantly, which respects the limits of human attention far better than a wall of forty simultaneous graphs. Good variable design is, in this sense, a form of information design as much as a technical configuration task.
None of this means variables are free of tradeoffs. A dashboard with too many variables, or variables that are poorly named, or chains of dependent variables that are not documented, can become just as confusing as the duplication problem it was meant to solve. A dropdown labeled var1 that secretly filters by Kubernetes namespace helps nobody. Effective variable design requires the same discipline as any other part of dashboard construction: clear naming, sensible defaults, and restraint about how many controls to expose to a viewer at once. Later chapters address this directly, particularly the discussion of naming conventions and scalability patterns.
The scale problem compounds further in organizations running many teams against a shared Grafana instance. Without variables, each team tends to fork a dashboard from a colleague's work, tweak the hardcoded values for its own service, and lose any future improvements the original author makes. With variables, a single well-built dashboard template can serve dozens of teams simultaneously, each selecting its own service or environment from the same dropdown, with improvements to the underlying dashboard benefiting everyone at once. This pattern, sometimes called dashboard template reuse, turns dashboard building from a repeated manual task into a one-time engineering investment.
Variables additionally open the door to monitoring patterns that would be structurally impossible with static dashboards. Chained variables, covered in a dedicated chapter, let a user select a cluster and see the pod dropdown automatically narrow to only pods that exist in that cluster, creating a guided drill-down experience rather than a flat list of every pod in the entire fleet. Dynamic thresholds let an alert boundary shift based on a variable's value, so a CPU alert can use a stricter threshold for production than for staging without maintaining two separate alert rules. These capabilities do not exist as add-ons bolted onto static dashboards. They exist because variables make the dashboard's behavior conditional on live input in the first place.
Finally, variables matter because monitoring itself has grown more collaborative. A decade ago, a single systems administrator might have been the sole user of a given dashboard. Today, dashboards are shared across DevOps, site reliability engineering, application development, and even non-technical stakeholders who want a quick view of system health. A shared surface needs shared flexibility, and variables are the mechanism that lets one dashboard serve many different viewers with different needs, without forcing anyone to learn Grafana's query language just to change which service they are looking at.
Taken together, these reasons explain why variables sit at the center of this book rather than as a minor feature covered in passing. They are not a convenience for advanced users to discover eventually. They are the structural difference between a dashboard that ages well and one that becomes obsolete the moment the infrastructure underneath it changes, which in most modern environments happens continuously.
What You'll Learn in This Book
The chapters ahead follow a deliberate progression, moving from foundational concepts toward increasingly advanced techniques. Early chapters establish vocabulary and mental models that later chapters depend on without re-explaining, so skipping ahead can leave gaps that make advanced material harder to follow than it needs to be. The overall arc moves from understanding what a variable is, to building the simplest variable types, to querying live data, to combining variables in sophisticated cascading and conditional patterns, and finally to operating variable-driven dashboards reliably at scale.
The opening technical chapter establishes the fundamentals: what a variable actually is inside Grafana's architecture, the complete taxonomy of variable types the platform offers, the internal anatomy of a variable definition, and the distinction between a variable scoped to a single dashboard and one available globally across an organization's Grafana instance. This foundation matters because every later technique, from query variables to chained dependencies, is built from the same basic components introduced here. Understanding this anatomy up front makes every subsequent chapter faster to absorb, because the underlying structure will already feel familiar.
From there, the book covers the simplest variable types in detail: text variables, which accept free-form user input, and constant variables, which hold fixed values useful for things like API endpoints or organization identifiers that rarely change. These are the easiest variables to build and the best place to practice the mechanics of variable creation before moving to more complex, data-driven types. Common patterns for these simple variable types, such as using a text variable to hold a search filter, are covered with practical examples.
Query variables receive extensive treatment because they represent the most powerful and most commonly used variable type in production dashboards. This includes building query variables against Prometheus specifically, since Prometheus's label-based metadata model makes it a natural fit for dynamic variable population, as well as patterns for working with other data sources that expose data differently. A dedicated section addresses the performance implications of query variables, since a poorly designed query variable can slow down every dashboard load for every user, which is a mistake worth avoiding before it becomes a habit.
Multi-select variables and chained variables form their own extended discussion, because together they enable the cascading filter experience that makes dashboards feel intelligent rather than simply configurable.
- Multi-select variables let a user pick several values at once, such as three specific hosts out of twenty.
- The All option lets a user select every available value in a single click, useful for aggregate views.
- Chained variables let one variable's available options depend on another variable's current selection, creating a guided hierarchy such as cluster, then namespace, then pod.
A full chapter addresses regex transformations, value mapping, and display formatting, the tools that turn raw, sometimes ugly data returned by a query into clean, readable options in a dropdown. A raw label value like prod-us-east-1-cluster-07 can be transformed via regex into a friendly display label like US East Production, without changing the underlying value used in queries. This is often the difference between a dashboard that feels professional and one that feels like a half-finished internal tool, and the techniques involved are more approachable than they first appear.
Correct interpolation of variables inside actual panel queries gets its own detailed treatment, covering interpolation syntax variants, escaping rules for special characters, and how to construct conditional queries that behave differently depending on which variable value is active. This is where variable configuration meets the query language of the underlying data source, and small mistakes here, like forgetting to quote a multi-value variable correctly, are among the most common sources of confusing dashboard errors.
Advanced techniques follow, including conditional panel visibility, where an entire panel appears or disappears based on a variable's current value, and dynamic thresholds, where alert boundaries or panel coloring shift according to variable state. Variable refresh behavior, meaning when and how often a variable's option list gets recalculated, is covered here too, since getting refresh timing wrong can mean a dashboard shows stale options or, worse, hammers a data source with unnecessary repeated queries.
Variables extend beyond panel queries into two other Grafana features that many users overlook: annotations and alert rules. A chapter is dedicated to wiring variables into annotation queries so that event markers on a graph respond to the same filtering context as the rest of the dashboard, and into alert rules and notification templates so that alert messages can dynamically reference the specific service or environment that triggered them. This turns alerting from a generic notification system into one that speaks the same contextual language as the dashboard a responder is already looking at.
A chapter on dashboard design addresses the human side of variable-heavy dashboards: how to organize variables so a first-time viewer is not overwhelmed, naming conventions that keep a large dashboard understandable months after it was built, and scalability patterns for organizations running variable-driven templates across many teams simultaneously. This is where the technical skill of building a variable meets the design discipline of building one that other people can actually use without confusion.
The final technical chapter turns to reliability: systematically testing variables across multiple data sources, recognizing and fixing the most common variable-related errors, debugging techniques for tracking down why a variable is returning unexpected results, and performance optimization strategies including query caching for variables that are expensive to recalculate on every dashboard load. These skills matter most in production, when a broken variable can quietly make an entire dashboard unusable for an entire team.
Two shorter closing sections wrap up the material. The conclusion distills the book's key takeaways into a compact review and offers direction for continued learning beyond this book. The appendix provides a quick reference for variable types, a cheat sheet of commonly used regex patterns, and a troubleshooting checklist, all designed to be consulted quickly while actually building a dashboard rather than read cover to cover.
How to Use This Guide
This book is built to be read in order at least once, even for readers who already have intermediate Grafana experience. The chapters build deliberately on each other's vocabulary, and later chapters assume familiarity with terms and concepts established earlier, such as variable anatomy from the fundamentals chapter or interpolation syntax from the chapter on queries and expressions. A reader who skips straight to advanced techniques may find references to concepts that were only fully explained several chapters earlier, which slows understanding rather than speeding it up.
That said, the book is also designed to function as a reference after that first complete read. Each chapter and subchapter is scoped narrowly enough that a reader can return to a specific section, such as the discussion of chained variables or the regex cheat sheet in the appendix, without needing to reread everything that came before. Bookmark the table of contents and treat the appendix as a first stop when a quick answer is needed mid-project, rather than searching back through full chapters for a remembered detail.
Hands-on practice will do more for retention than reading alone. Every technique described in this book, from building a simple text variable to constructing a three-level chained variable hierarchy, is meant to be tried in an actual Grafana instance rather than only studied on the page.
- A free Grafana Cloud account or a local Docker-based Grafana installation both work well for following along.
- Connecting a real data source, even a simple one, makes query variable chapters far more concrete than reading about hypothetical data.
- Building a small practice dashboard from scratch, then rebuilding it with variables applied, is one of the fastest ways to internalize the difference variables make.
Consider setting up a dedicated practice environment before starting the fundamentals chapter, separate from any production Grafana instance already in use at work. Experimenting with variable configurations sometimes produces broken or confusing intermediate states, and a sandbox environment removes any hesitation about testing an idea because of fear of disrupting a dashboard colleagues depend on. This also makes it safe to intentionally break something, which is often the fastest way to understand why a particular escaping rule or refresh setting matters in the first place.
Pay close attention to the worked examples included throughout each chapter, since these are chosen to reflect situations that come up repeatedly in real monitoring work rather than abstract or contrived scenarios. Where an example references a specific data source, most commonly Prometheus given its prevalence in the field, the underlying concept typically transfers to other data sources with adjustments to query syntax rather than a completely different approach. Chapters that specifically address other data sources will call out where the pattern diverges meaningfully.
Readers managing dashboards across multiple teams or a large infrastructure footprint should pay particular attention to the chapters on dashboard design and naming conventions, even if the immediate technical need is elsewhere. It is far easier to establish consistent variable naming and organizational patterns before a library of dashboards grows large than to retrofit consistency onto dozens of existing dashboards later. A few hours spent early establishing a naming standard, such as always using lowercase snake_case for variable names and a consistent prefix for environment-related variables, pays back many times over as a dashboard library expands.
Treat the troubleshooting checklist in the appendix as a living tool rather than a one-time read. Print it out or keep it open in a separate tab while actively building or debugging a dashboard, since many variable-related errors, like a query variable returning an empty list or a chained variable failing to update, have a small number of common root causes that the checklist walks through systematically. Diagnosing these issues from first principles each time wastes time that the checklist is specifically designed to save.
Teams adopting these techniques together, rather than individually, will get more value out of coordinated practice. Consider using this book as the basis for a short internal workshop or lunch-and-learn series, where each session works through one or two chapters and immediately applies the techniques to a real dashboard the team maintains. Shared vocabulary matters here: if one engineer calls something a "chained variable" and another calls it a "dependent dropdown," small misunderstandings compound during troubleshooting conversations later, so adopting this book's canonical terminology as a team standard smooths collaboration.
Finally, expect that mastery of these techniques comes from repeated application across different scenarios rather than from a single read-through, however careful. The first dashboard built with query variables and chained dependencies will likely need revision once real usage patterns emerge and edge cases appear that were not obvious during initial construction. This is normal and expected. Treat each dashboard as an opportunity to apply lessons learned from the last one, and the patterns described across these chapters will start to feel like natural instinct rather than a checklist to consult every time.
This is the end of the free sample. The full book has 10 chapters.
Want this book written for you?
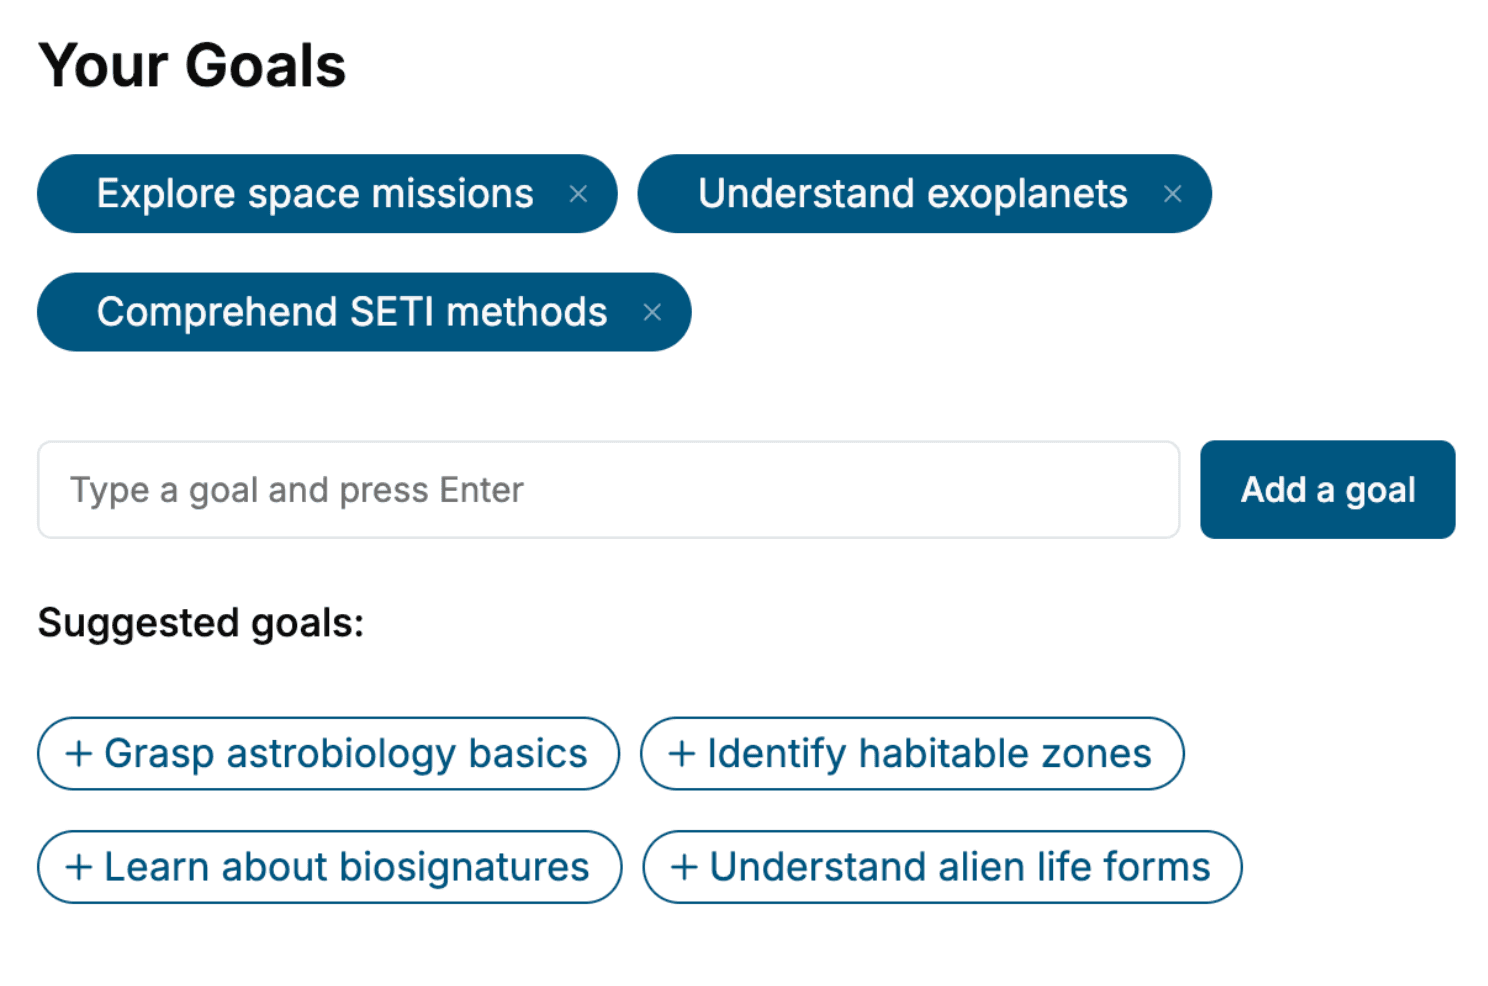
Tell us your goals and background, and get your own version of this book, tailored by AI to you.


Benefits of AI-tailored books
- Read one book, not ten:
- all the Grafana knowledge you need, gathered into a single book.
- Save days of learning:
- tell us your goals, choose your topics, and the whole book is built around them.
- Learn effortlessly:
- Grafana book written for your specific background and expertise.
- Understand at a glance:
- includes charts, tables, timelines, checklists, decision trees, and more.
- Stay current:
- written the day you order it, not years ago.
- Trust what you read:
- every book is checked for accuracy, with real research when your subject needs it.
Create your unique book in 3 steps
- 1. Select your focus
Select the focus of your Grafana book and share your background
- 2. Personalize your book
Specify your goals and choose sub-topics to include
- 3. Get your tailored book
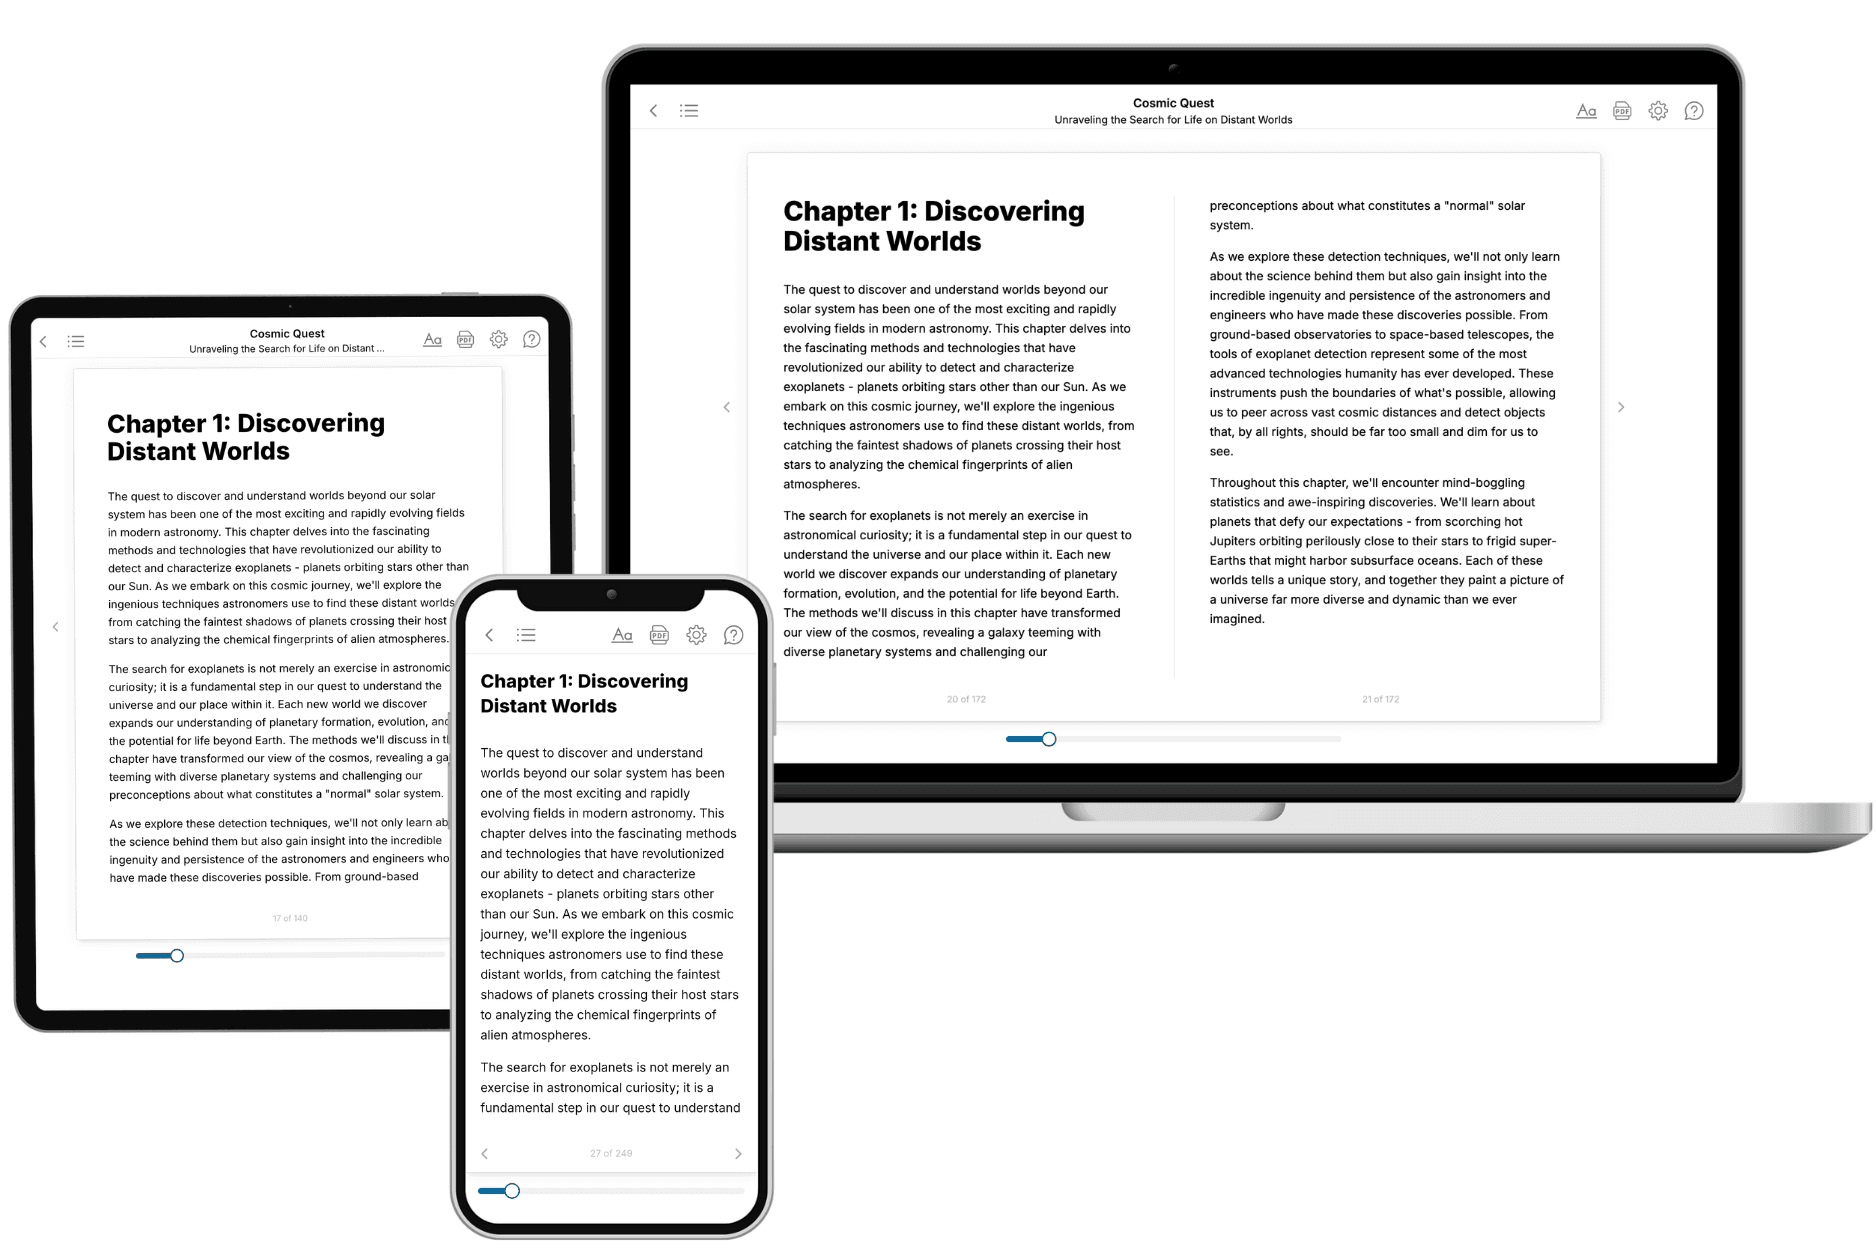
Your book is ready in 10 minutes. Read it online, download as EPUB or PDF, or send to Kindle.

Frequently asked questions
- What is TailoredRead?
TailoredRead creates complete, full-length nonfiction ebooks, written specifically for you. Tell us what you want to learn and why, and TailoredRead writes you a complete ebook on it, with charts, tables, and diagrams throughout. Read it online, on Kindle, or on any e-reader, or download it as a PDF or EPUB. Every book is written fresh the day you order it.
- How is the book tailored to me?
Before anything is written, you answer a few short questions about your goals, your background, and the topics you care about. Your book is then planned around your answers: written at your level, focused on your goals, and covering the topics you chose, instead of the one-size-fits-all book a store sells everyone.
- Will it read like generic AI content?
No. Your book isn't a chat transcript: it's planned chapter by chapter before a single word is written, told in a clear book voice, and explains ideas visually with charts, tables, and diagrams. After writing, every book goes through an editorial pass that polishes chapters so the book reads consistent from start to finish. Judge for yourself: browse thousands of sample books on our Explore Books page.
- How accurate is the content?
Our AI first checks whether your subject needs live research. Niche and fast-moving subjects are researched before writing, and the book plan and chapters are grounded in what it finds. After writing, every book goes through a quality pass that checks its facts and consistency, and researched books list their sources in a Notes section at the back.
- How long is the book?
You choose the length: Comprehensive (250-300 pages), Detailed (150-200 pages), Essential (70-100 pages), or Short (30-50 pages).
- Does the book include visuals?
Yes. Every book includes charts, tables, and diagrams: timelines, checklists, step-by-step guides, decision trees, comparison tables, matrices, and bar charts. A typical book includes dozens of these visual elements.
- Can I read it on Kindle? What formats can I download?
Yes. Every book can be read in our online reader or downloaded as a PDF or EPUB. The EPUB can be opened with Kindle, Apple Books, Kobo, and any e-reader. The Commercial and Author licenses also include an editable Word (DOCX) and Markdown download.
- How much does it cost?
About the price of a regular ebook. The exact price depends on your book's length and complexity, from $2 for the shortest books to $35 for the most comprehensive, and it's shown when you review your book, before you commit to anything. Each book is a one-time purchase, yours to keep, no subscription. Licenses that let you share, teach, or publish your book range from $35.99 to $49.99.
- Can I preview the book before purchasing?
Before you pay, you'll see what your book will cover: the title, a detailed description, the estimated length, and the complete chapter-by-chapter table of contents, so you know what you're getting before you decide. The full text itself is written after you purchase.
- How long does it take to create a book?
About 10 minutes. You can start reading the opening chapters while the rest is still being written.