Mastering ML Visualization
Advanced Techniques for Creating Intuitive and Powerful User Interfaces in Machine Learning
Think machine learning visualizations are just about pretty charts and graphs?
300 pages15 chaptersApr 14, 2025User InterfaceCreated by Chris
About this book
Think again. In the complex world of ML, effective user interfaces are the key to unlocking the true potential of your models and data. Mastering ML Visualization dives deep into the intricate art of creating intuitive, high-performance UIs that not only display data but also enhance understanding and interaction with machine learning models. From leveraging the power of D3.js force layouts to optimizing performance with WebAssembly, this comprehensive guide covers cutting-edge techniques that will revolutionize your approach to ML interface design. You'll learn how to craft responsive grid systems that adapt seamlessly to any device, implement sophisticated SVG animations that bring your data to life, and design microinteractions that provide instant feedback and enhance user engagement. With a focus on accessibility and performance, you'll discover how to create interfaces that are not only visually stunning but also inclusive and lightning-fast. Whether you're visualizing complex decision trees, creating interactive dashboards for real-time data streaming, or designing intuitive interfaces for model explainability, this book equips you with the tools and knowledge to push the boundaries of what's possible in ML visualization. Get ready to elevate your UI design skills and create machine learning interfaces that are as powerful as they are beautiful.
Table of contents
- IntroductionThe Importance of Visualization in Machine Learning, Overview of the Book, The Synergy Between UI Design and ML, What to Expect as an Advanced ReaderRead below
- Chapter 1: Foundations of ML VisualizationCore Principles of Data Visualization, Essential ML Concepts for UI Designers, Common UI Patterns in ML Applications, Understanding ML Data Types and Their Visual Representations
- Chapter 2: Mastering D3.js for ML VisualizationsAdvanced D3.js Concepts and Techniques, Creating Dynamic Force Layouts for ML Data, Smooth Transitions and Animations in D3.js, Building Custom Chart Types for ML-Specific Needs
- Chapter 3: Leveraging WebGL for High-Performance ML VisualsIntroduction to WebGL in the Context of ML, Shader Programming for ML Visualizations, Rendering Large-Scale ML Datasets with WebGL, Adding Interactivity to WebGL Visualizations
- Chapter 4: React Hooks and Patterns for ML User InterfacesAdvanced React Hooks for ML UIs, State Management Strategies for Complex ML Apps, Architecting Reusable ML UI Components, Performance Optimization Techniques in React ML UIs
- Chapter 5: Advanced SVG Animation TechniquesSVG Fundamentals for ML Visualizations, Creating Complex Animations for ML Data Flow, SVG Shape Morphing for Transitioning ML States, Performance Tips for Smooth SVG Animations
- Chapter 6: Color Theory and Psychology in ML InterfacesFundamentals of Color Theory for Data Visualization, Effective Color Mapping for ML Data, Ensuring Color Accessibility in ML UIs, Balancing Brand Colors with Data Visualization Needs
- Chapter 7: Implementing Responsive Grid SystemsAdvanced CSS Grid Techniques, Creating Flexible Layouts for ML Dashboards, Responsive Chart Layouts and Sizing, Performance Considerations for Complex Grid Systems
- Chapter 8: Designing UIs for ML Model ExplainabilityIntroduction to Explainable AI Concepts, Visualizing Feature Importance and Impact, Illustrating Decision Paths in ML Models, Designing User Interactions for Model Exploration
- Chapter 9: Crafting UI Microinteractions for ML InterfacesPrinciples of Effective Microinteractions, Designing Feedback Loops for ML Processes, Subtle Animations to Enhance User Experience, Performance Considerations for Microinteractions
- Chapter 10: Optimizing Performance with WebAssemblyIntroduction to WebAssembly for ML UIs, Offloading Heavy Computations to WebAssembly, Integrating WebAssembly with JavaScript in ML Apps, Real-world Use Cases of WebAssembly in ML Visualization
- Chapter 11: Ensuring Accessibility in ML InterfacesCore Principles of Accessible ML UIs, Making ML Visualizations Screen Reader Friendly, Implementing Keyboard Navigation for ML Interfaces, Testing and Auditing ML UIs for Accessibility
- Chapter 12: Advanced State Management in ML ApplicationsState Management Patterns for Complex ML UIs, Handling Asynchronous State in ML Applications, Caching Strategies for ML Data and Results, Performance Optimization in State Management
- Chapter 13: Building UIs for Real-time ML Data StreamingFundamentals of Real-time Data Streaming, Implementing WebSockets for Live ML Updates, Efficient Data Buffering and Processing, Visualizing Streaming ML Data Effectively
- Chapter 14: Leveraging CSS Grid for ML DashboardsCreating Complex Dashboard Layouts with CSS Grid, Building Responsive ML Dashboards, Customizing Grid Layouts for Different ML Visualizations, Adding Interactivity to Grid-based Dashboards
- Chapter 15: Implementing UI Skeleton Screens for ML AppsPrinciples of Effective Skeleton Screens, Designing Skeleton Screens for ML-specific Components, Adding Animations to Skeleton Screens, Performance Considerations for Skeleton UIs
- ConclusionFuture Trends in ML Visualization, Strategies for Continuous Learning and Improvement
- Glossary
- Further Reading
Introduction
In the rapidly evolving landscape of machine learning (ML) and artificial intelligence, the ability to effectively visualize complex data and model outputs has become increasingly crucial. As a highly experienced Principal Software Engineer with an MSc in Computer Science, you're already well-versed in the intricacies of software development. However, the intersection of machine learning and user interface design presents a unique set of challenges and opportunities that can elevate your skills to new heights. This book, "Mastering ML Visualization: Advanced Techniques for Creating Intuitive and Powerful User Interfaces in Machine Learning," is designed to equip you with cutting-edge strategies and techniques for crafting sophisticated, high-performance user interfaces that not only display ML data but also enhance understanding and interaction with machine learning models.
The field of ML visualization goes far beyond creating aesthetically pleasing charts and graphs. It's about designing interfaces that unlock the true potential of your models and data, making complex information accessible, interactive, and actionable. Throughout this book, you'll discover how to combine advanced UI techniques with ML concepts to create more intuitive and powerful interfaces. You'll learn to optimize performance for handling large-scale ML data in real-time, ensure accessibility so that insights are available to all users, and apply responsive design principles to create ML UIs that work seamlessly across various devices and screen sizes.
As we delve deeper into the world of ML visualization, you'll explore how to develop custom UI components and design systems that streamline development and maintain consistency across your applications. You'll master the art of creating interactive visualizations that significantly improve the explainability of complex ML models, making it easier for stakeholders to understand and trust the decisions made by these systems. We'll also cover techniques for implementing real-time data streaming and updates, which are essential for creating dynamic ML interfaces that reflect the latest insights and predictions.
Color theory and animations play a crucial role in enhancing the communication of ML insights, and you'll learn how to leverage these elements effectively in your designs. Additionally, we'll focus on building modular and testable UI architectures, which are crucial for maintaining and scaling ML applications as they grow in complexity and scope. By the end of this book, you'll have a comprehensive understanding of how to create ML visualizations that are not just visually stunning, but also highly functional, performant, and user-friendly.
Let's embark on this journey to master the art and science of ML visualization, pushing the boundaries of what's possible in user interface design for machine learning applications. Whether you're visualizing complex decision trees, creating interactive dashboards for real-time data streaming, or designing intuitive interfaces for model explainability, this book will equip you with the knowledge and tools to create ML interfaces that are as powerful as they are beautiful.
The Importance of Visualization in Machine Learning
In the realm of machine learning, where complex algorithms process vast amounts of data to derive insights and make predictions, visualization serves as a crucial bridge between raw data and human understanding. The importance of effective visualization in ML cannot be overstated, as it transforms abstract concepts and numerical outputs into tangible, interpretable information that can drive decision-making and foster trust in ML systems. As you delve deeper into the world of ML visualization, you'll discover that well-designed interfaces do more than just present data; they enable users to interact with models, explore relationships, and gain insights that might otherwise remain hidden in the depths of mathematical computations.
One of the primary reasons visualization is so critical in machine learning is its ability to make complex models more transparent and interpretable. Many ML algorithms, particularly deep learning models, are often referred to as "black boxes" due to their intricate internal workings. Effective visualization techniques can help peel back the layers of these black boxes, allowing users to understand how models arrive at their conclusions. This transparency is not just a matter of scientific curiosity; it's increasingly becoming a regulatory requirement in many industries, where decisions made by ML models need to be explainable and justifiable[1].
Visualization also plays a crucial role in the data exploration and preprocessing stages of ML projects. Before feeding data into models, it's essential to understand its distribution, identify patterns, and detect anomalies or outliers. Advanced visualization techniques can help you uncover hidden structures in high-dimensional data, reveal correlations between features, and guide feature engineering decisions. For instance, techniques like t-SNE (t-Distributed Stochastic Neighbor Embedding) or UMAP (Uniform Manifold Approximation and Projection) can project high-dimensional data onto 2D or 3D spaces, making it possible to visually identify clusters and relationships that might not be apparent in raw numerical data[2].
Furthermore, visualization is indispensable in the model evaluation and comparison process. When dealing with multiple models or different iterations of the same model, visual representations of performance metrics, confusion matrices, and ROC curves can provide quick and intuitive ways to assess and compare model effectiveness. Interactive visualizations that allow users to explore how changes in hyperparameters affect model performance can significantly streamline the model tuning process, leading to more efficient and effective ML workflows.
In the context of real-time ML systems, visualization becomes even more critical. Dynamic, updating visualizations can help monitor model performance, detect drift in incoming data distributions, and alert stakeholders to potential issues before they become critical. For example, in a financial trading system powered by ML, real-time visualizations of market data, model predictions, and confidence intervals can provide traders with the information they need to make split-second decisions.
The importance of visualization extends beyond the technical aspects of ML to the realm of communication and collaboration. In many organizations, data scientists and ML engineers need to communicate their findings and the capabilities of their models to non-technical stakeholders. Well-designed visualizations can bridge this communication gap, making complex ML concepts accessible to business leaders, policymakers, and other decision-makers. This improved communication can lead to better alignment between technical teams and business objectives, ultimately resulting in more successful ML initiatives.
Moreover, as machine learning increasingly becomes a collaborative effort involving diverse teams, visualization can serve as a common language. Interactive dashboards and visual analytics tools can facilitate discussions between data scientists, domain experts, and end-users, fostering a more inclusive and productive development process. This collaborative aspect of visualization can lead to more robust and user-centered ML solutions.
It's also worth noting that effective visualization in ML goes beyond static charts and graphs. As you'll explore in later chapters, advanced techniques like interactive 3D visualizations, augmented reality (AR) displays, and even sonification (the use of non-speech audio to convey information) are pushing the boundaries of how we interact with and understand ML models and their outputs. These cutting-edge approaches can provide new perspectives on data and model behavior, potentially leading to breakthroughs in model design and application.
In conclusion, visualization is not just an add-on or a final polish to ML projects; it's an integral part of the entire machine learning lifecycle. From initial data exploration to model development, evaluation, deployment, and ongoing monitoring, well-designed visualizations enhance every stage of the process. As you progress through this book, you'll gain the skills to create visualizations that not only present data beautifully but also provide deep insights, facilitate better decision-making, and unlock the full potential of your machine learning models. The ability to craft effective ML visualizations is a powerful skill that can set you apart in the field, enabling you to build more transparent, interpretable, and user-friendly ML systems.
Overview of the Book
"Mastering ML Visualization" is structured to provide you with a comprehensive and practical guide to creating sophisticated user interfaces for machine learning applications. The book is designed to take you on a journey from foundational concepts to advanced techniques, ensuring that you have a solid grasp of both the theoretical underpinnings and practical implementations of ML visualization. Each chapter builds upon the previous ones, gradually increasing in complexity and depth, allowing you to progressively enhance your skills and tackle more challenging aspects of ML UI design.
We begin with the "Foundations of ML Visualization" in Chapter 1, where we explore the core principles of data visualization and how they specifically apply to machine learning contexts. This chapter also covers essential ML concepts that UI designers need to understand, common UI patterns in ML applications, and the various types of ML data you'll encounter and how to visually represent them. This foundational knowledge will serve as the bedrock for the more advanced topics that follow.
Chapter 2 dives deep into "Mastering D3.js for ML Visualizations." D3.js is a powerful library for creating dynamic, interactive data visualizations in web browsers, and it's particularly well-suited for ML applications due to its flexibility and performance. You'll learn advanced D3.js concepts and techniques, how to create dynamic force layouts for ML data, implement smooth transitions and animations, and build custom chart types tailored to ML-specific needs. By the end of this chapter, you'll have the skills to create sophisticated, interactive visualizations that can bring your ML data to life.
In Chapter 3, we explore "Leveraging WebGL for High-Performance ML Visuals." As ML datasets grow larger and more complex, traditional rendering techniques can struggle to keep up. WebGL allows you to harness the power of the GPU for rendering, enabling smooth visualizations of massive datasets. You'll learn the basics of WebGL in the context of ML, dive into shader programming for ML visualizations, and discover techniques for rendering large-scale ML datasets and adding interactivity to WebGL visualizations.
Chapter 4 focuses on "React Hooks and Patterns for ML User Interfaces." React has become a dominant framework for building user interfaces, and its component-based architecture is well-suited to the modular nature of ML applications. You'll explore advanced React Hooks specifically useful for ML UIs, learn state management strategies for complex ML apps, discover how to architect reusable ML UI components, and master performance optimization techniques for React-based ML interfaces.
The book then moves on to more specialized topics. Chapter 5 covers "Advanced SVG Animation Techniques," where you'll learn how to create complex animations for ML data flow, implement SVG shape morphing for transitioning between ML states, and optimize performance for smooth SVG animations. Chapter 6 delves into "Color Theory and Psychology in ML Interfaces," teaching you how to effectively use color to enhance the communication of ML insights while ensuring accessibility and balancing brand requirements.
In Chapter 7, we tackle "Implementing Responsive Grid Systems," crucial for creating ML interfaces that work seamlessly across devices. You'll master advanced CSS Grid techniques, learn to create flexible layouts for ML dashboards, and understand how to make charts and visualizations responsive without sacrificing clarity or functionality.
Chapter 8 addresses one of the most critical aspects of modern ML applications: "Designing UIs for ML Model Explainability." You'll learn how to create interfaces that help users understand how ML models arrive at their decisions, visualize feature importance and impact, and design interactions that allow for in-depth exploration of model behavior.
The following chapters dive into more advanced and specialized topics. Chapter 9 covers "Crafting UI Microinteractions for ML Interfaces," teaching you how to design subtle yet powerful interactions that enhance the user experience. Chapter 10 explores "Optimizing Performance with WebAssembly," showing you how to leverage this technology to handle computationally intensive tasks in ML visualizations.
Accessibility is a crucial consideration in modern UI design, and Chapter 11, "Ensuring Accessibility in ML Interfaces," provides a comprehensive guide to making your ML visualizations accessible to all users, including those using assistive technologies.
The book concludes with advanced topics such as "Advanced State Management in ML Applications" (Chapter 12), "Building UIs for Real-time ML Data Streaming" (Chapter 13), "Leveraging CSS Grid for ML Dashboards" (Chapter 14), and "Implementing UI Skeleton Screens for ML Apps" (Chapter 15). These chapters will equip you with cutting-edge techniques for handling complex state, real-time data, sophisticated layouts, and optimized loading experiences in ML applications.
Throughout the book, you'll find practical examples, code snippets, and case studies that illustrate how to apply these concepts in real-world scenarios. By the end of "Mastering ML Visualization," you'll have a comprehensive toolkit for creating state-of-the-art user interfaces for machine learning applications, capable of handling complex data, ensuring high performance, and providing intuitive user experiences.
The Synergy Between UI Design and ML
The intersection of User Interface (UI) design and Machine Learning (ML) represents a powerful synergy that is reshaping how we interact with data and AI-driven systems. This convergence is not merely about making ML outputs visually appealing; it's about creating interfaces that enhance the functionality, interpretability, and user experience of ML applications. As you delve deeper into this field, you'll discover that effective UI design can significantly amplify the impact of ML models, while ML can inform and enhance UI design in ways previously unimaginable.
At its core, the synergy between UI design and ML is about bridging the gap between complex algorithmic processes and human understanding. Machine learning models often work with high-dimensional data and produce outputs that can be challenging for humans to interpret directly. Well-designed user interfaces act as translators, converting these complex outputs into visual representations that users can easily comprehend and interact with. This translation is not a one-way process; it also allows users to input their domain knowledge and feedback into the ML system, creating a virtuous cycle of human-AI collaboration[3].
One of the key areas where this synergy shines is in the realm of explainable AI (XAI). As ML models become more complex and are applied to high-stakes decisions in fields like healthcare, finance, and criminal justice, there's an increasing demand for these models to be transparent and interpretable. UI design plays a crucial role in making ML models more explainable by providing visual interfaces that allow users to explore model decisions, understand feature importance, and trace decision paths. For instance, interactive decision tree visualizations can help users understand how a model arrives at a particular classification, while feature importance plots can highlight which inputs have the most significant impact on model outputs.
The synergy between UI and ML also manifests in the way ML can enhance UI design itself. Machine learning algorithms can analyze user interaction data to identify patterns and preferences, allowing for the creation of adaptive interfaces that evolve based on user behavior. This can lead to personalized user experiences where the UI adjusts its layout, content presentation, or even functionality based on individual user needs and habits. For example, an ML-powered dashboard might automatically reorganize its components based on each user's most frequently accessed information, or an e-commerce site might dynamically adjust its product recommendations based on real-time user behavior.
Another area where UI design and ML complement each other is in handling uncertainty and probabilistic outputs. Many ML models produce probabilistic predictions rather than definitive answers. Effective UI design can communicate this uncertainty in intuitive ways, such as through confidence intervals, probability distributions, or interactive visualizations that allow users to explore different scenarios. This not only provides more accurate information to users but also helps build trust in the ML system by being transparent about its limitations and the range of possible outcomes.
The synergy extends to the realm of data exploration and feature engineering. Advanced UI techniques can create interactive environments where data scientists and analysts can visually explore high-dimensional datasets, identify patterns, and select relevant features for ML models. Tools like interactive scatter plot matrices, parallel coordinates plots, and dimensionality reduction visualizations allow users to gain insights that might be missed when looking at raw data or summary statistics alone. This visual approach to data exploration can lead to more effective feature selection and engineering, ultimately resulting in better-performing ML models.
In the context of real-time ML systems, the UI-ML synergy becomes even more critical. User interfaces for streaming data applications need to be designed to handle continuous updates and alert users to significant changes or anomalies. ML algorithms can help by identifying important events or trends in the data stream, while well-designed UIs can present this information in a way that allows for quick decision-making. For instance, a network security dashboard might use ML to detect unusual patterns in network traffic and use UI elements like color coding, animations, or alert systems to draw the operator's attention to potential threats in real-time.
The collaborative aspect of ML development also benefits greatly from this synergy. Modern ML projects often involve diverse teams of data scientists, domain experts, and end-users. Well-designed user interfaces can serve as a common ground for these different stakeholders to interact with the ML system, provide feedback, and collaborate on improving the model. Interactive model debugging tools, for example, can allow data scientists to visualize model performance across different subsets of data, while domain experts can use the same interface to provide insights on unexpected model behaviors based on their specialized knowledge.
As we look to the future, emerging technologies are opening up new possibilities for UI-ML synergy. Augmented Reality (AR) and Virtual Reality (VR) interfaces, for instance, offer immersive ways to interact with ML models and data. Imagine exploring a 3D visualization of a complex neural network architecture in VR, or using AR to overlay ML-generated insights onto real-world objects. These technologies, combined with advanced ML algorithms, have the potential to create entirely new paradigms for human-AI interaction.
In conclusion, the synergy between UI design and ML is a powerful force that is driving innovation in how we interact with AI systems. As you progress through this book, you'll gain the skills to leverage this synergy, creating ML applications that are not only powerful and accurate but also intuitive, transparent, and user-friendly. The ability to seamlessly blend advanced UI design principles with ML capabilities will set you apart in the field, enabling you to create ML systems that truly augment and enhance human capabilities.
What to Expect as an Advanced Reader
As a highly experienced Principal Software Engineer with an MSc in Computer Science, you bring a wealth of knowledge and expertise to the table. This book is designed to build upon your existing skills and push you further into the specialized realm of machine learning visualization. While we'll cover some foundational concepts to ensure a common understanding, the primary focus will be on advanced techniques and cutting-edge approaches that will challenge you and expand your capabilities in creating sophisticated ML user interfaces.
Throughout this book, you can expect to encounter in-depth technical discussions that go beyond surface-level explanations. We'll delve into the intricacies of various visualization libraries, exploring not just how to use them, but also how they work under the hood. This deeper understanding will enable you to optimize performance, extend functionality, and create custom solutions tailored to specific ML visualization challenges. For instance, when discussing D3.js, we won't just cover basic chart creation, but will explore advanced topics like creating custom layouts, optimizing for large datasets, and integrating with ML model outputs.
Given your background, we'll assume a strong foundation in software engineering principles and dive directly into how these apply specifically to ML visualization. You can expect detailed discussions on architectural patterns for ML UIs, state management strategies for complex ML applications, and performance optimization techniques specific to data-intensive visualizations. We'll explore how to design modular, scalable systems that can handle the unique challenges posed by ML applications, such as real-time data streaming, model updates, and interactive exploratory interfaces.
The code examples and projects presented in this book will be substantial and reflective of real-world scenarios. Rather than simplified demonstrations, you'll work with examples that mirror the complexity you might encounter in production ML systems. This includes handling large datasets, integrating with ML model APIs, implementing real-time updates, and ensuring cross-browser and cross-device compatibility. We'll use a variety of modern tools and frameworks, and you'll be expected to quickly adapt to different technologies as we explore the best solutions for various ML visualization challenges.
Given your experience level, we'll also delve into advanced topics that are at the forefront of ML visualization research and industry practice. This includes exploring cutting-edge techniques in areas such as:
- Explainable AI (XAI) visualizations: Advanced methods for visualizing model decision processes, feature importance, and uncertainty.
- High-dimensional data visualization: Techniques for effectively representing and interacting with complex, multi-dimensional ML datasets.
- GPU-accelerated visualizations: Leveraging WebGL and other GPU technologies for rendering large-scale ML data.
- Interactive ML: Designing interfaces that allow users to directly interact with and influence ML models in real-time.
- Federated learning visualizations: Unique challenges in visualizing distributed ML systems while maintaining data privacy.
You can also expect a strong emphasis on best practices and industry standards throughout the book. We'll discuss not just the "how" of ML visualization, but also the "why," exploring the reasoning behind different design decisions and their implications for user experience, performance, and maintainability. This will include in-depth discussions on topics such as accessibility in ML interfaces, ensuring fairness and avoiding bias in visual representations, and designing for trust and transparency in AI systems.
As an advanced reader, you'll be challenged to think critically about the intersection of UI design and machine learning. We'll present case studies and scenarios that require you to apply your knowledge to solve complex problems. You'll be encouraged to consider trade-offs between different approaches, analyze the strengths and weaknesses of various visualization techniques, and develop strategies for choosing the right tools and methods for specific ML visualization tasks.
The book will also touch on emerging trends and future directions in ML visualization. This includes discussions on how technologies like augmented reality (AR), virtual reality (VR), and mixed reality (MR) are opening up new possibilities for interacting with ML models and data. We'll explore how advances in areas like natural language processing (NLP) and computer vision are influencing UI design for ML applications, and consider the implications of these developments for the future of ML visualization.
Throughout the book, you'll find references to academic papers, industry reports, and other advanced resources that you can explore to deepen your understanding of specific topics. We encourage you to engage with these materials, as they provide valuable context and insights into the theoretical foundations and cutting-edge research underlying many of the techniques we'll discuss.
Finally, as an experienced professional, you're likely to bring your own unique perspectives and experiences to the material. We encourage you to critically evaluate the concepts presented, draw connections to your own work, and consider how you can apply and extend these ideas in your specific context. The field of ML visualization is rapidly evolving, and your insights and innovations can contribute significantly to its advancement.
In summary, this book is designed to challenge you, expand your skillset, and provide you with the advanced knowledge and techniques needed to create state-of-the-art ML visualizations. By the end of this journey, you'll be equipped to tackle complex ML visualization projects, push the boundaries of what's possible in ML user interfaces, and lead the way in creating more intuitive, powerful, and impactful ML applications.
Notes
Introduction
- 1. Arrieta, A.B., Díaz-Rodríguez, N., Del Ser, J. et al. Explainable Artificial Intelligence (XAI): Concepts, taxonomies, opportunities and challenges toward responsible AI. Information Fusion, 58, 82-115 (2020).
- 2. Van der Maaten, L., & Hinton, G. Visualizing data using t-SNE. Journal of Machine Learning Research, 9(Nov), 2579-2605 (2008).
- 3. Amershi, S., Weld, D., Vorvoreanu, M., Fourney, A., Nushi, B., Collisson, P., ... & Horvitz, E. Guidelines for human-AI interaction. In Proceedings of the 2019 CHI Conference on Human Factors in Computing Systems (pp. 1-13).
This is the end of the free sample. The full book has 15 chapters.
Want this book written for you?
Tell us your goals and background, and get your own version of this book, tailored by AI to you.


Benefits of AI-tailored books
- Read one book, not ten:
- all the User Interface knowledge you need, gathered into a single book.
- Save days of learning:
- tell us your goals, choose your topics, and the whole book is built around them.
- Learn effortlessly:
- User Interface book written for your specific background and expertise.
- Understand at a glance:
- includes charts, tables, timelines, checklists, decision trees, and more.
- Stay current:
- written the day you order it, not years ago.
- Trust what you read:
- every book is checked for accuracy, with real research when your subject needs it.
Create your unique book in 3 steps
- 1. Select your focus
Select the focus of your User Interface book and share your background
- 2. Personalize your book
Specify your goals and choose sub-topics to include
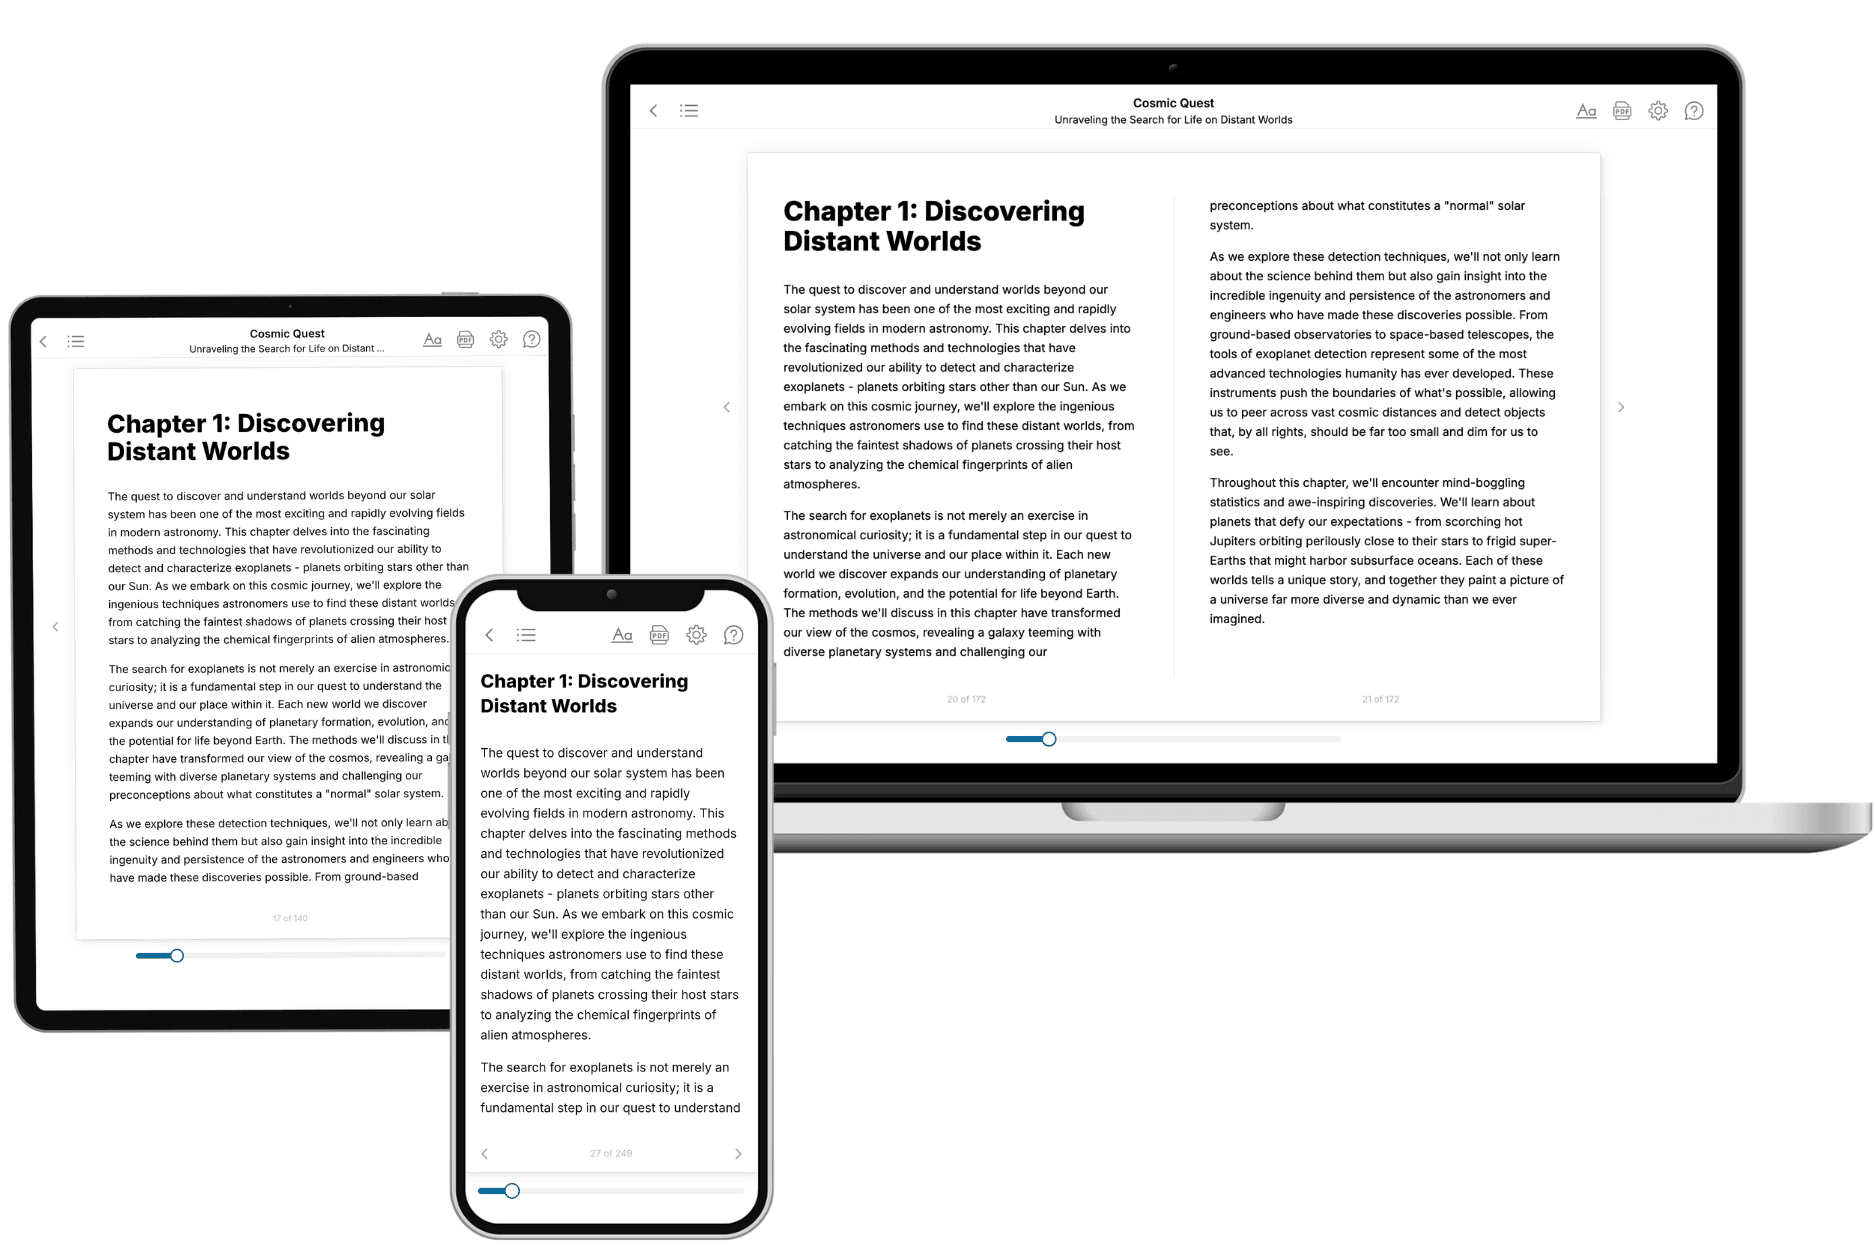
- 3. Get your tailored book
Your book is ready in 10 minutes. Read it online, download as EPUB or PDF, or send to Kindle.
Frequently asked questions
- What is TailoredRead?
TailoredRead creates complete, full-length nonfiction ebooks, written specifically for you. Tell us what you want to learn and why, and TailoredRead writes you a complete ebook on it, with charts, tables, and diagrams throughout. Read it online, on Kindle, or on any e-reader, or download it as a PDF or EPUB. Every book is written fresh the day you order it.
- How is the book tailored to me?
Before anything is written, you answer a few short questions about your goals, your background, and the topics you care about. Your book is then planned around your answers: written at your level, focused on your goals, and covering the topics you chose, instead of the one-size-fits-all book a store sells everyone.
- Will it read like generic AI content?
No. Your book isn't a chat transcript: it's planned chapter by chapter before a single word is written, told in a clear book voice, and explains ideas visually with charts, tables, and diagrams. After writing, every book goes through an editorial pass that polishes chapters so the book reads consistent from start to finish. Judge for yourself: browse thousands of sample books on our Explore Books page.
- How accurate is the content?
Our AI first checks whether your subject needs live research. Niche and fast-moving subjects are researched before writing, and the book plan and chapters are grounded in what it finds. After writing, every book goes through a quality pass that checks its facts and consistency, and researched books list their sources in a Notes section at the back.
- How long is the book?
You choose the length: Comprehensive (250-300 pages), Detailed (150-200 pages), Essential (70-100 pages), or Short (30-50 pages).
- Does the book include visuals?
Yes. Every book includes charts, tables, and diagrams: timelines, checklists, step-by-step guides, decision trees, comparison tables, matrices, and bar charts. A typical book includes dozens of these visual elements.
- Can I read it on Kindle? What formats can I download?
Yes. Every book can be read in our online reader or downloaded as a PDF or EPUB. The EPUB can be opened with Kindle, Apple Books, Kobo, and any e-reader. The Commercial and Author licenses also include an editable Word (DOCX) and Markdown download.
- How much does it cost?
About the price of a regular ebook. The exact price depends on your book's length and complexity, from $2 for the shortest books to $35 for the most comprehensive, and it's shown when you review your book, before you commit to anything. Each book is a one-time purchase, yours to keep, no subscription. Licenses that let you share, teach, or publish your book range from $35.99 to $49.99.
- Can I preview the book before purchasing?
Before you pay, you'll see what your book will cover: the title, a detailed description, the estimated length, and the complete chapter-by-chapter table of contents, so you know what you're getting before you decide. The full text itself is written after you purchase.
- How long does it take to create a book?
About 10 minutes. You can start reading the opening chapters while the rest is still being written.