Mastering the Short Time Fourier Transform
A Practical Guide to Time-Frequency Analysis and Signal Processing
Understanding how signals change over time is one of the most challenging problems in signal processing.
222 pages10 chaptersJan 1, 2026Digital Signal Processing
About this book
Traditional Fourier analysis reveals frequency content but loses temporal information, while time-domain analysis shows when events occur but obscures their frequency characteristics. The Short Time Fourier Transform solves this dilemma by providing simultaneous insight into both dimensions. This book guides you through the complete landscape of STFT—from mathematical foundations to practical implementation. You'll discover how window functions shape analysis quality, master the critical time-frequency resolution trade-off, and learn to interpret spectrograms with confidence. Through real-world examples in audio processing, speech analysis, and vibration monitoring, you'll develop the intuition needed to apply STFT effectively. Whether you're building audio applications, analyzing sensor data, or exploring signal characteristics, this comprehensive guide equips you with both theoretical understanding and practical skills to leverage time-frequency analysis in your work.
Table of contents
- IntroductionWhy Time-Frequency Analysis Matters, What is the Short Time Fourier Transform?, How to Use This BookRead below
- Chapter 1: Fourier Transform FundamentalsFrom Time Domain to Frequency Domain, Discrete Fourier Transform and Fast Fourier Transform, The Limitations of Classical Fourier Analysis
- Chapter 2: Short Time Fourier Transform PrinciplesThe Core Concept: Windowing and Segmentation, Mathematical Definition and Formulation, Advantages Over Classical Fourier Transform
- Chapter 3: Window Functions and Their ImpactUnderstanding Window Functions, Common Window Types: Hann, Hamming, Blackman, and More, Selecting the Right Window for Your Application, Spectral Leakage and Scalloping Loss
- Chapter 4: The Time-Frequency Resolution Trade-OffThe Heisenberg Uncertainty Principle in Signal Processing, Understanding Time and Frequency Resolution, Making Practical Trade-Off Decisions
- Chapter 5: Implementation Parameters and OptimizationChoosing Window Size and FFT Length, Hop Size, Overlap, and Reconstruction, Optimizing for Computational Efficiency
- Chapter 6: Spectrograms: Visualizing Time-Frequency DataWhat Spectrograms Show and How to Read Them, Interpreting Spectrograms for Pattern Recognition, Creating and Customizing Spectrograms
- Chapter 7: Audio Processing ApplicationsMusic Analysis and Feature Extraction, Speech Recognition and Enhancement, Audio Effects and Real-Time Processing
- Chapter 8: Advanced Applications and ExtensionsVibration and Mechanical Signal Analysis, Medical Signal Processing: EEG and ECG, Radar, Sonar, and Geophysical Applications
- Chapter 9: Alternative Time-Frequency MethodsThe Gabor Transform and Gabor Atoms, Wavelet Transform: Adaptive Time-Frequency Analysis, Comparing STFT, Gabor, and Wavelet Approaches
- Chapter 10: Practical Implementation and Code ExamplesImplementing STFT from Scratch, Using Libraries and Frameworks, Debugging, Testing, and Performance Optimization
- ConclusionKey Takeaways and Next Steps, Continuing Your Journey in Signal Processing
- Glossary
- Further Reading and Resources
Introduction
Signal processing stands at the intersection of mathematics, engineering, and practical problem-solving. Every day, you encounter signals that change over time—music streaming through your headphones, speech captured by your smartphone, vibrations in machinery, or electrical activity in the human brain. Understanding these signals requires more than just knowing what frequencies they contain. You need to know when those frequencies occur and how they evolve. This is where the Short Time Fourier Transform becomes indispensable, bridging the gap between pure time-domain analysis and pure frequency-domain analysis.
Traditional Fourier analysis revolutionized signal processing by revealing the frequency components hidden within time-domain signals. However, it operates under a critical assumption: that signals are stationary, meaning their frequency content doesn't change over time. This assumption works beautifully for analyzing pure tones or steady-state signals, but it fails spectacularly when confronted with real-world complexity. A musical performance contains notes that start and stop. Speech consists of phonemes that transition rapidly. Mechanical failures produce transient vibrations that appear suddenly and disappear just as quickly. For these non-stationary signals, classical Fourier analysis provides an incomplete picture, averaging frequency content across the entire signal duration and losing all temporal information.
The Short Time Fourier Transform solves this fundamental limitation by introducing a deceptively simple yet powerful modification: it analyzes signals through a moving window. Instead of transforming an entire signal at once, STFT divides it into short segments, applies the Fourier transform to each segment, and assembles the results into a comprehensive time-frequency representation. This approach preserves both temporal and spectral information, enabling you to see not just what frequencies are present, but precisely when they occur. The resulting visualization—the spectrogram—has become one of the most intuitive and widely used tools in signal processing, appearing in audio editing software, speech recognition systems, medical diagnostics, and countless other applications.
This book guides you through the complete landscape of Short Time Fourier Transform analysis, from mathematical foundations to practical implementation. You'll develop both the theoretical understanding needed to make informed decisions and the practical skills required to apply STFT effectively in your work. Whether you're analyzing audio recordings, processing sensor data, or exploring signal characteristics for research, mastering STFT will fundamentally expand your analytical capabilities. The journey begins with understanding why time-frequency analysis matters, what STFT actually does, and how to navigate the concepts and techniques presented in the chapters ahead.
Why Time-Frequency Analysis Matters
The world of signals exists in two complementary domains: time and frequency. Time-domain representations show how signal amplitude changes moment by moment, revealing when events occur and how quickly they evolve. Frequency-domain representations decompose signals into their constituent frequencies, showing which oscillations are present and their relative strengths. Each perspective offers unique insights, but each also conceals information that the other reveals. Time-frequency analysis emerged from the recognition that many real-world problems require simultaneous access to both perspectives, and that forcing a choice between them unnecessarily limits your analytical power.
Consider the challenge of analyzing a musical recording. In the time domain, you see the waveform—amplitude variations that correspond to sound pressure changes. You can identify when notes begin and end, detect sudden percussive hits, and measure overall loudness. However, you cannot easily determine which pitches are being played or how the harmonic content evolves. Converting to the frequency domain through classical Fourier transform reveals the pitch content beautifully, showing clear peaks at fundamental frequencies and their harmonics. But now you've lost all temporal information. You know a particular note was played somewhere in the recording, but you cannot determine when it started, how long it lasted, or how it relates temporally to other notes.
This limitation becomes critical in numerous practical applications:
- Speech recognition systems must identify phonemes that last only tens of milliseconds, requiring precise temporal localization of frequency patterns
- Medical diagnostics need to detect transient abnormalities in EEG or ECG signals that indicate specific neurological or cardiac events
- Mechanical fault detection relies on identifying brief vibration signatures that appear when bearings fail or gears misalign
- Audio compression algorithms exploit temporal variations in frequency content to achieve efficient encoding without perceptible quality loss
- Radar and sonar systems must track how reflected signals change over time to determine target velocity and trajectory
The fundamental problem is that time and frequency represent complementary aspects of the same underlying phenomenon. A signal is not inherently "in" the time domain or "in" the frequency domain—these are simply different mathematical representations of the same information. The Fourier transform establishes a rigorous mathematical relationship between these representations, but it forces you to choose one or the other. Time-frequency analysis methods like STFT refuse this false dichotomy, instead providing a unified framework that preserves both temporal and spectral information simultaneously.
The practical value of time-frequency analysis extends beyond simply having more information. It fundamentally changes how you can interact with signals. Spectrograms—visual representations of STFT results—enable pattern recognition that would be nearly impossible from either time-domain waveforms or frequency-domain spectra alone. You can visually identify chirps, harmonics, transients, and modulations. You can track how frequency content evolves during speech articulation or musical performance. You can spot anomalies that appear as unexpected patterns in the time-frequency plane. This visual intuition accelerates analysis and makes complex signal behavior accessible even to those without deep mathematical expertise.
Moreover, time-frequency analysis enables signal manipulation techniques that operate on specific time-frequency regions. You can selectively filter out noise that occupies particular time-frequency zones while preserving signal content elsewhere. You can implement time-varying filters that adapt their characteristics based on instantaneous frequency content. You can perform source separation by identifying and extracting components with distinct time-frequency signatures. These capabilities have driven innovations in audio processing, telecommunications, biomedical engineering, and numerous other fields where signals exhibit time-varying behavior.
The importance of time-frequency analysis continues to grow as signal processing applications become more sophisticated. Modern machine learning systems increasingly use spectrograms as input features, treating time-frequency representations as images for convolutional neural networks. Real-time audio processing demands efficient time-frequency methods that can operate with minimal latency. Emerging applications in areas like gravitational wave detection and quantum signal processing require precise time-frequency characterization of extremely weak or exotic signals. Understanding STFT and related time-frequency methods has evolved from a specialized skill to an essential competency for anyone working seriously with signals.
The journey into time-frequency analysis begins with STFT because it represents the most straightforward extension of classical Fourier analysis. It builds directly on concepts you likely already understand—windowing, Fourier transforms, and spectral analysis—combining them in an intuitive way. Once you master STFT, you'll have both a powerful practical tool and a conceptual foundation for understanding more advanced time-frequency methods. The investment in understanding STFT pays dividends across virtually every domain where signals matter, making it one of the most valuable techniques in the signal processing toolkit.
What is the Short Time Fourier Transform?
The Short Time Fourier Transform is a mathematical technique that computes the Fourier transform of a signal over successive short time intervals, creating a two-dimensional representation that shows how frequency content evolves over time. At its core, STFT applies a simple but powerful idea: instead of analyzing an entire signal at once, divide it into overlapping segments using a sliding window function, compute the Fourier transform of each windowed segment, and arrange the results to show both time and frequency information. This approach transforms a one-dimensional time-domain signal into a two-dimensional time-frequency representation where one axis represents time, the other represents frequency, and the values indicate the strength of each frequency component at each time.
The mathematical formulation of STFT can be expressed concisely. For a continuous signal x(t) and a window function w(t), the STFT is defined as:
Here,
STFT{x(t)}(τ, ω) = ∫ x(t) · w(t - τ) · e^(-jωt) dt
τ represents the time position of the window center, ω represents angular frequency, and the window function w(t - τ) isolates a short segment of the signal centered at time τ. The exponential term e^(-jωt) is the complex sinusoid that performs the frequency analysis, exactly as in the classical Fourier transform. The key difference is that the window function localizes the analysis to a specific time region, and by sliding this window across the signal, you build up a complete time-frequency picture.
In discrete implementations—which is how STFT is actually computed in practice—the process becomes more concrete and algorithmic. You start with a digital signal consisting of samples taken at regular intervals. You define a window of specific length, typically containing hundreds to thousands of samples depending on your sampling rate and desired time-frequency resolution. You position this window at the beginning of your signal, multiply the signal samples by the window function values, and compute the Discrete Fourier Transform (usually via the Fast Fourier Transform algorithm) of the windowed segment. This gives you the frequency content at the first time position.
Next, you shift the window forward by a specified number of samples called the hop size or step size. You multiply the signal by the window function again at this new position and compute another FFT. This gives you the frequency content at the second time position. You repeat this process, sliding the window across the entire signal, computing an FFT at each position. The collection of all these FFT results forms a matrix where rows correspond to frequency bins, columns correspond to time frames, and each matrix element contains a complex number representing the magnitude and phase of that frequency component at that time. Taking the magnitude of these complex values and visualizing the result produces the familiar spectrogram.
The window function plays a crucial role in STFT performance. It must smoothly taper to zero at its edges to minimize spectral artifacts caused by abrupt signal truncation. Common choices include the Hann window, Hamming window, and Blackman window, each offering different trade-offs between frequency resolution and spectral leakage. The window length determines the time-frequency resolution trade-off: longer windows provide better frequency resolution but worse time resolution, while shorter windows provide better time resolution but worse frequency resolution. This fundamental trade-off, governed by the Heisenberg uncertainty principle, represents one of the most important concepts you'll need to understand when working with STFT.
The overlap between successive window positions significantly affects STFT quality and computational requirements. Typical overlap values range from 50% to 75%, meaning each new window position advances by only 25% to 50% of the window length. This overlap ensures smooth transitions between time frames and enables accurate signal reconstruction through inverse STFT. Higher overlap improves time resolution and reconstruction quality but increases computational cost proportionally. The choice of overlap percentage depends on your application requirements, available computational resources, and whether you need to reconstruct the signal from its STFT representation.
Understanding what STFT produces is as important as understanding how it works. The output is fundamentally a three-dimensional dataset: time, frequency, and magnitude (or magnitude and phase if you preserve complex values). This data can be visualized as a spectrogram, where time runs along the horizontal axis, frequency along the vertical axis, and magnitude is represented by color intensity or brightness. Bright regions indicate strong frequency components at those times, while dark regions indicate weak or absent components. Patterns in the spectrogram reveal signal structure: horizontal lines indicate sustained tones, vertical lines indicate transients or clicks, curved lines indicate frequency sweeps or chirps, and complex patterns reveal intricate time-varying behavior.
The practical power of STFT lies in its versatility and intuitive interpretation. Unlike more abstract signal processing techniques, STFT results can be directly visualized and understood without extensive mathematical background. You can literally see what's happening in your signal. This visual accessibility has made spectrograms ubiquitous in audio engineering, speech processing, and numerous other fields. At the same time, STFT provides rigorous mathematical properties that enable quantitative analysis, feature extraction, and signal manipulation. It serves equally well as an exploratory tool for understanding unknown signals and as a computational foundation for sophisticated processing algorithms.
How to Use This Book
This book is structured to build your understanding progressively, starting with essential foundations and advancing toward sophisticated applications and implementation techniques. Each chapter focuses on a specific aspect of STFT and time-frequency analysis, with concepts introduced in a logical sequence that minimizes prerequisites while maximizing practical utility. You can read the book linearly from beginning to end for comprehensive coverage, or you can jump to specific chapters that address your immediate needs, using cross-references to fill in any background concepts as necessary.
The journey begins with Fourier Transform Fundamentals (Chapter 1), which reviews the classical Fourier transform concepts that underpin STFT. Even if you're already familiar with Fourier analysis, this chapter is worth reviewing because it specifically highlights the limitations that motivate time-frequency methods. You'll examine why classical Fourier analysis fails for non-stationary signals and understand the conceptual gap that STFT fills. This foundation ensures you appreciate not just how STFT works, but why it's necessary and when it's appropriate.
Chapter 2, Short Time Fourier Transform Principles, introduces the core STFT concept in detail. You'll see how windowing and segmentation enable time-localized frequency analysis, work through the mathematical formulation step by step, and understand the advantages STFT provides over classical approaches. This chapter establishes the conceptual framework you'll use throughout the rest of the book, so take time to ensure you grasp these fundamental ideas before moving forward.
The next two chapters address critical practical considerations. Window Functions and Their Impact (Chapter 3) explores how different window shapes affect your analysis results. You'll learn about common window types, understand the trade-offs they embody, and develop criteria for selecting appropriate windows for different applications. The Time-Frequency Resolution Trade-Off (Chapter 4) tackles one of the most important concepts in time-frequency analysis: the fundamental impossibility of achieving perfect resolution in both time and frequency simultaneously. Understanding this trade-off and learning to make informed decisions about it will dramatically improve your STFT results.
Chapter 5, Implementation Parameters and Optimization, provides practical guidance on the numerous parameters you must set when implementing STFT. Window size, FFT length, hop size, and overlap percentage all interact to determine your results' quality and computational cost. This chapter gives you concrete strategies for choosing these parameters based on your signal characteristics and analysis goals. You'll also learn optimization techniques that improve computational efficiency without sacrificing quality.
Spectrograms: Visualizing Time-Frequency Data (Chapter 6) focuses on the visual representation of STFT results. You'll learn to read and interpret spectrograms, recognize common patterns, and customize visualizations for different purposes. This chapter emphasizes developing visual intuition that accelerates analysis and enables pattern recognition. The ability to quickly interpret spectrograms is one of the most valuable practical skills you'll gain from this book.
Chapters 7 and 8 explore applications across diverse domains. Audio Processing Applications covers music analysis, speech recognition, and audio effects—areas where STFT has become indispensable. Advanced Applications and Extensions examines vibration analysis, medical signal processing, and radar/sonar systems, demonstrating STFT's versatility beyond audio. These chapters include concrete examples and case studies that show how theoretical concepts translate into real-world solutions. You'll see how practitioners in different fields adapt STFT to their specific requirements and constraints.
Chapter 9, Alternative Time-Frequency Methods, broadens your perspective by introducing the Gabor transform and wavelet transform. Understanding these alternatives helps you recognize STFT's strengths and limitations and choose the most appropriate method for each problem. You'll learn when STFT is the best choice and when other approaches might serve you better. This comparative perspective prevents the common mistake of applying STFT universally without considering whether it's truly optimal for your specific situation.
The book concludes with Practical Implementation and Code Examples (Chapter 10), which bridges theory and practice. You'll see how to implement STFT from scratch to understand its inner workings, then learn to use established libraries and frameworks for production work. This chapter includes debugging strategies, testing approaches, and performance optimization techniques that help you build robust, efficient implementations. The code examples use widely available tools and libraries, making the techniques immediately applicable to your projects.
Throughout the book, you'll find several recurring elements designed to enhance learning:
- Concrete examples illustrate abstract concepts with specific scenarios and numerical values
- Visual diagrams complement mathematical descriptions, providing intuitive understanding
- Practical guidelines offer actionable advice for making implementation decisions
- Common pitfalls highlight mistakes to avoid based on real-world experience
- Cross-references connect related concepts across chapters, building a cohesive understanding
To get the most from this book, approach it actively rather than passively. When you encounter mathematical formulations, work through them with pencil and paper. When you see code examples, run them with your own data. When you read about parameter choices, experiment with different values and observe the effects. Time-frequency analysis is fundamentally about developing intuition for how signals behave, and that intuition comes from hands-on experience more than from reading alone. The book provides the framework and guidance, but your engagement with the material determines how deeply you'll understand it.
The supplementary materials—glossary and further reading sections—serve as ongoing references as you apply STFT in your work. The glossary provides quick definitions of technical terms, while the further reading section points you toward resources for deeper exploration of specific topics. Consider these sections as tools to support your continued learning beyond the main chapters. Signal processing is a vast field, and this book aims to give you a solid foundation in STFT while acknowledging that mastery comes from continued study and practice.
Your background and goals will influence how you use this book. If you're a student learning signal processing, work through the chapters sequentially and complete exercises to build systematic understanding. If you're a practitioner facing a specific problem, you might start with the application chapters most relevant to your domain, then backtrack to theoretical chapters as needed. If you're implementing STFT in software, focus on Chapters 5 and 10 while using earlier chapters as reference for understanding the underlying principles. The book's structure accommodates these different approaches while maintaining conceptual coherence.
Finally, remember that mastering STFT is not an end in itself but a means to solving real problems. The ultimate goal is not to memorize formulas or perfectly understand every mathematical nuance, but to develop the judgment and skills needed to apply time-frequency analysis effectively in your work. As you progress through the book, continually connect concepts back to practical applications. Ask yourself how each idea helps you analyze signals better, make more informed decisions, or build more effective systems. This application-oriented mindset will help you retain what you learn and transfer it to new situations you encounter in your professional work.
This is the end of the free sample. The full book has 10 chapters.
Want this book written for you?
Tell us your goals and background, and get your own version of this book, tailored by AI to you.


Benefits of AI-tailored books
- Read one book, not ten:
- all the Digital Signal Processing knowledge you need, gathered into a single book.
- Save days of learning:
- tell us your goals, choose your topics, and the whole book is built around them.
- Learn effortlessly:
- Digital Signal Processing book written for your specific background and expertise.
- Understand at a glance:
- includes charts, tables, timelines, checklists, decision trees, and more.
- Stay current:
- written the day you order it, not years ago.
- Trust what you read:
- every book is checked for accuracy, with real research when your subject needs it.
Create your unique book in 3 steps
- 1. Select your focus
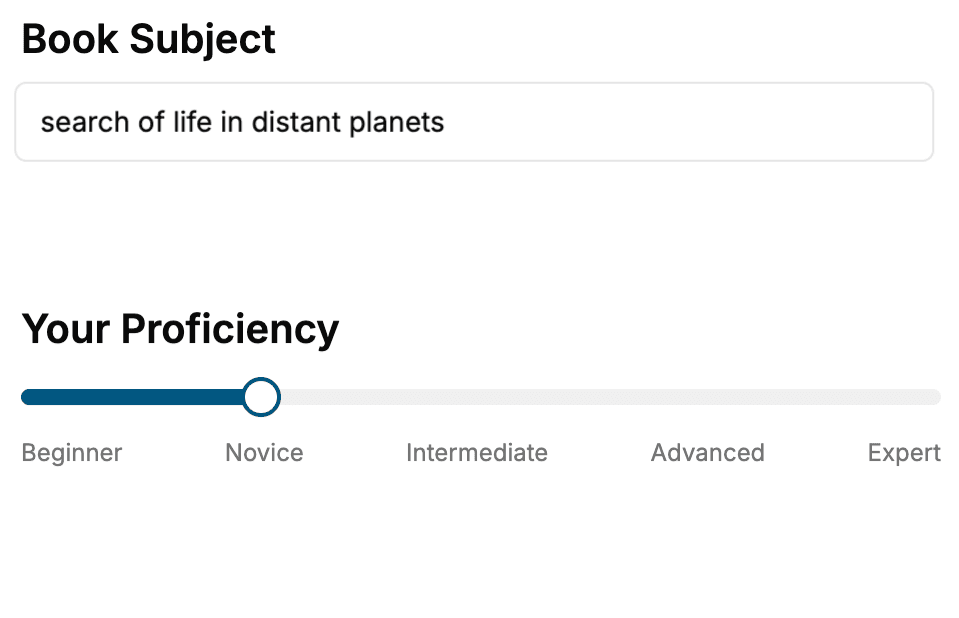
Select the focus of your Digital Signal Processing book and share your background
- 2. Personalize your book
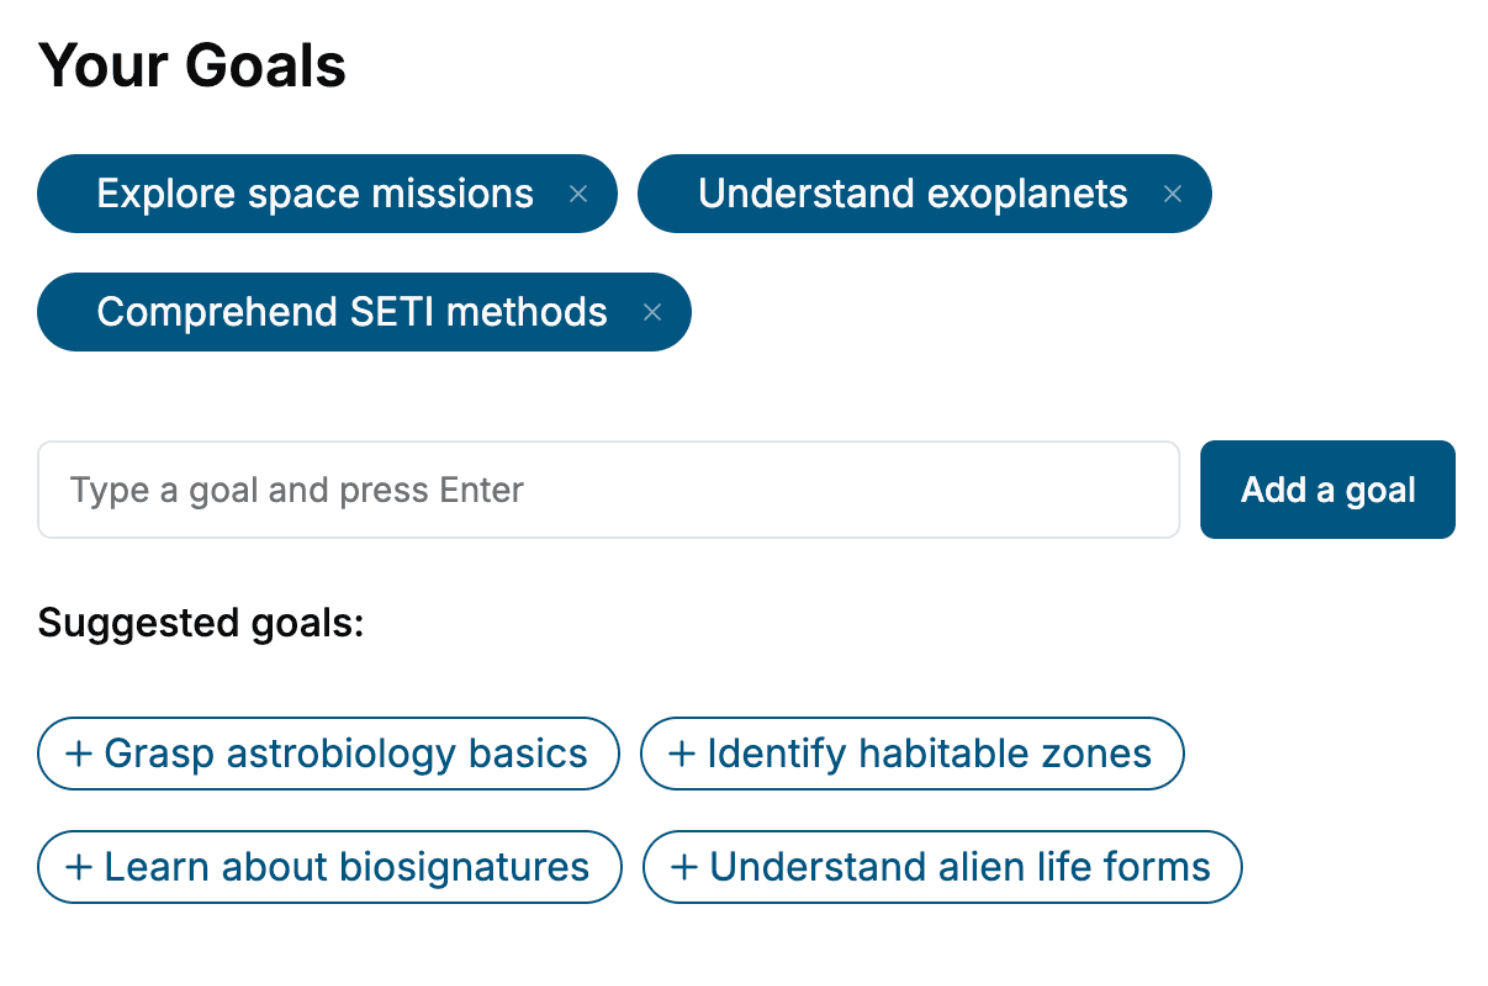
Specify your goals and choose sub-topics to include
- 3. Get your tailored book
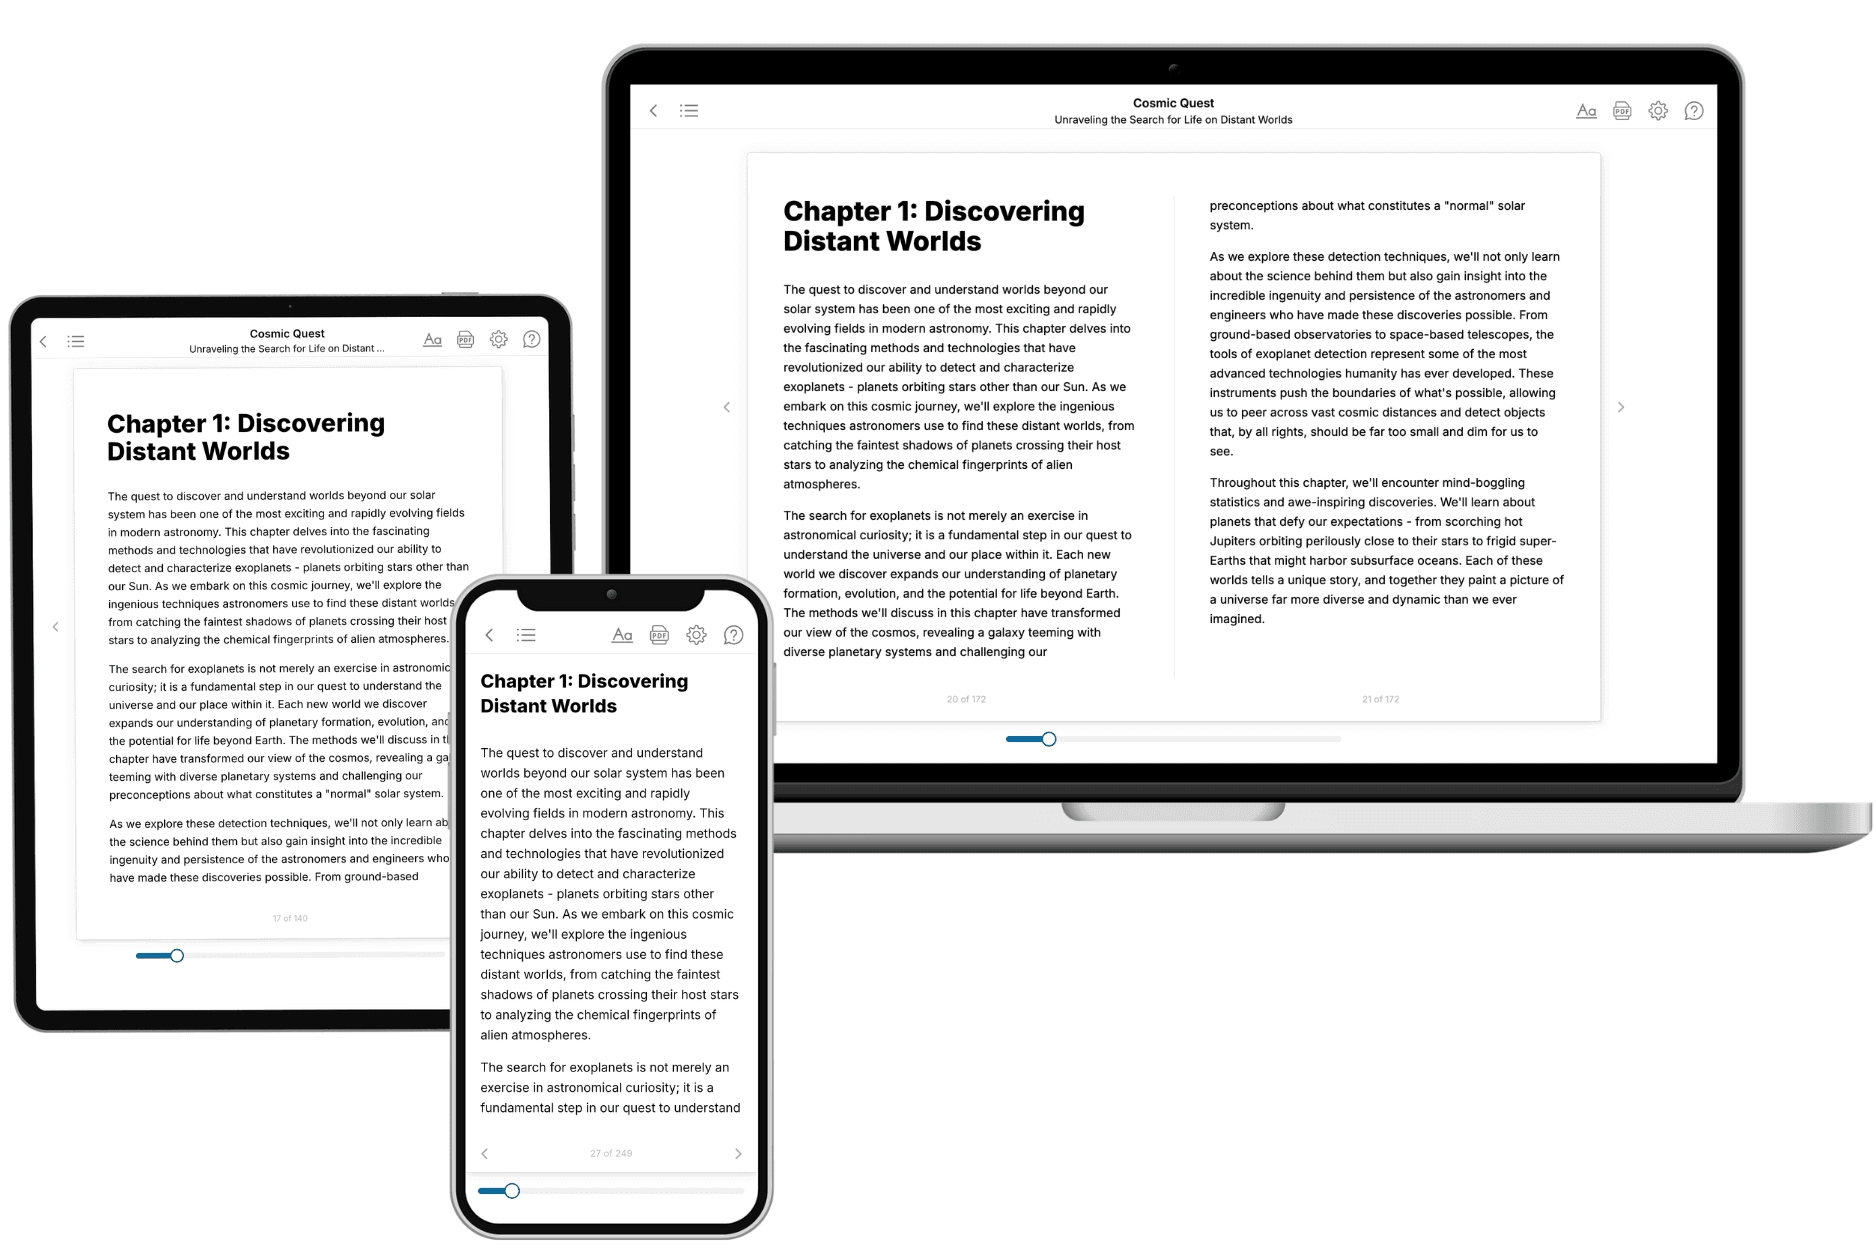
Your book is ready in 10 minutes. Read it online, download as EPUB or PDF, or send to Kindle.
Frequently asked questions
- What is TailoredRead?
TailoredRead creates complete, full-length nonfiction ebooks, written specifically for you. Tell us what you want to learn and why, and TailoredRead writes you a complete ebook on it, with charts, tables, and diagrams throughout. Read it online, on Kindle, or on any e-reader, or download it as a PDF or EPUB. Every book is written fresh the day you order it.
- How is the book tailored to me?
Before anything is written, you answer a few short questions about your goals, your background, and the topics you care about. Your book is then planned around your answers: written at your level, focused on your goals, and covering the topics you chose, instead of the one-size-fits-all book a store sells everyone.
- Will it read like generic AI content?
No. Your book isn't a chat transcript: it's planned chapter by chapter before a single word is written, told in a clear book voice, and explains ideas visually with charts, tables, and diagrams. After writing, every book goes through an editorial pass that polishes chapters so the book reads consistent from start to finish. Judge for yourself: browse thousands of sample books on our Explore Books page.
- How accurate is the content?
Our AI first checks whether your subject needs live research. Niche and fast-moving subjects are researched before writing, and the book plan and chapters are grounded in what it finds. After writing, every book goes through a quality pass that checks its facts and consistency, and researched books list their sources in a Notes section at the back.
- How long is the book?
You choose the length: Comprehensive (250-300 pages), Detailed (150-200 pages), Essential (70-100 pages), or Short (30-50 pages).
- Does the book include visuals?
Yes. Every book includes charts, tables, and diagrams: timelines, checklists, step-by-step guides, decision trees, comparison tables, matrices, and bar charts. A typical book includes dozens of these visual elements.
- Can I read it on Kindle? What formats can I download?
Yes. Every book can be read in our online reader or downloaded as a PDF or EPUB. The EPUB can be opened with Kindle, Apple Books, Kobo, and any e-reader. The Commercial and Author licenses also include an editable Word (DOCX) and Markdown download.
- How much does it cost?
About the price of a regular ebook. The exact price depends on your book's length and complexity, from $2 for the shortest books to $35 for the most comprehensive, and it's shown when you review your book, before you commit to anything. Each book is a one-time purchase, yours to keep, no subscription. Licenses that let you share, teach, or publish your book range from $35.99 to $49.99.
- Can I preview the book before purchasing?
Before you pay, you'll see what your book will cover: the title, a detailed description, the estimated length, and the complete chapter-by-chapter table of contents, so you know what you're getting before you decide. The full text itself is written after you purchase.
- How long does it take to create a book?
About 10 minutes. You can start reading the opening chapters while the rest is still being written.