Median Absolute Deviation
Master Robust Statistical Measurement and Variance Reduction Techniques
Discover how Median Absolute Deviation transforms your statistical analysis by providing unparalleled robustness against outliers and data anomalies.
222 pages10 chaptersAug 10, 2026Statistics
About this book
This comprehensive guide takes you beyond standard deviation to master a statistical measure that remains stable even when your data contains extreme values or unexpected patterns. You'll learn the mathematical principles underlying MAD, explore its practical advantages in variance reduction, and discover how to implement it across diverse analytical scenarios—from quality control and financial risk assessment to machine learning and environmental monitoring. With clear explanations, practical examples, and step-by-step applications, this book equips you with the knowledge to choose the right dispersion measure for your specific challenges and leverage MAD's unique properties to improve your analytical accuracy and decision-making confidence.
Table of contents
- IntroductionWhy Robust Statistical Measures Matter, Limitations of Standard Deviation, Your Journey Through This BookRead below
- Chapter 1: Foundations of Statistical DispersionUnderstanding Data Spread and Variability, Common Dispersion Measures: Range, Variance, and Standard Deviation, How Outliers Distort Traditional Measures, The Concept of Robustness in Statistics
- Chapter 2: Median Absolute Deviation FundamentalsDefining Median Absolute Deviation, Step-by-Step Calculation Process, Mathematical Properties and Characteristics, MAD Compared to Standard Deviation
- Chapter 3: Robustness and Advantages of MADResistance to Outliers and Extreme Values, Independence from Distribution Shape, Interpretability and Practical Meaning, Computational Efficiency and Scalability
- Chapter 4: Variance Reduction Theory and TechniquesFundamentals of Variance Reduction, How MAD Contributes to Variance Reduction, Improving Estimation Accuracy Through Robust Measures, Understanding the Bias-Variance Tradeoff
- Chapter 5: MAD in Quality Control and Process MonitoringQuality Control Fundamentals, Building Robust Control Charts with MAD, Detecting Process Anomalies and Deviations
- Chapter 6: MAD in Financial Analysis and Risk AssessmentMeasuring Financial Volatility Robustly, Risk Assessment with Outlier-Resistant Measures, Portfolio Analysis and Diversification
- Chapter 7: MAD in Machine Learning and Data ScienceRobust Feature Scaling and Normalization, Outlier Detection in Machine Learning Pipelines, Improving Model Robustness and Generalization
- Chapter 8: Practical Implementation and ComputationEfficient Computational Methods, Using Statistical Software and Programming Languages, Worked Examples and Case Studies
- Chapter 9: Interpretation, Reporting, and CommunicationInterpreting MAD Results Correctly, Communicating Statistical Findings to Stakeholders, Avoiding Common Misinterpretations and Pitfalls
- Chapter 10: Advanced Topics and ExtensionsMultivariate Extensions of MAD, Weighted and Modified MAD Approaches, MAD in Hypothesis Testing and Confidence Intervals
- ConclusionKey Takeaways and Summary, Future Applications and Emerging Trends
- Glossary of Terms
- Further Reading and Resources
Introduction
A single data point can quietly wreck an entire analysis. Consider a quality engineer reviewing daily production output across a factory floor. Ninety-nine units roll off the line with minor, predictable variation. One unit, due to a sensor malfunction, records an output value ten times the normal range. When the engineer calculates the standard deviation for that day, the number balloons. Control limits shift. Alerts fire. Decisions get made based on a distortion, not a signal. The problem is not the data. The problem is the measure used to summarize it.
This scenario plays out constantly across industries. Financial analysts see it when a single market crash skews months of volatility estimates. Environmental scientists encounter it when a faulty sensor reading inflates pollution variance. Machine learning engineers run into it when a handful of extreme feature values destabilize model training. In each case, the underlying question is the same: how do you measure spread in a dataset when some values cannot be trusted to behave? The answer, more often than analysts realize, is the Median Absolute Deviation.
The Median Absolute Deviation, commonly abbreviated as MAD, is a measure of statistical dispersion that centers its calculation on the median rather than the mean. Because the median is itself resistant to extreme values, MAD inherits that resistance. An outlier that would dramatically inflate a standard deviation barely moves a MAD estimate. This property, known as robustness, is not a minor technical footnote. It is the difference between an analysis that reflects reality and one that reflects noise. Understanding when and why to use MAD, and how to apply it correctly, is the central purpose of this book.
This introduction sets the stage for everything that follows. It explains why robust statistical measures have become increasingly important as data grows messier and more complex. It examines the specific ways that standard deviation and variance break down under real-world conditions. And it maps out the journey ahead, so you can navigate the material with a clear sense of where each concept fits and how the pieces connect.
Why Robust Statistical Measures Matter
Statistics was largely developed under idealized assumptions. Early theorists worked with datasets that were small, carefully collected, and often drawn from natural phenomena that genuinely followed bell-shaped distributions. In that world, the mean and standard deviation were excellent summaries. They captured the center and spread of data efficiently, and the math behind them was elegant and tractable. The problem is that most modern data does not live in that world.
Real datasets are messy. They contain measurement errors, recording mistakes, sensor glitches, and genuine extreme events that are not errors at all but simply rare occurrences. Financial return series are a classic example. Stock prices occasionally drop or spike by amounts that would be essentially impossible under a normal distribution, yet these events happen regularly enough to matter enormously for risk management.[1] When a statistical measure cannot handle these extremes gracefully, the resulting estimates mislead rather than inform.
Robust statistical measures are designed specifically to remain reliable when data deviates from ideal conditions. The term robust has a precise technical meaning in statistics: a measure is robust if its value does not change dramatically when a small fraction of the data is replaced by arbitrary values. This property is quantified through the breakdown point, which represents the proportion of contaminated data a measure can tolerate before its estimate becomes unreliable. The mean has a breakdown point of essentially zero, because a single extreme value can shift it arbitrarily far. The median, by contrast, has a breakdown point of 50%, meaning nearly half the data can be corrupted before the median becomes meaningless.
MAD inherits the median's high breakdown point. This makes it one of the most robust dispersion measures available in standard statistical practice. To put this concretely: imagine a dataset of 100 salary figures from a company. If 49 of those salaries are replaced with arbitrarily large numbers, the median salary barely moves, and so does the MAD. The standard deviation, meanwhile, would be completely dominated by those 49 inflated values. For any analyst working with data that might contain contamination, this difference is not academic. It is operationally critical.
The growing importance of robust measures also reflects a broader shift in how data is collected and used. Automated sensors, web scraping, user-generated content, and high-frequency trading systems all produce data at scales and speeds that make manual quality control impossible. Outliers are not exceptions in these environments. They are a routine feature of the data landscape. Analytical methods that assume clean, well-behaved data are increasingly mismatched to the problems they are meant to solve.
Robust measures like MAD do not eliminate the need for careful data management. They do, however, provide a layer of protection that allows analysis to proceed meaningfully even when the data is imperfect. Think of it as the difference between a car with no suspension and one with good shock absorbers. Both will get you down the road, but only one handles the bumps without losing control. Robust statistics is the shock absorber for real-world data analysis.
Beyond their defensive properties, robust measures also serve an important diagnostic function. When the MAD and the standard deviation tell very different stories about the same dataset, that divergence is itself informative. It signals that outliers are present and that they are influencing the standard deviation significantly. This comparison becomes a quick, practical tool for flagging data quality issues before they propagate into downstream decisions.
Limitations of Standard Deviation
Standard deviation is the most widely taught and widely used measure of dispersion in statistics. Its dominance is understandable. It connects naturally to the normal distribution, it has well-understood mathematical properties, and it integrates cleanly into a vast ecosystem of statistical tests and models. For datasets that genuinely follow a normal distribution and contain no serious outliers, standard deviation performs exactly as advertised. The trouble begins when those conditions are not met, which is more often than most analysts assume.
The core vulnerability of standard deviation lies in how it is calculated. Each data point's deviation from the mean is squared before being averaged. Squaring has a dramatic amplifying effect on large deviations. A value that sits 10 units from the mean contributes 100 to the sum of squared deviations. A value that sits 100 units from the mean contributes 10,000. This means that a single extreme value can dominate the entire calculation, producing a standard deviation that reflects the outlier far more than it reflects the typical spread of the data.
Consider this concrete example. A dataset of seven values: 10, 11, 12, 13, 14, 15, and 200. The standard deviation of this dataset is approximately 69.6. But remove the value 200, and the standard deviation of the remaining six values drops to about 1.9. One data point inflated the dispersion estimate by a factor of roughly 37. Any analysis built on that inflated standard deviation would be fundamentally misleading.
This sensitivity to extreme values is not just a theoretical concern. In quality control, a single miscalibrated measurement can cause standard-deviation-based control limits to widen so much that genuine process problems go undetected. In finance, a single day of extreme market movement can inflate volatility estimates enough to distort risk models for weeks afterward. In machine learning, features with high standard deviations driven by outliers can cause gradient-based optimization algorithms to behave erratically, slowing training and degrading model performance.
Standard deviation also carries an implicit assumption about the shape of the underlying distribution. Many of its most useful properties, including its relationship to confidence intervals and hypothesis tests, rely on the data being approximately normally distributed. When data is heavily skewed, multimodal, or drawn from a distribution with fat tails, the standard deviation can be a poor summary of spread even in the absence of obvious outliers. The distribution-free property of MAD, by contrast, means it does not depend on any particular distributional assumption to be meaningful.
Another limitation of standard deviation is its sensitivity to the mean itself. Because standard deviation measures deviations from the mean, any factor that distorts the mean also distorts the standard deviation. In skewed distributions, the mean is pulled toward the tail, and the standard deviation follows. This creates a compounding effect where both the center and the spread estimates are simultaneously biased by the same underlying distributional feature. MAD sidesteps this problem entirely by anchoring to the median, which is not pulled by skewness in the same way.
None of this means standard deviation should be abandoned. For normally distributed data without serious contamination, it remains an efficient and informative measure. The point is that standard deviation has specific conditions under which it works well, and those conditions are frequently violated in practice. Knowing when to reach for a more robust alternative is a mark of statistical maturity. The chapters ahead on the mathematical foundations of MAD and its structural resistance to outliers will make this distinction precise and actionable.
There is also a subtler issue worth naming here. Standard deviation is so deeply embedded in statistical education and practice that many analysts apply it reflexively, without asking whether it is appropriate for their specific data. This reflexive application is not a character flaw. It is a natural consequence of how statistics is typically taught. But it does mean that a significant amount of published analysis, across fields from medicine to economics to engineering, may be resting on dispersion estimates that are more fragile than they appear. Developing fluency with robust alternatives is not just a technical upgrade. It is a form of analytical integrity.
Your Journey Through This Book
This book is organized to build understanding progressively, starting from foundational concepts and moving toward advanced applications and extensions. Each chapter is designed to stand on its own as a reference, but the sequence is deliberate. The early chapters establish the conceptual and mathematical groundwork that makes the later applied chapters genuinely useful rather than just procedural.
The first chapter establishes the broader context of statistical dispersion. Before diving into MAD specifically, it is worth understanding the full landscape of dispersion measures, why they exist, and what each one is trying to capture. That chapter covers the range, variance, and standard deviation in enough depth to make their limitations concrete, and it introduces the concept of robustness as a formal property rather than a vague preference.
The second chapter gets into the mechanics of MAD itself. It defines the measure precisely, walks through the calculation step by step, and examines its mathematical properties in detail. If you want to understand not just how to compute MAD but why it behaves the way it does, that chapter provides the foundation. It also introduces the MAD scaling constant, which is the adjustment needed to make MAD comparable to standard deviation under normal distribution assumptions.
From there, the book moves into the theoretical advantages of MAD, including its high breakdown point, its influence function, and its distribution-free property. These concepts explain, in precise terms, why MAD is resistant to outliers and why that resistance matters across different types of data. The chapter on variance reduction theory then connects MAD to the broader statistical goal of producing estimates that are both accurate and stable, exploring the bias-variance tradeoff and how robust measures navigate it.
The applied chapters cover three major domains where MAD has proven particularly valuable:
- Quality control and process monitoring: Building robust control charts with MAD-based control limits, detecting process anomalies, and maintaining reliable monitoring even when occasional measurement errors occur.
- Financial analysis and risk assessment: Measuring financial volatility robustly, constructing outlier-resistant risk estimates, and applying MAD to portfolio analysis in markets where extreme events are a regular feature.
- Machine learning and data science: Using MAD for robust feature scaling, building outlier detection pipelines, and improving model generalization by reducing the influence of extreme training examples.
The implementation chapter translates theory into practice. It covers efficient computational methods for calculating MAD at scale, demonstrates how to use MAD in major statistical software environments and programming languages, and works through complete numerical examples from start to finish. Whether you are working in Python, R, or another environment, that chapter provides the practical scaffolding to move from concept to code.
Interpretation and communication are covered in their own dedicated chapter, because computing a statistic correctly is only half the job. Knowing how to read MAD results, how to explain them to non-technical stakeholders, and how to avoid the most common misreadings is equally important. This chapter addresses the practical communication challenges that arise when introducing a less familiar measure into an organization or report.
The final technical chapter extends MAD into more advanced territory. It covers multivariate MAD for datasets with multiple variables, weighted MAD for situations where some observations should carry more influence than others, and the use of MAD in formal inferential frameworks including hypothesis testing and confidence intervals. These extensions are relevant for analysts who need to push beyond the univariate case or who work in research contexts where formal inference is required.
Throughout the book, the emphasis is on practical understanding rather than mathematical formalism for its own sake. Equations appear where they clarify, not where they intimidate. Every major concept is grounded in a concrete example drawn from a realistic analytical scenario. The goal is not to make you a theoretical statistician but to make you a more capable, more discerning analyst who knows when MAD is the right tool, how to apply it correctly, and how to interpret and communicate what it reveals.
A few things to keep in mind as you work through the material. First, MAD is not a replacement for standard deviation in all situations. The book is explicit about when each measure is appropriate and why. Second, the concepts build on each other. The discussion of the bias-variance tradeoff in the variance reduction chapter, for example, will make much more sense after reading the chapter on MAD's mathematical properties. Third, the worked examples are not decorative. They are the primary vehicle for turning abstract ideas into usable knowledge. Engaging with them actively, rather than skimming past them, will make a significant difference in how much you retain.
By the end of this book, you will have a clear, working understanding of what Median Absolute Deviation is, why it behaves the way it does, and how to apply it across a range of real analytical problems. More broadly, you will have a sharper sense of what robustness means in statistical practice and why it matters for the quality of decisions that rest on data. That sharper sense is what separates analysis that holds up under scrutiny from analysis that quietly falls apart when the data gets difficult.
Notes
Introduction
- 1. Nassim Nicholas Taleb, The Black Swan, Random House, 2007
This is the end of the free sample. The full book has 10 chapters.
Want this book written for you?
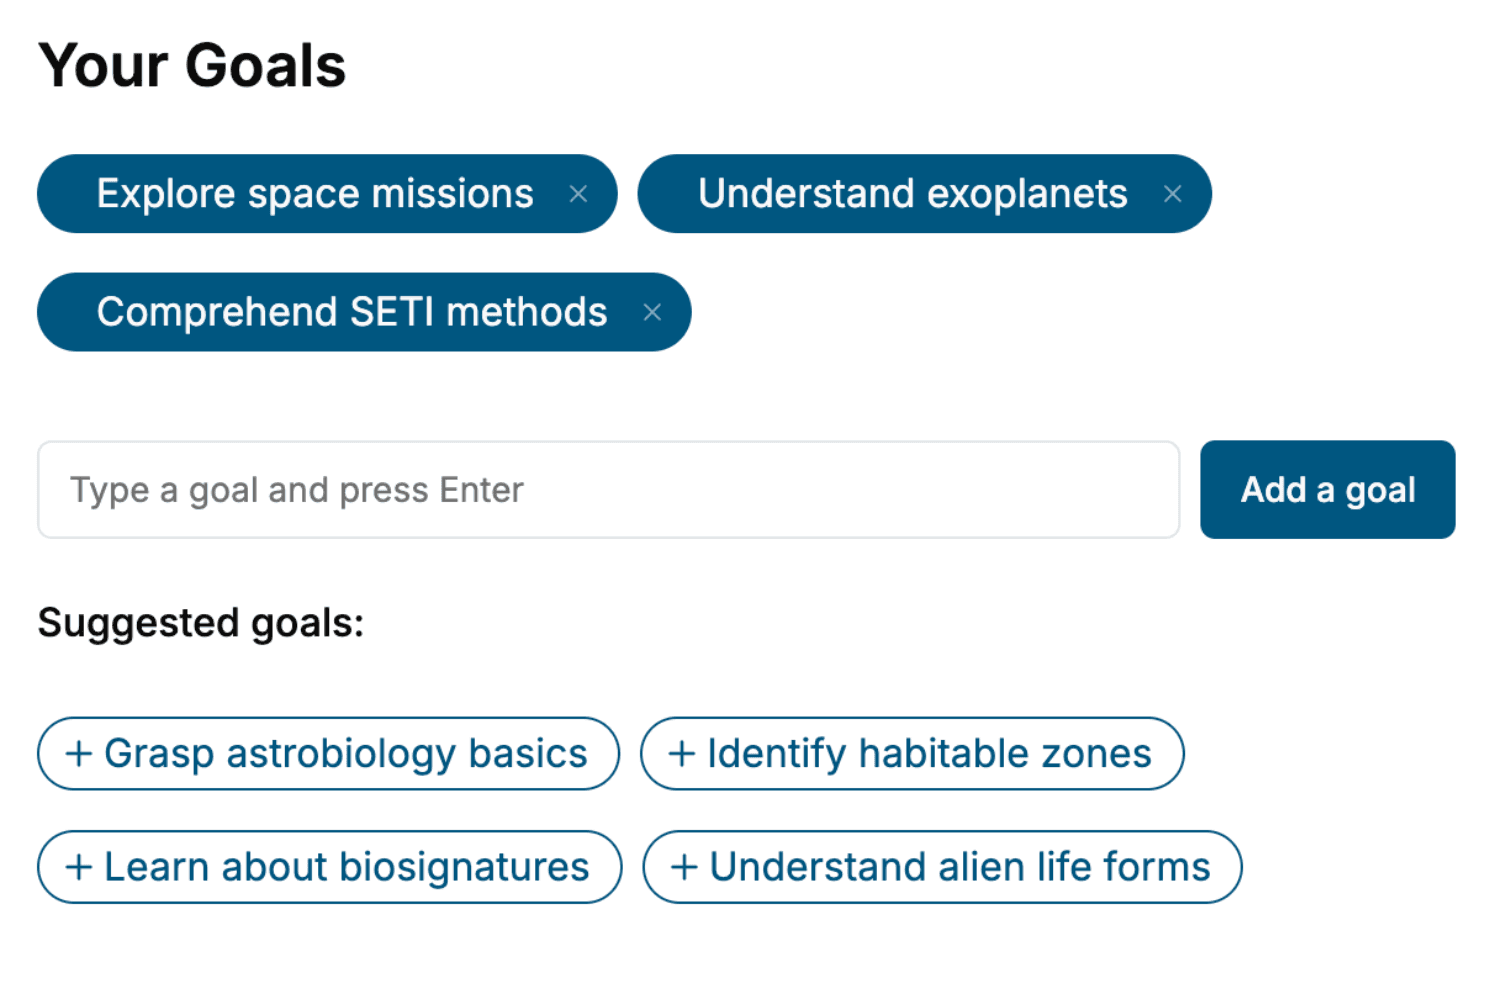
Tell us your goals and background, and get your own version of this book, tailored by AI to you.


Benefits of AI-tailored books
- Read one book, not ten:
- all the Statistics knowledge you need, gathered into a single book.
- Save days of learning:
- tell us your goals, choose your topics, and the whole book is built around them.
- Learn effortlessly:
- Statistics book written for your specific background and expertise.
- Understand at a glance:
- includes charts, tables, timelines, checklists, decision trees, and more.
- Stay current:
- written the day you order it, not years ago.
- Trust what you read:
- every book is checked for accuracy, with real research when your subject needs it.
Create your unique book in 3 steps
- 1. Select your focus
Select the focus of your Statistics book and share your background
- 2. Personalize your book
Specify your goals and choose sub-topics to include
- 3. Get your tailored book
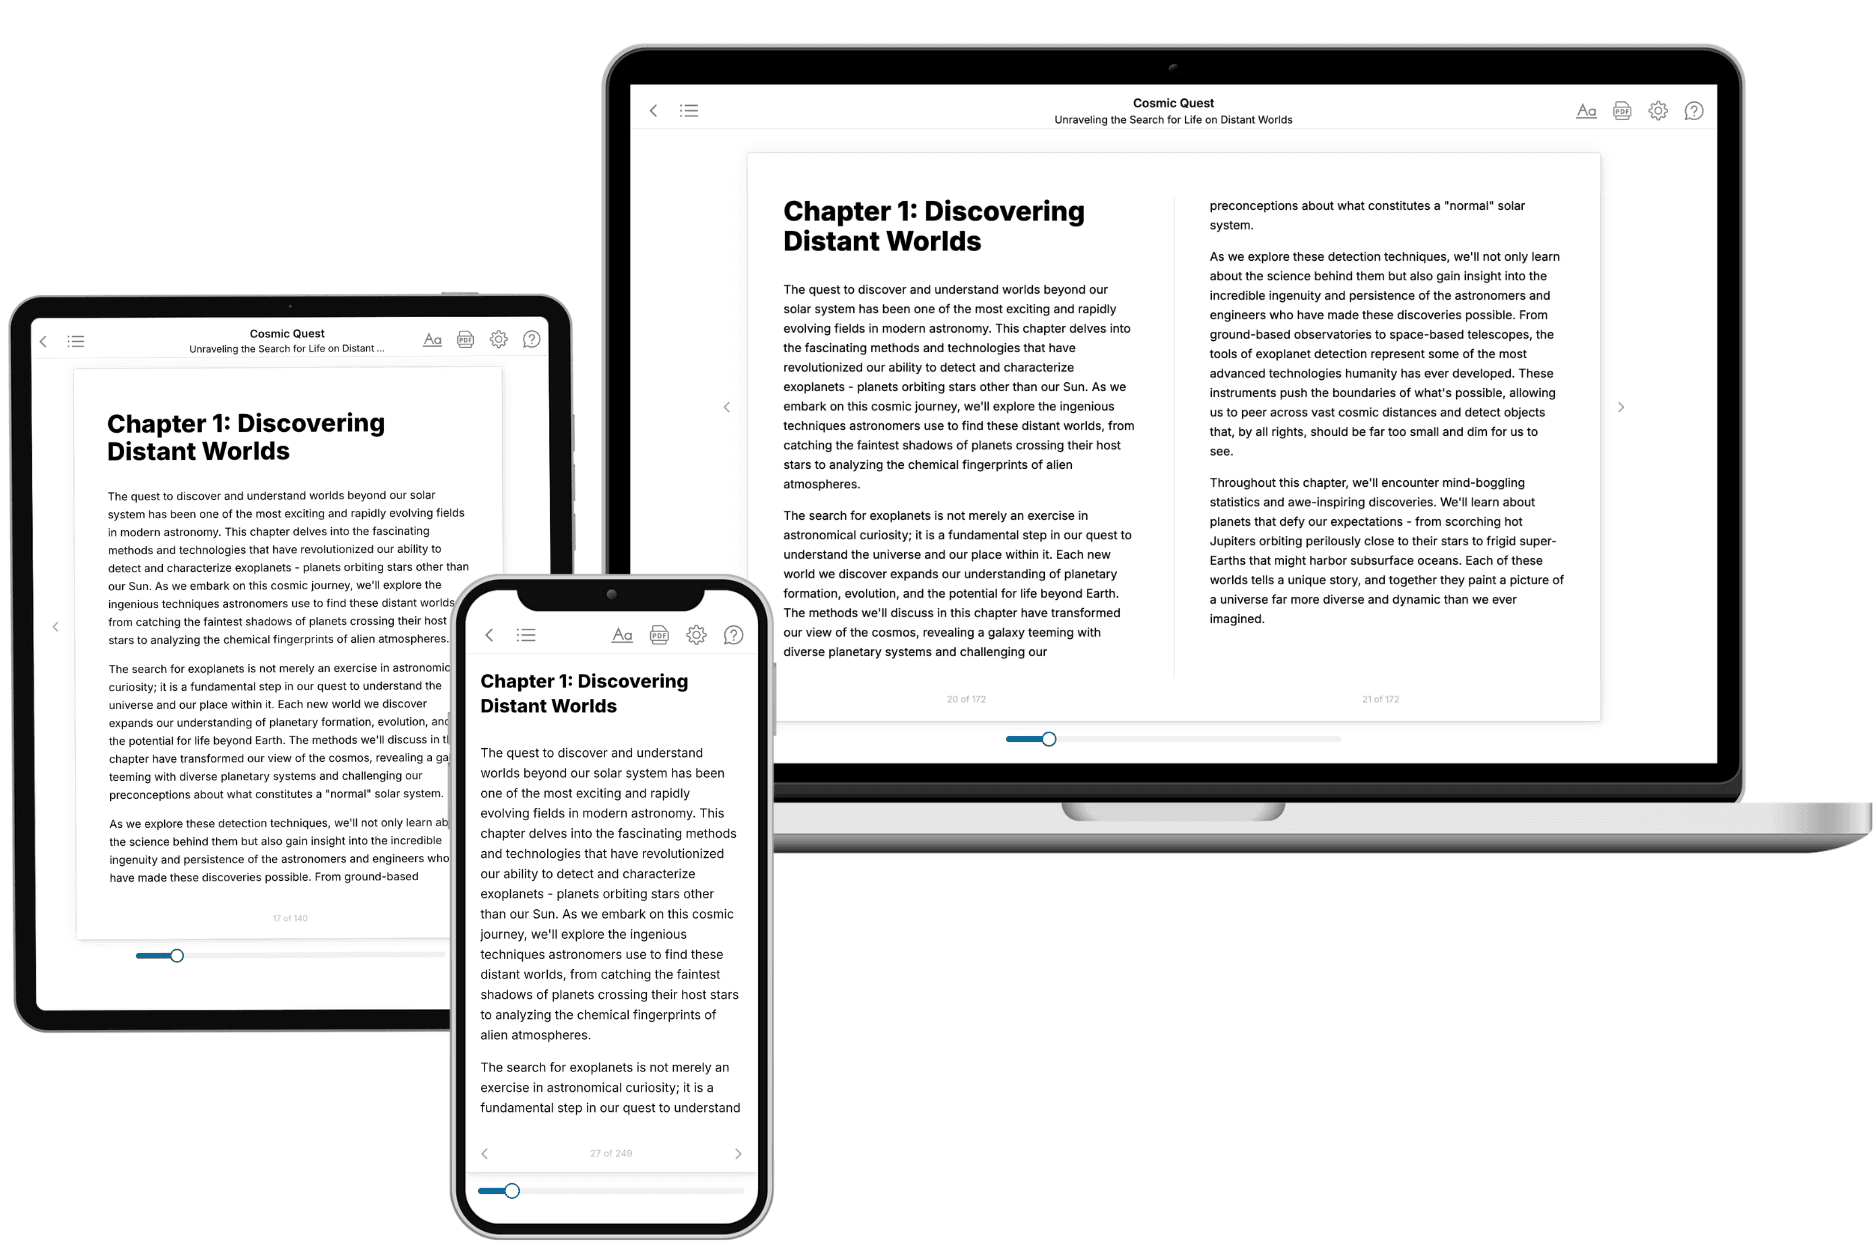
Your book is ready in 10 minutes. Read it online, download as EPUB or PDF, or send to Kindle.

Frequently asked questions
- What is TailoredRead?
TailoredRead creates complete, full-length nonfiction ebooks, written specifically for you. Tell us what you want to learn and why, and TailoredRead writes you a complete ebook on it, with charts, tables, and diagrams throughout. Read it online, on Kindle, or on any e-reader, or download it as a PDF or EPUB. Every book is written fresh the day you order it.
- How is the book tailored to me?
Before anything is written, you answer a few short questions about your goals, your background, and the topics you care about. Your book is then planned around your answers: written at your level, focused on your goals, and covering the topics you chose, instead of the one-size-fits-all book a store sells everyone.
- Will it read like generic AI content?
No. Your book isn't a chat transcript: it's planned chapter by chapter before a single word is written, told in a clear book voice, and explains ideas visually with charts, tables, and diagrams. After writing, every book goes through an editorial pass that polishes chapters so the book reads consistent from start to finish. Judge for yourself: browse thousands of sample books on our Explore Books page.
- How accurate is the content?
Our AI first checks whether your subject needs live research. Niche and fast-moving subjects are researched before writing, and the book plan and chapters are grounded in what it finds. After writing, every book goes through a quality pass that checks its facts and consistency, and researched books list their sources in a Notes section at the back.
- How long is the book?
You choose the length: Comprehensive (250-300 pages), Detailed (150-200 pages), Essential (70-100 pages), or Short (30-50 pages).
- Does the book include visuals?
Yes. Every book includes charts, tables, and diagrams: timelines, checklists, step-by-step guides, decision trees, comparison tables, matrices, and bar charts. A typical book includes dozens of these visual elements.
- Can I read it on Kindle? What formats can I download?
Yes. Every book can be read in our online reader or downloaded as a PDF or EPUB. The EPUB can be opened with Kindle, Apple Books, Kobo, and any e-reader. The Commercial and Author licenses also include an editable Word (DOCX) and Markdown download.
- How much does it cost?
About the price of a regular ebook. The exact price depends on your book's length and complexity, from $2 for the shortest books to $35 for the most comprehensive, and it's shown when you review your book, before you commit to anything. Each book is a one-time purchase, yours to keep, no subscription. Licenses that let you share, teach, or publish your book range from $35.99 to $49.99.
- Can I preview the book before purchasing?
Before you pay, you'll see what your book will cover: the title, a detailed description, the estimated length, and the complete chapter-by-chapter table of contents, so you know what you're getting before you decide. The full text itself is written after you purchase.
- How long does it take to create a book?
About 10 minutes. You can start reading the opening chapters while the rest is still being written.