Multilevel Modeling Essentials
Master Hierarchical Data Analysis and Build Powerful Statistical Models
Analyze hierarchical data with confidence and precision.
191 pages9 chaptersMay 29, 2026Statistics
About this book
Multilevel modeling is essential when your data has a natural structure—students within schools, patients within hospitals, or measurements within individuals. This book guides you through the complete process of building, interpreting, and validating multilevel models. You'll learn why traditional regression fails with nested data, how to structure models that respect your data's hierarchy, and how to extract meaningful insights from complex statistical results. With practical examples and step-by-step explanations, you'll master the core concepts of fixed and random effects, understand when and how to use multilevel approaches, and develop the skills to implement these models in real-world research. Whether you're analyzing educational outcomes, medical data, or organizational metrics, this book provides the knowledge and tools you need to conduct rigorous, accurate statistical analysis.
Table of contents
- IntroductionWhy Multilevel Modeling Matters, Understanding Hierarchical Data Structures, How to Use This Book, What You Need to Know Before StartingRead below
- Chapter 1: The Problem with Traditional RegressionWhen Standard Assumptions Break Down, The Consequences of Ignoring Nesting, Real-World Examples of Hierarchical Data
- Chapter 2: Foundations of Multilevel ThinkingDefining Levels in Your Data, Decomposing Variance Across Levels, Introducing the Intraclass Correlation
- Chapter 3: Fixed and Random Effects ExplainedUnderstanding Fixed Effects, Understanding Random Effects, Combining Fixed and Random Effects
- Chapter 4: Building Your First Multilevel ModelStarting with the Unconditional Model, Adding Level-1 Predictors, Incorporating Level-2 Predictors
- Chapter 5: Model Specification and EstimationRandom Slopes and Cross-Level Interactions, Maximum Likelihood and Bayesian Estimation, Comparing Competing Models
- Chapter 6: Interpreting Multilevel ResultsMaking Sense of Coefficients, Understanding Variance Components, Generating Predictions and Confidence Intervals
- Chapter 7: Assumptions and DiagnosticsKey Assumptions in Multilevel Models, Diagnostic Plots and Tests, Sensitivity Analysis and Robustness Checks
- Chapter 8: Practical Implementation in SoftwareBuilding Models in R, Building Models in Stata, Choosing the Right Tool for Your Analysis
- Chapter 9: Advanced Topics and ExtensionsThree-Level and Higher Models, Nonlinear Multilevel Models, Multilevel Models for Longitudinal Data
- ConclusionKey Takeaways and Next Steps, Resources for Continued Learning
- Appendix: Quick Reference GuideCommon Model Syntax Across Software, Quick Interpretation Guide
Introduction
Data rarely arrives in a neat, flat structure. Students sit inside classrooms, classrooms belong to schools, and schools operate within districts. Patients receive care from specific doctors, who practice within particular hospitals, which serve distinct communities. Employees work within teams, teams exist inside departments, and departments function within organizations. This layered, nested reality is not a statistical inconvenience to be ignored. It is a fundamental feature of how the world is organized, and any analysis that pretends otherwise risks producing conclusions that are misleading at best and dangerously wrong at worst.
Multilevel modeling is the statistical framework built specifically to handle this kind of data. Also called hierarchical linear modeling, mixed-effects modeling, or random-effects modeling depending on the field and software you use, it provides a principled way to analyze data where observations are grouped within higher-level units. Rather than forcing nested data into a flat regression framework and hoping for the best, multilevel models explicitly account for the structure of your data. They allow you to ask questions at multiple levels simultaneously, and they produce estimates that are statistically valid in ways that traditional approaches simply cannot match when data is grouped.
This book is written for researchers and practitioners who already have a working knowledge of regression and basic statistics, but who now face data that has a hierarchical structure and need a reliable, practical guide to analyzing it correctly. The goal is not to overwhelm you with mathematical derivations or abstract theory. The goal is to give you a clear, grounded understanding of what multilevel models are, why they matter, how to build them step by step, and how to interpret and communicate what they tell you. By the time you finish, you will have the conceptual foundation and practical skills to apply multilevel modeling confidently in your own work.
Throughout the chapters ahead, you will encounter real examples drawn from education, medicine, organizational research, and longitudinal studies. These examples are not decorative. They are the backbone of the explanations, because multilevel modeling is best understood through the concrete problems it solves. You will also find code examples in R and Stata, diagnostic guidance, and interpretation frameworks that you can apply directly to your own datasets. The emphasis throughout is on doing the work correctly and understanding what the results actually mean.
Why Multilevel Modeling Matters
The most immediate reason multilevel modeling matters is a statistical problem called non-independence. Standard regression assumes that every observation in your dataset is independent of every other observation. When data is nested, that assumption is violated. Two students from the same classroom are more similar to each other than two students drawn randomly from different schools, simply because they share a teacher, a curriculum, a physical environment, and countless other influences. Ignoring this similarity does not make it disappear. It just means your model is pretending it does not exist, which leads to underestimated standard errors and inflated Type I error rates.[1]
To put that in practical terms: if you run a standard regression on nested data and find a statistically significant effect, there is a real chance that result is a false positive. Your standard errors are too small, your confidence intervals are too narrow, and your p-values are too low. Researchers have documented this problem extensively across fields. A well-known simulation study found that ignoring clustering in educational data can inflate Type I error rates to well above 25%, compared to the nominal 5% threshold, even with modest levels of clustering.[2] That is not a minor technical quibble. That is a fundamental threat to the validity of your conclusions.
Beyond fixing a statistical problem, multilevel modeling opens up genuinely new research questions. Consider a study of student achievement. A flat regression can tell you whether a student's socioeconomic status predicts their test scores. A multilevel model can do that and also tell you whether the relationship between socioeconomic status and achievement varies across schools, and whether school-level characteristics like funding or class size explain that variation. These are richer, more realistic questions, and they require a model that can operate at multiple levels simultaneously.
Multilevel models also handle unbalanced designs gracefully. In real research, groups rarely have the same number of observations. Some schools have 200 students in your dataset; others have 15. Standard approaches either ignore this imbalance or handle it clumsily. Multilevel models use a process called partial pooling, which borrows statistical strength from the full dataset to produce more stable estimates for small groups, while still allowing each group to have its own estimated parameters. This is one of the most practically valuable features of the framework.
The relevance of multilevel modeling extends across virtually every empirical field. In medicine, clinical trials often randomize at the clinic level rather than the patient level, creating a nested structure that demands multilevel analysis. In organizational psychology, surveys of employee attitudes are almost always clustered within work units. In ecology, species observations are nested within sampling sites. In economics, individual earnings data is nested within regional labor markets. The framework is not a niche technique for specialists. It is a broadly applicable tool for anyone who works with real-world data.
Perhaps most importantly, multilevel modeling produces results that are more honest about uncertainty. By explicitly modeling the variation that exists at each level of the hierarchy, these models give you a clearer picture of what you know, what you do not know, and where the uncertainty in your estimates actually comes from. That kind of transparency is not just statistically correct. It is scientifically responsible.
Understanding Hierarchical Data Structures
Before diving into models, it helps to develop a clear mental picture of what hierarchical data actually looks like. The defining feature is that lower-level units are nested within higher-level units. Each lower-level unit belongs to exactly one higher-level unit, and the higher-level units are the groups that create the non-independence problem. This nesting can occur naturally, as when students are assigned to schools, or it can be created by a research design, as when participants are randomly assigned to treatment groups that are then observed over time.
The most common structure you will encounter is a two-level hierarchy. Level 1 contains the individual observations, and Level 2 contains the groups those observations belong to. Here are some typical examples:
- Education: Students (Level 1) nested within schools (Level 2)
- Medicine: Patients (Level 1) nested within hospitals (Level 2)
- Organizational research: Employees (Level 1) nested within companies (Level 2)
- Survey research: Respondents (Level 1) nested within neighborhoods (Level 2)
- Ecology: Individual organisms (Level 1) nested within sampling plots (Level 2)
Hierarchies can extend beyond two levels. A classic three-level structure in education places students within classrooms within schools. Each level adds complexity to the model, but the underlying logic remains the same: observations at lower levels are influenced by the context of the higher-level units they belong to. Chapter 9 covers three-level and higher models in detail. For now, the two-level case provides the clearest foundation for understanding the core concepts.
It is also worth distinguishing between cross-sectional hierarchies and longitudinal hierarchies. In a cross-sectional hierarchy, the nesting is purely structural: students within schools at a single point in time. In a longitudinal hierarchy, repeated measurements are nested within individuals. If you measure the same 500 patients at five time points, you have 2,500 observations nested within 500 people. This is a two-level structure where time points are Level 1 and individuals are Level 2. Multilevel models handle both types, and Chapter 9 addresses the longitudinal case specifically.
One concept that will come up repeatedly is the idea of variables at different levels. Some variables describe the individual: a student's age, gender, or prior test score. These are Level-1 variables. Other variables describe the group: a school's average funding per pupil, its urban or rural location, or its student-to-teacher ratio. These are Level-2 variables. A key strength of multilevel modeling is that it can include predictors from both levels in the same model and even examine how Level-2 variables moderate the effects of Level-1 variables. That kind of cross-level interaction is one of the most powerful and interesting things these models can do.
Understanding your data's hierarchy before you start modeling is not optional. It shapes every decision you make: how you specify the model, which variables belong at which level, what questions you can answer, and how you interpret the results. A useful first step with any new dataset is to draw a simple diagram of the nesting structure, label the levels, and list the variables that belong to each level. This takes five minutes and prevents a great deal of confusion later.
Example: Imagine you are analyzing data from a national health survey. You have 8,000 respondents drawn from 400 neighborhoods across 50 cities. Your outcome is self-reported health status. Your Level-1 variables include age, income, and smoking status. Your Level-2 variables (at the neighborhood level) include median household income and access to green space. You might also consider a third level with city-level variables like air quality index. Mapping this structure before modeling ensures you assign variables correctly and ask questions the data can actually answer.
One common source of confusion is the difference between hierarchical data and simply having categorical group variables. You can always add a dummy variable for each school in a standard regression. That approach, called the fixed-effects approach, does control for group differences, but it does not model the variation between groups as a quantity of interest, it cannot include Level-2 predictors, and it becomes impractical with many groups. Multilevel modeling treats group-level variation as something to be estimated and explained, not just controlled away. That distinction matters enormously for the kinds of conclusions you can draw.
How to Use This Book
This book is organized to take you from the foundational problem through to advanced applications in a logical sequence. Each chapter builds on the previous ones, so reading in order is the most effective approach, especially if multilevel modeling is new to you. That said, if you already have some background in the area, the chapters are written to be reasonably self-contained, and you can use the table of contents to navigate directly to topics you need.
Here is a brief map of what each part of the book covers:
- Chapter 1 explains why traditional regression fails with nested data, covering the specific assumption violations and their consequences. This chapter makes the case for why you need a different approach.
- Chapter 2 introduces the foundational concepts of multilevel thinking: how to define levels, how variance is decomposed across levels, and what the intraclass correlation coefficient (ICC) tells you about your data.
- Chapter 3 explains fixed effects and random effects clearly and carefully, because this distinction is central to everything that follows.
- Chapter 4 walks you through building your first multilevel model, starting from the simplest possible specification and adding complexity step by step.
- Chapter 5 covers model specification in more depth, including random slopes, cross-level interactions, and the estimation methods used to fit these models.
- Chapter 6 focuses on interpretation: how to read coefficients, variance components, and predictions from a multilevel model in a way that is accurate and communicable.
- Chapter 7 addresses assumptions and diagnostics, giving you the tools to check whether your model is valid and what to do when it is not.
- Chapter 8 provides practical implementation guidance in R and Stata, with annotated code examples you can adapt for your own analyses.
- Chapter 9 extends the framework to three-level models, nonlinear outcomes, and longitudinal data.
The code examples in this book use R as the primary language, with the lme4 package for most models. Stata examples are provided in Chapter 8 using the mixed command. If you use a different software environment, the conceptual explanations and model-building logic apply regardless of platform. The syntax will differ, but the underlying decisions you need to make remain the same.
Each chapter includes concrete examples drawn from realistic research scenarios. These examples are not just illustrations. They are worked problems that show you how to move from a research question to a model specification to an interpretation of results. Pay close attention to these examples, because the reasoning they demonstrate is transferable to your own data. The specific numbers will change, but the process stays the same.
At the end of the book, you will find an appendix with a quick reference guide covering common model syntax across software platforms and a concise interpretation guide for the most frequently encountered output. This appendix is designed to be a practical resource you return to while working on your own analyses, not just something you read once and forget.
One practical suggestion: work through the examples actively rather than just reading them. If you have access to R or Stata, reproduce the code as you go. If you have your own dataset with a hierarchical structure, try applying each concept to it as you learn it. Multilevel modeling is a skill, and like any skill, it develops through practice. Reading about it is necessary but not sufficient. Doing it, making mistakes, and figuring out why the output looks unexpected is how the understanding becomes durable.
What You Need to Know Before Starting
This book assumes you have a working knowledge of standard linear regression. You should be comfortable with the idea of a regression equation, the interpretation of coefficients and intercepts, the meaning of standard errors and p-values, and the basic assumptions that regression relies on (linearity, homoscedasticity, independence, and normality of residuals). If those terms are familiar and you can interpret a regression table without difficulty, you have the foundation you need.
Beyond regression, it helps to have some familiarity with the following concepts, though the book will briefly review them as they become relevant:
- Variance and standard deviation: You should understand what variance measures and how it relates to the spread of a distribution.
- Correlation: A basic understanding of what correlation coefficients represent will help when the intraclass correlation is introduced.
- Statistical significance and confidence intervals: You should know how to interpret p-values and what a 95% confidence interval means in practice.
- Model fit concepts: Familiarity with ideas like R-squared, residuals, and model comparison (such as likelihood ratio tests) will be useful, though these are explained in context.
You do not need a background in matrix algebra or advanced mathematical statistics. The book explains the key ideas conceptually and uses equations only where they genuinely clarify something that words alone cannot. When equations appear, they are explained line by line. The goal is always understanding, not mathematical formalism for its own sake.
On the software side, the R examples assume you can install packages, load data, and run basic commands. You do not need to be an experienced R programmer. If you can run lm(y ~ x, data = mydata) and read the output, you have enough R knowledge to follow the code in this book. The Stata examples in Chapter 8 assume similar basic familiarity with that environment. If you are completely new to both platforms, spending a few hours with an introductory tutorial before starting Chapter 8 will make the implementation sections much smoother.
It is also worth setting realistic expectations about the learning curve. Multilevel modeling is not dramatically more difficult than standard regression, but it does introduce new concepts that take time to internalize. The distinction between fixed and random effects, in particular, tends to require some sitting with before it clicks. Do not be discouraged if the first read-through of a chapter leaves you with questions. That is normal. The concepts build on each other, and things that seem abstract in Chapter 2 often become clear once you see them applied in Chapter 4 or Chapter 6.
Finally, bring your own data if you have it. The most effective way to learn multilevel modeling is to apply it to a problem you actually care about. Throughout the book, you will be encouraged to think about how each concept applies to your specific research context. If you are analyzing student test scores, patient outcomes, or employee survey responses, keep that dataset in mind as you read. The examples in the book are designed to be representative, but your own data will make the learning more immediate and more meaningful.
One last note on terminology: different fields and textbooks use different names for the same concepts. What this book calls a multilevel model might be called a hierarchical linear model in educational research, a mixed-effects model in statistics and biology, or a random-effects model in econometrics. These terms are not perfectly synonymous in every technical detail, but they refer to the same broad family of models. When you encounter different terminology in other sources, the conceptual framework you build here will help you navigate those differences without getting lost in the vocabulary.
This is the end of the free sample. The full book has 9 chapters.
Want this book written for you?
Tell us your goals and background, and get your own version of this book, tailored by AI to you.


Benefits of AI-tailored books
- Read one book, not ten:
- all the Statistics knowledge you need, gathered into a single book.
- Save days of learning:
- tell us your goals, choose your topics, and the whole book is built around them.
- Learn effortlessly:
- Statistics book written for your specific background and expertise.
- Understand at a glance:
- includes charts, tables, timelines, checklists, decision trees, and more.
- Stay current:
- written the day you order it, not years ago.
- Trust what you read:
- every book is checked for accuracy, with real research when your subject needs it.
Create your unique book in 3 steps
- 1. Select your focus
Select the focus of your Statistics book and share your background
- 2. Personalize your book
Specify your goals and choose sub-topics to include
- 3. Get your tailored book
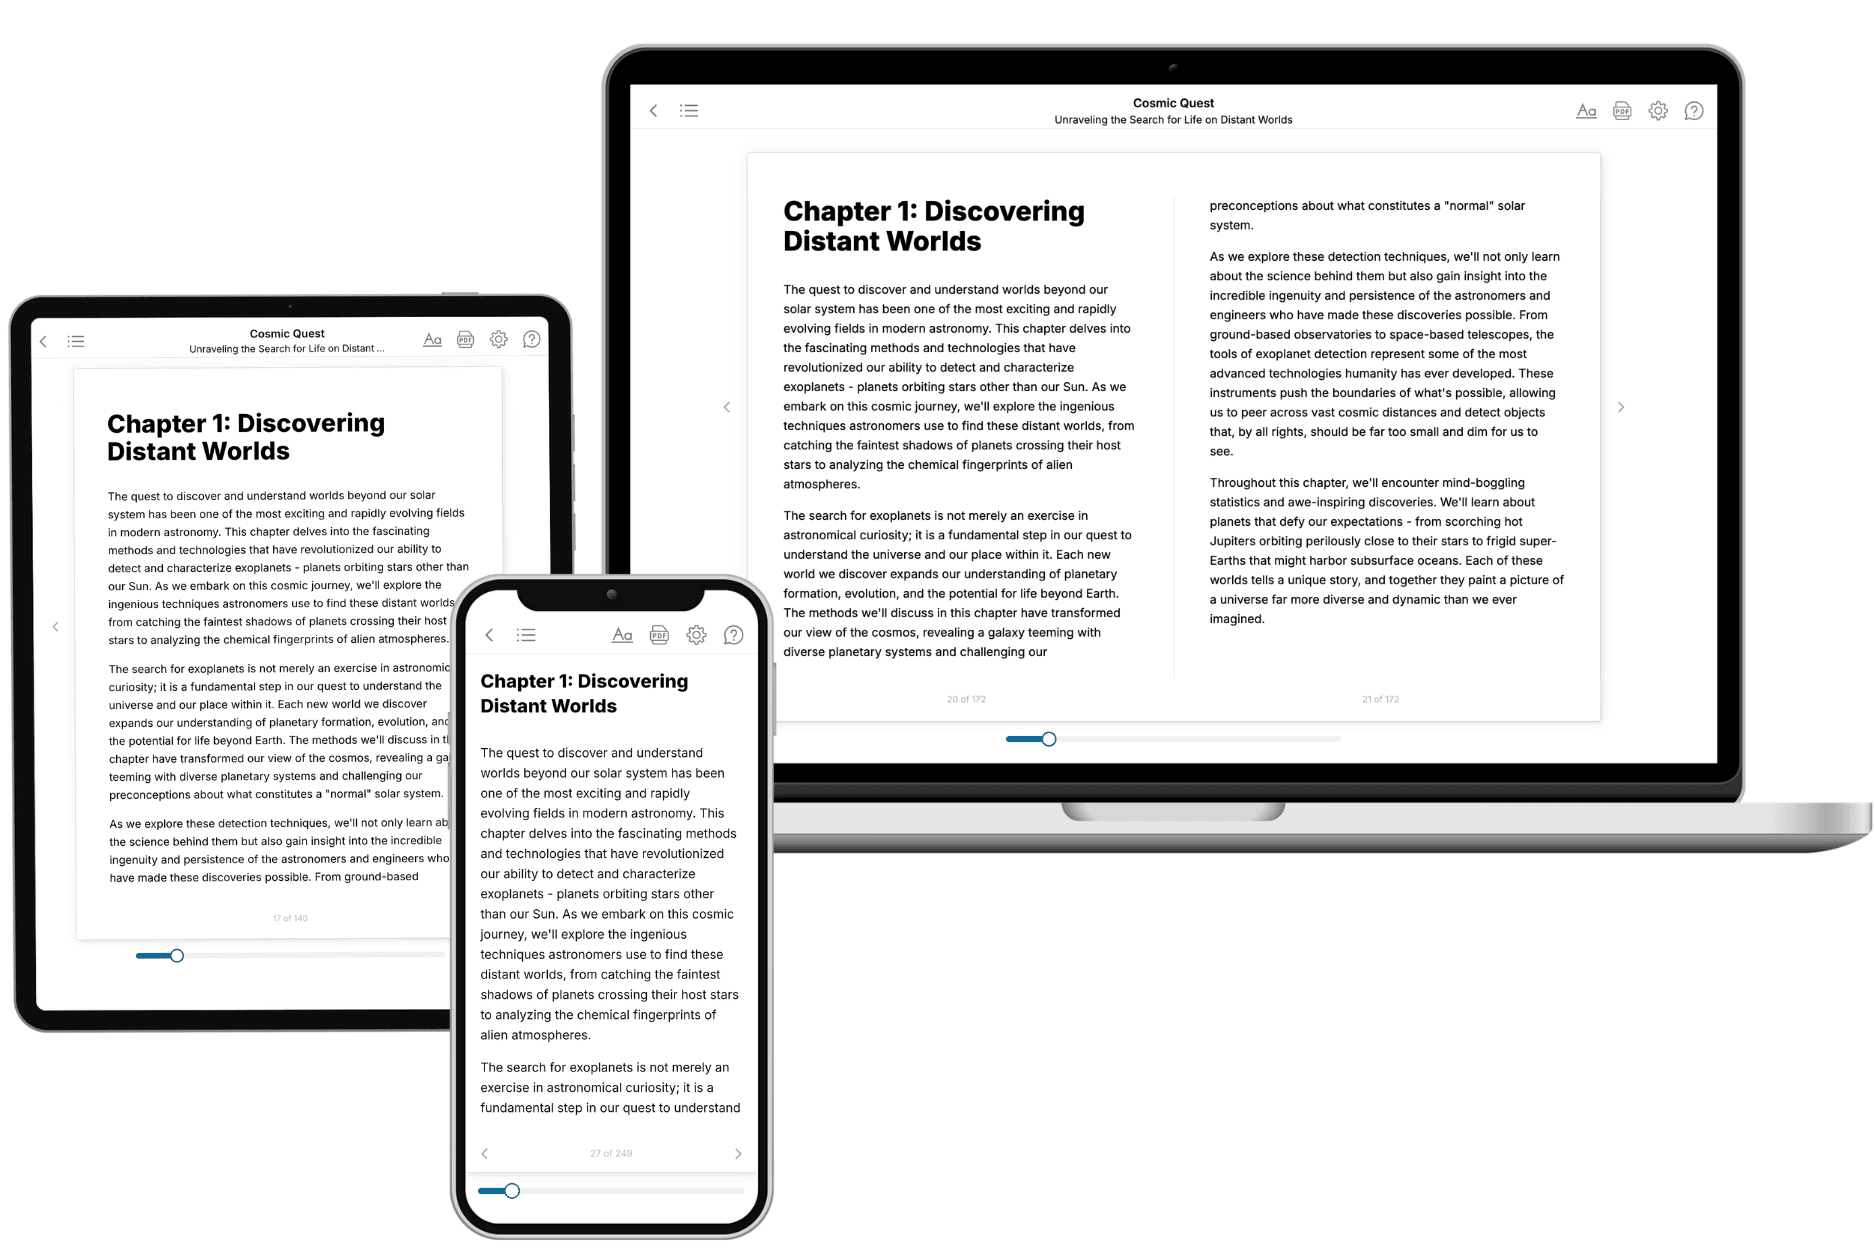
Your book is ready in 10 minutes. Read it online, download as EPUB or PDF, or send to Kindle.

Frequently asked questions
- What is TailoredRead?
TailoredRead creates complete, full-length nonfiction ebooks, written specifically for you. Tell us what you want to learn and why, and TailoredRead writes you a complete ebook on it, with charts, tables, and diagrams throughout. Read it online, on Kindle, or on any e-reader, or download it as a PDF or EPUB. Every book is written fresh the day you order it.
- How is the book tailored to me?
Before anything is written, you answer a few short questions about your goals, your background, and the topics you care about. Your book is then planned around your answers: written at your level, focused on your goals, and covering the topics you chose, instead of the one-size-fits-all book a store sells everyone.
- Will it read like generic AI content?
No. Your book isn't a chat transcript: it's planned chapter by chapter before a single word is written, told in a clear book voice, and explains ideas visually with charts, tables, and diagrams. After writing, every book goes through an editorial pass that polishes chapters so the book reads consistent from start to finish. Judge for yourself: browse thousands of sample books on our Explore Books page.
- How accurate is the content?
Our AI first checks whether your subject needs live research. Niche and fast-moving subjects are researched before writing, and the book plan and chapters are grounded in what it finds. After writing, every book goes through a quality pass that checks its facts and consistency, and researched books list their sources in a Notes section at the back.
- How long is the book?
You choose the length: Comprehensive (250-300 pages), Detailed (150-200 pages), Essential (70-100 pages), or Short (30-50 pages).
- Does the book include visuals?
Yes. Every book includes charts, tables, and diagrams: timelines, checklists, step-by-step guides, decision trees, comparison tables, matrices, and bar charts. A typical book includes dozens of these visual elements.
- Can I read it on Kindle? What formats can I download?
Yes. Every book can be read in our online reader or downloaded as a PDF or EPUB. The EPUB can be opened with Kindle, Apple Books, Kobo, and any e-reader. The Commercial and Author licenses also include an editable Word (DOCX) and Markdown download.
- How much does it cost?
About the price of a regular ebook. The exact price depends on your book's length and complexity, from $2 for the shortest books to $35 for the most comprehensive, and it's shown when you review your book, before you commit to anything. Each book is a one-time purchase, yours to keep, no subscription. Licenses that let you share, teach, or publish your book range from $35.99 to $49.99.
- Can I preview the book before purchasing?
Before you pay, you'll see what your book will cover: the title, a detailed description, the estimated length, and the complete chapter-by-chapter table of contents, so you know what you're getting before you decide. The full text itself is written after you purchase.
- How long does it take to create a book?
About 10 minutes. You can start reading the opening chapters while the rest is still being written.