Multivariate Statistics Essentials
Master Multiple Variables and Unlock Deeper Data Insights
What if the patterns you're missing in your data could transform your decision-making?
222 pages10 chaptersMar 21, 2026Statistics
About this book
Most analysts stop at simple two-variable relationships, but the real insights emerge when you examine multiple variables simultaneously. This book bridges the gap between basic statistics and advanced multivariate analysis, providing you with practical methods to uncover complex relationships in your data. You'll learn how to reduce dimensionality without losing information, model outcomes with multiple predictors, identify natural clusters, and validate your findings rigorously. Each concept is grounded in real-world applications with step-by-step guidance on implementation. Whether you're analyzing business metrics, research data, or organizational patterns, these techniques will elevate your analytical capabilities and help you extract deeper, more actionable insights from complex datasets.
Table of contents
- IntroductionWhy Multivariate Statistics Matter, How This Book Is Organized, Getting Started with the Right MindsetRead below
- Chapter 1: Foundations of Multivariate ThinkingFrom Univariate to Multivariate Analysis, Key Concepts and Terminology, Understanding Data Structure and Dimensionality, Core Assumptions in Multivariate Methods
- Chapter 2: Correlation and Covariance StructuresCorrelation Matrices and Interpretation, Covariance Structures and Their Meaning, Detecting and Addressing Multicollinearity, Practical Applications and Visualization
- Chapter 3: Principal Component Analysis and Dimensionality ReductionUnderstanding PCA Principles, Computing and Interpreting Principal Components, Determining Optimal Number of Components, Real-World PCA Applications
- Chapter 4: Multiple Regression and Model BuildingMultiple Regression Fundamentals, Variable Selection and Model Comparison, Interaction Effects and Non-linear Relationships, Regression Diagnostics and Validation
- Chapter 5: Multivariate Analysis of Variance (MANOVA)MANOVA Concepts and When to Use It, Testing MANOVA Assumptions, Interpreting MANOVA Results, Case Studies and Practical Examples
- Chapter 6: Cluster Analysis and ClassificationHierarchical and K-Means Clustering, Distance Measures and Similarity Metrics, Determining Optimal Clusters and Validation, Introduction to Classification Techniques
- Chapter 7: Discriminant Analysis and PredictionLinear and Quadratic Discriminant Analysis, Assessing Classification Accuracy, Logistic Regression for Binary Outcomes, Building Predictive Models in Practice
- Chapter 8: Factor Analysis and Latent VariablesFactor Analysis Concepts and Applications, Factor Extraction and Rotation Methods, Interpreting Factors and Loadings, PCA vs. Factor Analysis: When to Use Each
- Chapter 9: Testing Assumptions and DiagnosticsMultivariate Normality Assessment, Homogeneity of Variance and Covariance, Identifying Outliers and Influential Observations, Remedies When Assumptions Are Violated
- Chapter 10: Software Implementation and WorkflowsGetting Started with R for Multivariate Analysis, Python Libraries and Tools for Multivariate Statistics, Data Preparation and Cleaning Workflows, Visualizing Multivariate Data Effectively
- ConclusionIntegrating Methods into Your Analytical Practice, Next Steps in Your Statistical Journey
- Glossary of Terms
- Further Reading and Resources
Introduction
Most data analysis stops too soon. You run a correlation between two variables, check whether a difference is statistically significant, and move on. That approach works well enough when the world is simple, but real-world data rarely is. Customer behavior depends on dozens of interacting factors. Patient outcomes are shaped by genetics, lifestyle, treatment history, and environment all at once. Business performance reflects the combined push and pull of market conditions, internal processes, team dynamics, and timing. When you analyze these situations one variable at a time, you miss most of what is actually happening.
Multivariate statistics is the toolkit built for exactly this kind of complexity. Instead of examining one or two variables in isolation, multivariate methods let you study many variables simultaneously, capturing the relationships, patterns, and structures that only become visible when you look at the full picture. These techniques are not just for academic researchers or data scientists with advanced degrees. They are practical, learnable tools that any analyst with a solid foundation in basic statistics can master with the right guidance and enough practice.
This book is designed to give you that guidance. It assumes you already understand concepts like means, standard deviations, hypothesis testing, and simple regression. From that foundation, it builds your understanding step by step, introducing each multivariate method in plain language before moving into the mechanics and applications. Every chapter connects theory to practice, showing you not just what these methods are, but when to use them, how to run them in software, and how to interpret what you get back. By the time you finish, you will have a working command of the most important multivariate techniques used in research, business, and data science today.
The goal is not to turn you into a statistician who can derive every formula from first principles. The goal is to make you a more capable, more confident analyst who can handle complex, multi-dimensional data and extract insights that simpler methods would miss entirely. That is a realistic and valuable outcome, and this book is built to help you reach it.
Why Multivariate Statistics Matter
Consider a simple scenario. A retail company wants to understand why some customers spend more than others. An analyst runs a correlation between income and spending and finds a moderate positive relationship. That seems useful. But income alone explains only part of the story. Age, household size, geographic location, purchase frequency, and product category preferences all contribute to spending patterns as well. When you add those variables into the analysis simultaneously, the picture changes dramatically. Some variables that looked important in isolation turn out to be redundant. Others that seemed unrelated become significant once you control for confounding factors.
This is the core value of multivariate statistics: it lets you account for the real complexity of the systems you are studying. In a univariate or bivariate analysis, you are always leaving something out. That omission can lead to misleading conclusions, poor predictions, and decisions based on incomplete evidence. Multivariate methods reduce that risk by modeling the full set of relevant variables together, capturing interactions and dependencies that simpler analyses cannot detect.
The practical impact of this is significant across many fields. In medicine, multivariate models help researchers identify which combination of risk factors best predicts disease outcomes, controlling for age, sex, and comorbidities simultaneously.[1] In marketing, cluster analysis groups customers into meaningful segments based on dozens of behavioral variables at once, enabling far more targeted campaigns than simple demographic splits. In organizational research, factor analysis uncovers the underlying dimensions of employee engagement that no single survey question can capture on its own.
Beyond any single application, multivariate thinking changes how you approach data problems in general. You start asking better questions. Instead of "Is X related to Y?", you ask "How does X relate to Y after accounting for Z, W, and V?" Instead of "Are these two groups different?", you ask "Are these groups different across this entire set of outcome measures, and which measures drive the difference?" These are more sophisticated questions, and they lead to more reliable, more nuanced answers.
There is also a practical reality worth acknowledging: the data you encounter in professional and academic settings is almost always multivariate by nature. Survey datasets routinely contain dozens of variables. Financial datasets track hundreds of metrics across time. Genomic datasets involve thousands of variables simultaneously. The tools covered in this book are not exotic specialties reserved for rare situations. They are the standard methods used to make sense of the kinds of data that analysts encounter every day.
One common concern is that multivariate methods are too mathematically demanding for anyone without a graduate-level statistics background. That concern is understandable but overstated. The underlying mathematics can be complex, but you do not need to master linear algebra or matrix calculus to use these methods effectively. What you need is a clear conceptual understanding of what each method does, a solid grasp of the assumptions it requires, and the ability to implement it correctly in software and interpret the output. This book focuses on exactly those three things.
Another concern is that more complex methods are harder to explain to stakeholders. That is sometimes true, but it is manageable. A well-constructed visualization of a cluster analysis or a clearly written summary of a principal component solution can communicate complex findings to a non-technical audience without sacrificing accuracy. Throughout this book, you will find guidance on how to present multivariate results in ways that are both honest and accessible.
The patterns you are missing in your data are not hidden because they are rare or subtle. They are hidden because the methods you are using were not designed to find them. Multivariate statistics gives you the right tools for the job.
How This Book Is Organized
This book is structured to build your knowledge progressively. Each chapter introduces new methods and concepts, but always connects back to the foundational ideas established earlier. You do not need to read every chapter in strict sequence, but the early chapters will make the later ones considerably easier to follow. If you are new to multivariate thinking, working through the book from start to finish is the recommended approach.
Chapter 1: Foundations of Multivariate Thinking establishes the conceptual framework for everything that follows. It explains the shift from univariate to multivariate analysis, introduces key terminology, and covers the core assumptions that underpin most multivariate methods. This chapter is essential reading regardless of your experience level, because it sets up the vocabulary and mental models used throughout the rest of the book.
Chapter 2: Correlation and Covariance Structures dives into the mathematical relationships between variables. You will learn how to read and interpret correlation matrices, understand what covariance structures reveal about your data, and detect multicollinearity before it distorts your results. This chapter also covers practical visualization techniques for exploring relationships among many variables at once.
Chapter 3: Principal Component Analysis and Dimensionality Reduction introduces one of the most widely used multivariate techniques. PCA transforms a large set of correlated variables into a smaller set of uncorrelated components, making high-dimensional data far more manageable. You will learn how PCA works conceptually, how to compute and interpret components, and how to decide how many components to retain.
Chapter 4: Multiple Regression and Model Building extends the regression framework you likely already know into the multivariate domain. This chapter covers variable selection strategies, interaction effects, non-linear relationships, and the diagnostic checks needed to validate your models. It is one of the most practically applicable chapters in the book, with direct relevance to prediction and causal inference tasks.
The book then moves into more specialized territory. The chapters that follow cover the key methods in sequence:
- Chapter 5 covers Multivariate Analysis of Variance (MANOVA), which extends the familiar ANOVA framework to situations with multiple dependent variables simultaneously.
- Chapter 6 covers Cluster Analysis and Classification, including hierarchical clustering, k-means clustering, and an introduction to classification techniques.
- Chapter 7 covers Discriminant Analysis and Prediction, including linear and quadratic discriminant analysis, logistic regression, and model evaluation.
- Chapter 8 covers Factor Analysis and Latent Variables, explaining how to uncover hidden structures in data and how factor analysis differs from PCA.
- Chapter 9 covers Testing Assumptions and Diagnostics, providing a systematic approach to checking whether your data meets the requirements of the methods you are applying.
- Chapter 10 covers Software Implementation and Workflows, walking through practical implementation in both R and Python with annotated code examples.
Each chapter follows a consistent structure. It opens with a conceptual explanation of the method, moves into the mechanics and interpretation, provides worked examples with real or realistic data, and closes with practical guidance on implementation. Key terms are bolded on first use and defined in the glossary at the back of the book. Footnotes throughout the text point to primary sources and further reading for those who want to go deeper on any topic.
The conclusion brings everything together, offering a framework for integrating these methods into your ongoing analytical practice and pointing toward next steps for continued learning. Whether your goal is to apply these techniques in a professional role, complete a research project, or simply expand your statistical literacy, the conclusion will help you map out a path forward that fits your specific situation.
One important note about the software chapters: the code examples in Chapter 10 use R and Python, the two most widely used environments for statistical analysis today. You do not need to be an expert programmer to follow along. The examples are written to be readable and well-commented, with explanations of what each step does and why. If you are more comfortable with one language than the other, you can focus on that language without losing anything essential from the statistical content.
Getting Started with the Right Mindset
Before diving into the technical content, it is worth spending a moment on mindset. Multivariate statistics can feel intimidating at first, especially if your background is primarily in simpler methods. The concepts are more abstract, the outputs are more complex, and the potential for misinterpretation is higher. These are real challenges, and acknowledging them honestly is more useful than pretending they do not exist. The good news is that they are all manageable with the right approach.
The most important mindset shift is moving from formula-first thinking to concept-first thinking. Many people try to learn statistics by memorizing formulas and procedures, then applying them mechanically. That approach breaks down quickly with multivariate methods, because the procedures are more complex and the judgment calls are more numerous. A much more effective approach is to first understand what a method is trying to accomplish, then learn how it accomplishes it, and finally practice applying it to real data. This book is structured to support exactly that sequence.
Expect to encounter concepts that do not click immediately. That is normal and not a sign that you are doing something wrong. Multivariate statistics involves ideas like eigenvalues, factor loadings, Mahalanobis distance, and Wilks' lambda that have no obvious everyday equivalent. When you hit one of these concepts and it feels opaque, the right response is to keep reading, look at the examples, and come back to the definition after you have seen the concept in action. Understanding often arrives after exposure, not before it.
Practice is non-negotiable. Reading about principal component analysis is useful, but running a PCA on a real dataset and working through the output is where genuine understanding develops. Throughout this book, you will find suggestions for datasets to practice with and specific exercises to try. Taking those suggestions seriously will accelerate your learning considerably. Many of the datasets used in examples are publicly available, and the software chapters will show you exactly how to load and work with them.
It also helps to maintain a healthy skepticism about your own results. Multivariate methods are powerful, but they can also produce outputs that look impressive while actually reflecting noise, overfitting, or violated assumptions. Developing the habit of checking your assumptions, examining your diagnostics, and asking whether your results make substantive sense is just as important as knowing how to run the analysis in the first place. Chapter 9 is dedicated to this topic, but the habit of critical evaluation should run through everything you do with these methods.
Here is a practical checklist to keep in mind as you work through each new method in this book:
- Understand the purpose. What question is this method designed to answer? What kind of data does it require?
- Check the assumptions. What does this method assume about your data? How do you test those assumptions?
- Run the analysis. Implement the method in software using a real or practice dataset.
- Interpret the output. What do the key statistics and tables tell you? What do they not tell you?
- Evaluate the results. Do the findings make substantive sense? Are there signs of overfitting, assumption violations, or other problems?
- Communicate the findings. How would you explain these results to someone who did not run the analysis?
This checklist applies whether you are running a simple multiple regression or a complex factor analysis. It keeps you grounded in the purpose of the analysis and prevents the common mistake of treating statistical output as automatically meaningful just because the software produced it.
Finally, remember that multivariate statistics is a skill that develops over time. No one reads a book like this once and immediately becomes proficient. The analysts and researchers who use these methods fluently have typically spent years working with them across many different datasets and problems. Your goal right now is not mastery. Your goal is to build a solid foundation of understanding and practical experience that you can continue to develop long after you finish the last chapter. That is an achievable goal, and every page of this book is designed to move you closer to it.
One concrete step you can take right now, before reading Chapter 1, is to identify a dataset from your own work or field of interest that you would like to analyze using multivariate methods. It does not need to be large or complex. Even a dataset with five to ten variables and a few hundred observations is enough to practice most of the techniques covered here. Having a real analytical goal in mind as you read will make the concepts more concrete and the practice exercises more meaningful. Keep that dataset in mind as you work through the book, and by the end, you will have the tools to analyze it in ways you could not before.
The transition from basic to multivariate statistics is not a leap into the unknown. It is a series of manageable steps, each one building on what you already know. The methods are learnable, the software is accessible, and the insights they produce are worth the effort.
With that foundation in place, it is time to begin. Chapter 1 starts with the conceptual shift from univariate to multivariate thinking, establishing the framework that will carry you through everything that follows. The patterns in your data are waiting to be found. The tools to find them are in the pages ahead.
Notes
Introduction
- 1. B. G. Tabachnick and L. S. Fidell, Using Multivariate Statistics (7th ed.), Pearson, 2019
This is the end of the free sample. The full book has 10 chapters.
Want this book written for you?
Tell us your goals and background, and get your own version of this book, tailored by AI to you.


Benefits of AI-tailored books
- Read one book, not ten:
- all the Statistics knowledge you need, gathered into a single book.
- Save days of learning:
- tell us your goals, choose your topics, and the whole book is built around them.
- Learn effortlessly:
- Statistics book written for your specific background and expertise.
- Understand at a glance:
- includes charts, tables, timelines, checklists, decision trees, and more.
- Stay current:
- written the day you order it, not years ago.
- Trust what you read:
- every book is checked for accuracy, with real research when your subject needs it.
Create your unique book in 3 steps
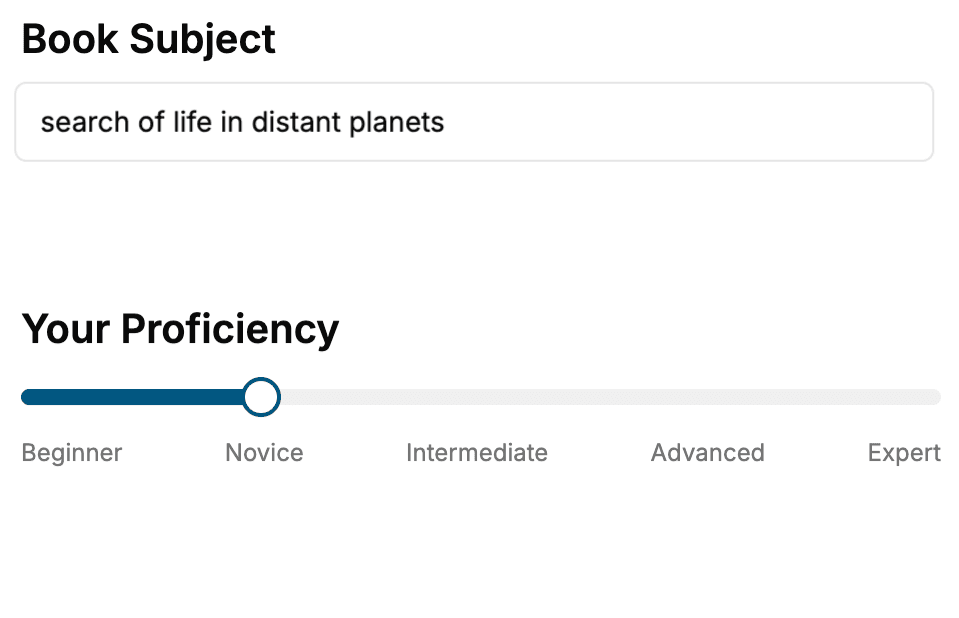
- 1. Select your focus
Select the focus of your Statistics book and share your background
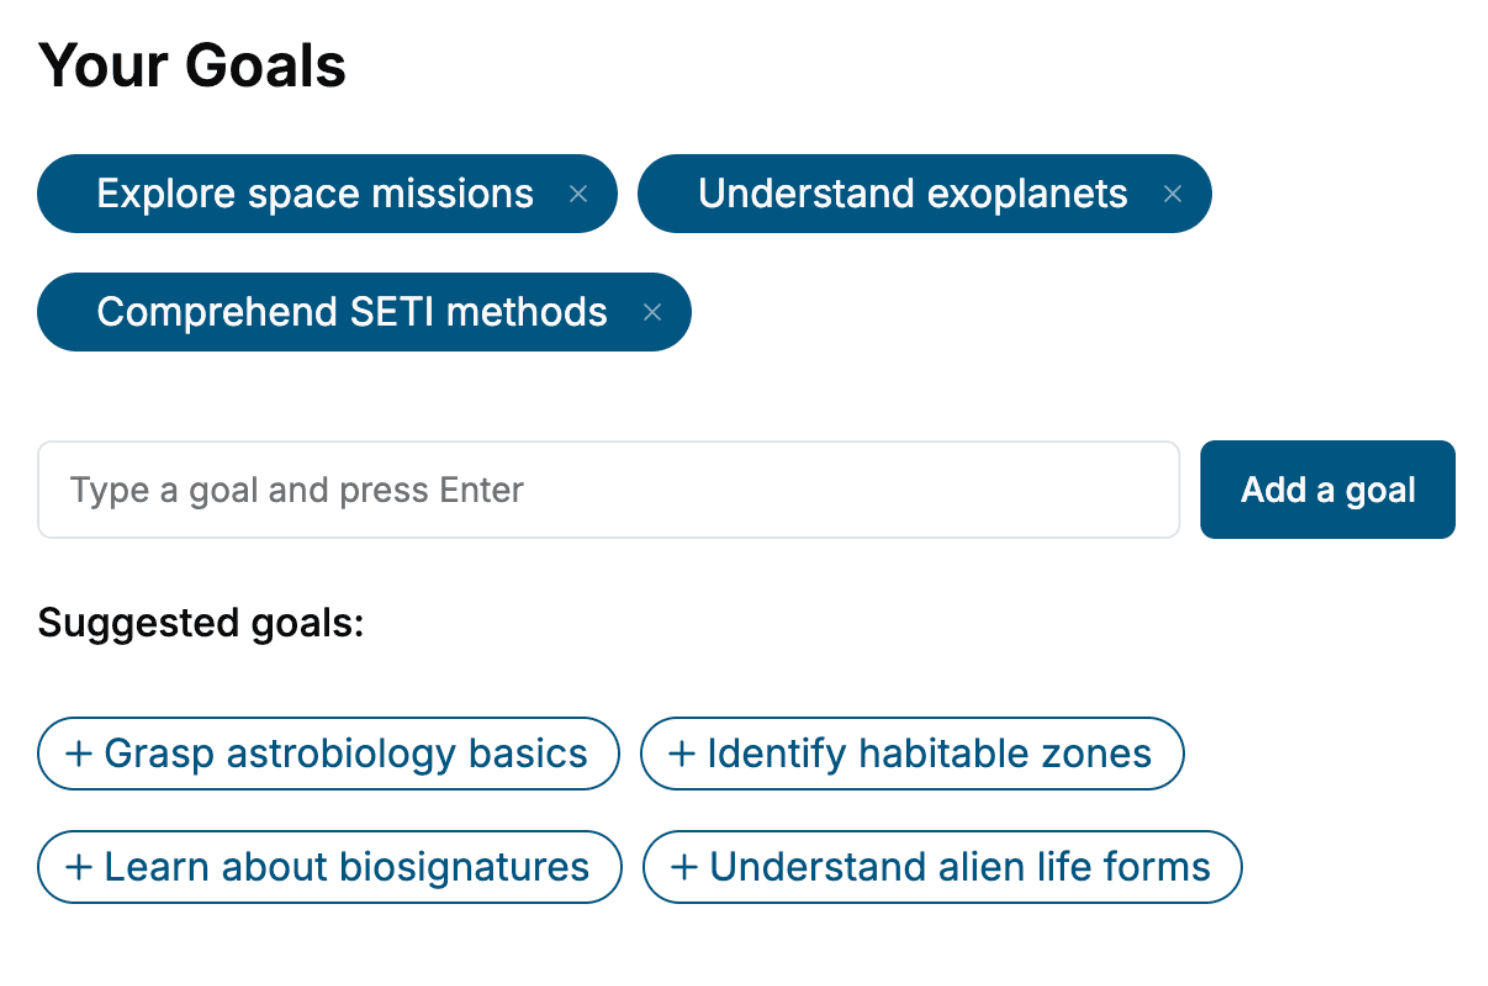
- 2. Personalize your book
Specify your goals and choose sub-topics to include
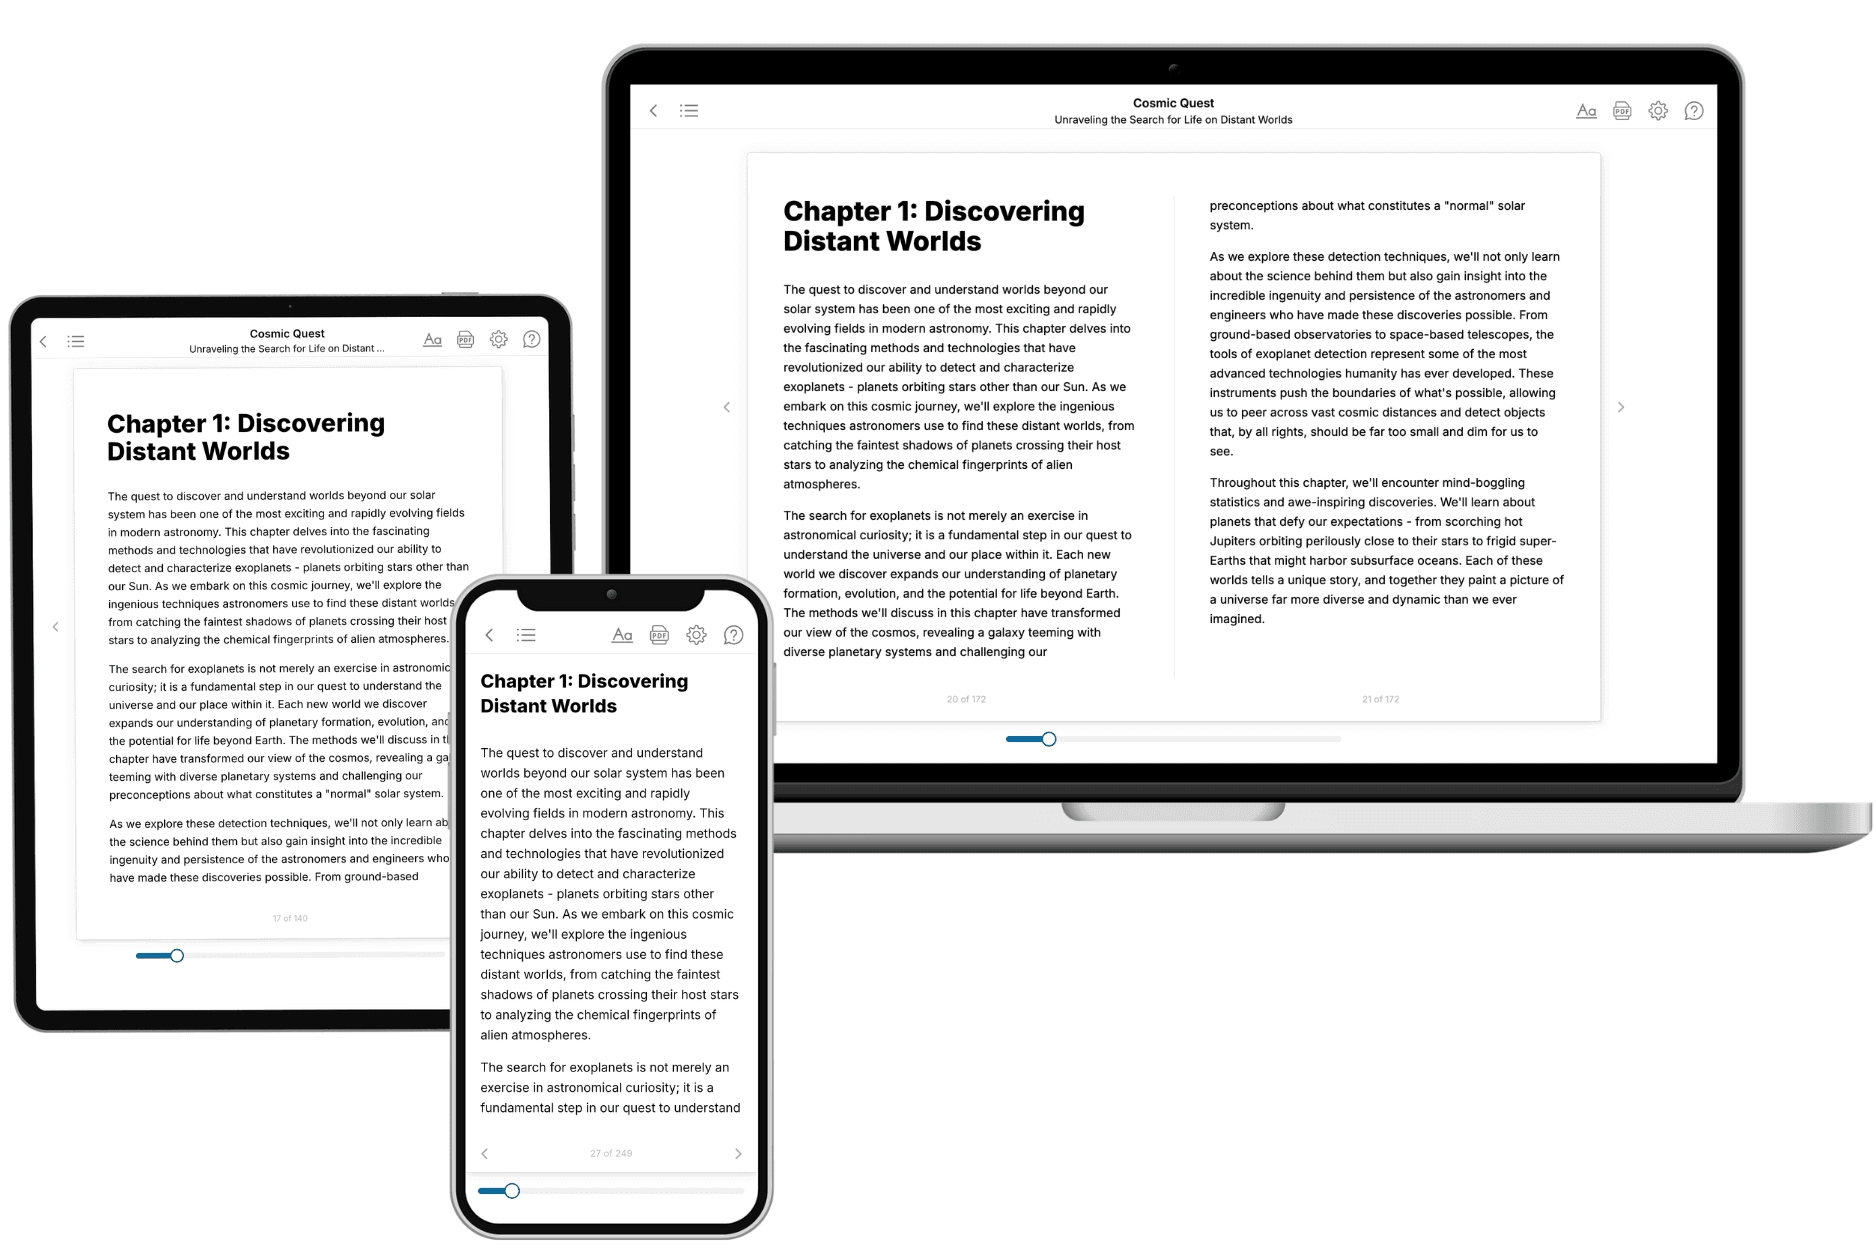
- 3. Get your tailored book
Your book is ready in 10 minutes. Read it online, download as EPUB or PDF, or send to Kindle.
Frequently asked questions
- What is TailoredRead?
TailoredRead creates complete, full-length nonfiction ebooks, written specifically for you. Tell us what you want to learn and why, and TailoredRead writes you a complete ebook on it, with charts, tables, and diagrams throughout. Read it online, on Kindle, or on any e-reader, or download it as a PDF or EPUB. Every book is written fresh the day you order it.
- How is the book tailored to me?
Before anything is written, you answer a few short questions about your goals, your background, and the topics you care about. Your book is then planned around your answers: written at your level, focused on your goals, and covering the topics you chose, instead of the one-size-fits-all book a store sells everyone.
- Will it read like generic AI content?
No. Your book isn't a chat transcript: it's planned chapter by chapter before a single word is written, told in a clear book voice, and explains ideas visually with charts, tables, and diagrams. After writing, every book goes through an editorial pass that polishes chapters so the book reads consistent from start to finish. Judge for yourself: browse thousands of sample books on our Explore Books page.
- How accurate is the content?
Our AI first checks whether your subject needs live research. Niche and fast-moving subjects are researched before writing, and the book plan and chapters are grounded in what it finds. After writing, every book goes through a quality pass that checks its facts and consistency, and researched books list their sources in a Notes section at the back.
- How long is the book?
You choose the length: Comprehensive (250-300 pages), Detailed (150-200 pages), Essential (70-100 pages), or Short (30-50 pages).
- Does the book include visuals?
Yes. Every book includes charts, tables, and diagrams: timelines, checklists, step-by-step guides, decision trees, comparison tables, matrices, and bar charts. A typical book includes dozens of these visual elements.
- Can I read it on Kindle? What formats can I download?
Yes. Every book can be read in our online reader or downloaded as a PDF or EPUB. The EPUB can be opened with Kindle, Apple Books, Kobo, and any e-reader. The Commercial and Author licenses also include an editable Word (DOCX) and Markdown download.
- How much does it cost?
About the price of a regular ebook. The exact price depends on your book's length and complexity, from $2 for the shortest books to $35 for the most comprehensive, and it's shown when you review your book, before you commit to anything. Each book is a one-time purchase, yours to keep, no subscription. Licenses that let you share, teach, or publish your book range from $35.99 to $49.99.
- Can I preview the book before purchasing?
Before you pay, you'll see what your book will cover: the title, a detailed description, the estimated length, and the complete chapter-by-chapter table of contents, so you know what you're getting before you decide. The full text itself is written after you purchase.
- How long does it take to create a book?
About 10 minutes. You can start reading the opening chapters while the rest is still being written.