Pivot Power
Mastering Google Sheets Pivot Tables for Insightful Data Analysis
Are you drowning in data but struggling to extract meaningful insights?
269 pages13 chaptersDec 23, 2024Data Analytics
About this book
"Pivot Power" is your lifeline to transforming raw information into actionable intelligence. This comprehensive guide demystifies the art of Pivot Tables in Google Sheets, equipping you with the skills to slice, dice, and visualize your data like never before. From basic concepts to advanced techniques, you'll discover how to harness the full potential of Pivot Tables. Learn to create dynamic reports, uncover hidden trends, and present your findings with clarity and impact. Whether you're summarizing sales figures, analyzing survey responses, or tracking project progress, this book will elevate your data game. Packed with practical examples and step-by-step tutorials, "Pivot Power" caters to both novices and seasoned spreadsheet users. You'll master time-saving shortcuts, troubleshoot common issues, and learn best practices for designing intuitive dashboards. By the end of this journey, you'll possess the confidence to tackle any data challenge that comes your way.
Table of contents
- IntroductionThe Power of Pivot Tables, Book Overview and How to Use It, The Importance of Data Analysis in Today's World, Why Google Sheets for Pivot Tables?Read below
- Chapter 1: Understanding Pivot Table BasicsWhat Are Pivot Tables?, When to Use Pivot Tables, Preparing Your Data for Pivot Tables, Creating Your First Pivot Table
- Chapter 2: Anatomy of a Pivot TableRows and Columns, Values Area, Filters, Understanding Pivot Table Layout Options
- Chapter 3: Working with Data SourcesUsing Data from Google Sheets, Importing External Data Sources, Selecting the Right Data Range, Ensuring Data Quality and Consistency
- Chapter 4: Summarizing Data with Pivot TablesCount and Sum Functions, Average, Maximum, and Minimum, Custom Calculations and Formulas, Percentage and Distribution Analysis
- Chapter 5: Grouping and Sorting in Pivot TablesGrouping Data for Better Analysis, Working with Date and Time Grouping, Custom Sorting Options, Manual Reordering of Items
- Chapter 6: Filtering and Slicing DataUnderstanding Filter Options, Introduction to Slicers, Advanced Filtering Techniques, Combining Multiple Filters
- Chapter 7: Mastering Calculated FieldsCreating Calculated Fields, Using Complex Formulas in Calculated Fields, Conditional Calculations, Working with Calculated Items
- Chapter 8: Visualizing Data with Pivot ChartsCreating Your First Pivot Chart, Choosing the Right Chart Type, Customizing Pivot Charts, Creating Dynamic, Interactive Charts
- Chapter 9: Formatting and Design Best PracticesPivot Table Style Options, Applying Conditional Formatting, Custom Number Formats, Layout and Readability Tips
- Chapter 10: Refreshing and Updating Pivot TablesManual Refresh Techniques, Setting Up Auto-Refresh, Handling Data Range Changes, Understanding Pivot Cache
- Chapter 11: Advanced Pivot Table TechniquesMultiple Consolidation Ranges, Combining Multiple Pivot Tables, Using Array Formulas with Pivot Tables, Automating with Macros and Scripts
- Chapter 12: Troubleshooting Common Pivot Table IssuesDealing with Data Errors, Resolving Performance Issues, Fixing Formatting Problems, Troubleshooting Calculation Errors
- Chapter 13: Real-World Applications and Case StudiesSales Performance Analysis, Budget Tracking and Forecasting, Inventory Management, Marketing Campaign Analytics
- ConclusionThe Future of Pivot Tables in Data Analysis, Continuous Learning and Improvement
- Glossary
- AppendixKeyboard Shortcuts for Pivot Tables, Pivot Table Function Reference
Introduction
In today's data-driven world, the ability to efficiently analyze and interpret large volumes of information has become an indispensable skill for professionals across various industries. As businesses and organizations continue to amass vast amounts of data, the need for powerful tools to extract meaningful insights has never been greater. Enter Pivot Tables - a revolutionary feature in spreadsheet applications that has transformed the landscape of data analysis. This book, "Pivot Power: Mastering Google Sheets Pivot Tables for Insightful Data Analysis," is your comprehensive guide to harnessing the full potential of Pivot Tables in Google Sheets, empowering you to unlock hidden patterns, trends, and valuable insights within your data.
Throughout this introduction, we will explore the fundamental concepts of Pivot Tables, their significance in modern data analysis, and why Google Sheets has emerged as a preferred platform for creating and manipulating these powerful tools. We'll also provide an overview of the book's structure and content, ensuring you're well-equipped to embark on your journey towards Pivot Table mastery. By the end of this chapter, you'll have a solid foundation and a clear roadmap for developing your skills in data analysis using Google Sheets Pivot Tables.
The Power of Pivot Tables
Pivot Tables are, without a doubt, one of the most powerful and versatile features available in spreadsheet applications. They offer a dynamic way to summarize, analyze, and present large datasets with ease and efficiency. At their core, Pivot Tables allow you to reorganize and restructure your data on the fly, providing a flexible framework for exploring different perspectives and uncovering insights that might otherwise remain hidden in rows and columns of raw data.
The true power of Pivot Tables lies in their ability to transform complex data into meaningful information without the need for complex formulas or programming skills. With just a few clicks, you can aggregate thousands of data points, calculate statistics, and create visual representations that make it easy to identify trends, patterns, and outliers. This capability is particularly valuable in today's fast-paced business environment, where quick decision-making based on data-driven insights can provide a significant competitive advantage.
One of the key strengths of Pivot Tables is their interactive nature. Unlike static reports or pre-defined charts, Pivot Tables allow you to dynamically adjust your view of the data. You can easily add or remove fields, apply filters, and change calculation methods, all in real-time. This interactivity enables you to answer ad-hoc questions and explore different scenarios quickly, making Pivot Tables an invaluable tool for both routine reporting and exploratory data analysis.
Moreover, Pivot Tables excel at handling large volumes of data. While traditional spreadsheet functions and formulas can become unwieldy and slow when dealing with extensive datasets, Pivot Tables remain efficient and responsive. They achieve this by creating a compact summary of your data, which can be manipulated and analyzed much more quickly than the raw data itself. This efficiency is crucial when working with datasets that contain thousands or even millions of rows, allowing you to derive insights from big data without the need for specialized data analysis software.
Another powerful aspect of Pivot Tables is their ability to perform complex calculations with ease. Whether you need to calculate percentages of totals, running totals, or custom formulas, Pivot Tables provide built-in functions and the flexibility to create calculated fields. This feature allows you to perform sophisticated analyses without having to write complex formulas for each calculation, saving time and reducing the risk of errors.
Pivot Tables also shine in their capacity to reveal hierarchical relationships within your data. You can easily group data by multiple levels, such as year, quarter, and month, or by product category and subcategory. This hierarchical view allows you to drill down into the details or zoom out for a high-level overview, providing a comprehensive understanding of your data structure and relationships.
Furthermore, Pivot Tables serve as an excellent foundation for creating dynamic dashboards and reports. By linking Pivot Tables to charts and other visual elements, you can create interactive dashboards that update automatically as the underlying data changes. This capability is particularly valuable for creating real-time reporting solutions that provide up-to-date insights to stakeholders across your organization.
The versatility of Pivot Tables extends across various industries and use cases. In finance, they can be used to analyze budget variances and forecast future trends. In marketing, Pivot Tables can help segment customers and evaluate campaign performance. In operations, they can be employed to track inventory levels and analyze production efficiency. Regardless of your specific field or role, mastering Pivot Tables will equip you with a powerful tool to enhance your data analysis capabilities and drive informed decision-making.
As we delve deeper into the world of Pivot Tables throughout this book, you'll discover how to leverage these powerful features to transform raw data into actionable insights. From basic summarization to advanced techniques like calculated fields and multi-dimensional analysis, you'll learn how to harness the full potential of Pivot Tables to solve real-world business problems and uncover valuable insights that can drive your organization forward.
Book Overview and How to Use It
"Pivot Power: Mastering Google Sheets Pivot Tables for Insightful Data Analysis" is designed to be your comprehensive guide to becoming proficient in using Pivot Tables within Google Sheets. This book is structured to take you on a journey from the fundamental concepts of Pivot Tables to advanced techniques that will elevate your data analysis skills to new heights. Whether you're a beginner looking to understand the basics or an experienced user aiming to refine your skills, this book offers valuable insights and practical knowledge to help you achieve your goals.
The book is organized into logical chapters that build upon each other, allowing you to progressively develop your understanding and skills. We begin with the basics, introducing you to the concept of Pivot Tables and their role in data analysis. From there, we delve into the structure and anatomy of Pivot Tables, ensuring you have a solid foundation before moving on to more complex topics. As you progress through the book, you'll explore increasingly sophisticated techniques, from data summarization and filtering to advanced calculations and visualizations.
Each chapter is designed to be both informative and practical, combining theoretical knowledge with hands-on exercises and real-world examples. This approach ensures that you not only understand the concepts but also gain practical experience in applying them to actual data analysis scenarios. Throughout the book, you'll find step-by-step instructions, tips, and best practices that will help you navigate the intricacies of Pivot Tables with confidence.
To make the most of this book, it's recommended that you follow along with the examples using your own Google Sheets account. This hands-on approach will allow you to immediately apply what you're learning and reinforce your understanding through practice. Don't hesitate to experiment with different datasets and scenarios as you work through the chapters – the more you explore, the more comfortable and proficient you'll become with Pivot Tables.
The book is structured to accommodate different learning styles and needs. If you're new to Pivot Tables, it's advisable to work through the chapters sequentially, as each builds upon the knowledge and skills developed in the previous ones. However, if you're already familiar with basic Pivot Table concepts, you may choose to focus on specific chapters that address more advanced topics or areas where you want to enhance your skills.
Throughout the book, you'll find callout boxes, tips, and notes that highlight important concepts, common pitfalls to avoid, and advanced techniques. Pay special attention to these as they often contain valuable insights that can significantly improve your efficiency and effectiveness when working with Pivot Tables. Additionally, each chapter concludes with a summary of key points and a set of practice exercises, allowing you to reinforce your learning and test your understanding of the material covered.
As you progress through the book, you'll notice that we emphasize not just the "how" but also the "why" behind various Pivot Table techniques. Understanding the underlying principles and logic of Pivot Tables will enable you to approach new challenges creatively and develop innovative solutions to complex data analysis problems. This deeper understanding will also help you troubleshoot issues more effectively and optimize your Pivot Tables for better performance and insights.
The later chapters of the book focus on advanced techniques and real-world applications. These sections are designed to take your skills to the next level, introducing you to sophisticated analysis methods and showing you how to apply Pivot Tables to solve complex business problems. Even if some of these advanced topics seem challenging at first, don't be discouraged. With practice and persistence, you'll find that even the most complex Pivot Table techniques become manageable and powerful tools in your data analysis arsenal.
Remember that mastering Pivot Tables is an ongoing journey. As you work through this book, take the time to practice regularly and apply what you've learned to your own datasets and projects. The more you use Pivot Tables in real-world scenarios, the more proficient and confident you'll become. Don't hesitate to revisit chapters or sections as needed – often, concepts that seemed challenging at first become clearer with experience and repeated exposure.
Finally, keep in mind that this book is not just a one-time read but a reference that you can return to as you encounter new challenges in your data analysis work. The detailed table of contents and index will help you quickly locate specific topics or techniques when you need them. As you grow in your Pivot Table skills, you may find yourself revisiting certain chapters to refresh your knowledge or discover new insights that you might have missed on your first read-through.
By the end of this book, you'll have a comprehensive understanding of Pivot Tables in Google Sheets and the skills to tackle a wide range of data analysis challenges. Whether you're summarizing sales data, analyzing survey responses, or creating complex financial models, you'll be equipped with the knowledge and techniques to leverage Pivot Tables effectively and efficiently. So, let's embark on this journey to unlock the full potential of Pivot Tables and transform the way you analyze and present data.
The Importance of Data Analysis in Today's World
In the digital age, data has become the lifeblood of businesses and organizations across all sectors. The exponential growth of information generated by digital technologies, often referred to as "big data," has created both opportunities and challenges for professionals in every field. The ability to effectively analyze and interpret this vast sea of data has become a critical skill, separating successful organizations from those that struggle to keep pace with the rapidly evolving business landscape. Understanding the importance of data analysis is crucial for appreciating the value of tools like Pivot Tables and their role in modern decision-making processes.
At its core, data analysis is the process of inspecting, cleansing, transforming, and modeling data to discover useful information, draw conclusions, and support decision-making. In today's data-driven world, this process has become integral to virtually every aspect of business operations, from strategic planning to day-to-day management. The insights derived from data analysis can reveal hidden patterns, market trends, customer preferences, and operational inefficiencies that might otherwise go unnoticed. These insights, in turn, enable organizations to make informed decisions, optimize processes, and gain a competitive edge in their respective markets.
One of the primary reasons for the growing importance of data analysis is its ability to drive evidence-based decision-making. In the past, many business decisions were based on intuition, experience, or limited information. While these factors still play a role, the availability of vast amounts of data and sophisticated analysis tools has shifted the paradigm towards more data-driven approaches. By basing decisions on concrete evidence and statistical analysis, organizations can reduce risk, increase efficiency, and improve outcomes across various domains, from product development to customer service.
Data analysis also plays a crucial role in identifying and capitalizing on new opportunities. By analyzing market trends, consumer behavior, and competitive landscapes, businesses can uncover untapped markets, develop innovative products, and tailor their offerings to meet evolving customer needs. This proactive approach to market intelligence enables organizations to stay ahead of the curve and adapt quickly to changing market conditions. Furthermore, data analysis can help in predicting future trends and scenarios, allowing businesses to prepare for potential challenges and opportunities before they arise.
In the realm of operational efficiency, data analysis has become an indispensable tool for identifying bottlenecks, optimizing processes, and reducing costs. By analyzing operational data, organizations can pinpoint inefficiencies, streamline workflows, and allocate resources more effectively. This can lead to significant improvements in productivity and cost savings, directly impacting the bottom line. For example, supply chain optimization through data analysis can result in reduced inventory costs, improved delivery times, and enhanced customer satisfaction.
Customer relationship management is another area where data analysis has revolutionized business practices. By analyzing customer data, organizations can gain deep insights into customer behavior, preferences, and satisfaction levels. This information can be used to personalize marketing efforts, improve product offerings, and enhance customer service. The ability to segment customers based on various attributes and behaviors allows for targeted marketing campaigns and tailored customer experiences, leading to increased customer loyalty and higher retention rates.
In the financial sector, data analysis has become essential for risk management, fraud detection, and investment strategies. Advanced analytical techniques can identify patterns indicative of fraudulent activities, assess credit risks, and optimize investment portfolios. These applications not only protect financial institutions and their clients but also contribute to the overall stability of financial markets. Moreover, data analysis plays a crucial role in regulatory compliance, helping organizations meet increasingly complex reporting requirements and maintain transparency in their operations.
The healthcare industry has also seen a significant transformation through the application of data analysis. From improving patient outcomes to optimizing hospital operations, data-driven insights are revolutionizing healthcare delivery. Electronic health records, wearable devices, and other digital health technologies generate vast amounts of data that, when properly analyzed, can lead to more accurate diagnoses, personalized treatment plans, and improved public health strategies. Data analysis is also instrumental in medical research, accelerating drug discovery and the development of new treatments.
In the public sector, data analysis is being leveraged to improve government services, enhance public safety, and inform policy decisions. By analyzing demographic data, usage patterns, and citizen feedback, government agencies can optimize resource allocation, improve urban planning, and deliver more efficient public services. Data analysis also plays a crucial role in areas such as crime prevention, emergency response, and environmental protection, helping authorities make informed decisions and respond effectively to various challenges.
As the importance of data analysis continues to grow, so does the need for professionals skilled in data manipulation and interpretation. This has led to the rise of new roles such as data analysts, data scientists, and business intelligence specialists. However, the democratization of data analysis tools, including user-friendly applications like Google Sheets and its Pivot Table feature, has also made it possible for professionals across various disciplines to incorporate data analysis into their work. This widespread adoption of data analysis skills is transforming job roles and creating new opportunities across industries.
In conclusion, the importance of data analysis in today's world cannot be overstated. It has become a fundamental driver of innovation, efficiency, and competitive advantage across all sectors of the economy. As organizations continue to generate and collect vast amounts of data, the ability to extract meaningful insights from this information will only become more critical. By mastering tools like Pivot Tables in Google Sheets, you are equipping yourself with essential skills that will not only enhance your professional capabilities but also contribute to the success and growth of your organization in an increasingly data-driven world.
Why Google Sheets for Pivot Tables?
In the realm of spreadsheet applications, Google Sheets has emerged as a powerful and versatile platform for data analysis, particularly when it comes to working with Pivot Tables. While there are other spreadsheet tools available, Google Sheets offers a unique combination of features, accessibility, and collaborative capabilities that make it an excellent choice for both individual users and organizations. Understanding the advantages of using Google Sheets for Pivot Tables will help you appreciate why this platform is increasingly preferred by professionals across various industries.
One of the primary advantages of Google Sheets is its cloud-based nature. Unlike traditional desktop spreadsheet applications, Google Sheets operates entirely in the cloud, which means you can access your spreadsheets and Pivot Tables from any device with an internet connection. This accessibility is invaluable in today's mobile and remote work environments, allowing you to analyze data and make decisions on the go. Whether you're in the office, at home, or traveling, your Pivot Tables and the underlying data are always at your fingertips, ensuring you can respond quickly to data-driven insights and changing business needs.
The collaborative features of Google Sheets set it apart from many other spreadsheet applications. Multiple users can work on the same spreadsheet simultaneously, with changes reflected in real-time. This real-time collaboration is particularly powerful when working with Pivot Tables, as it allows team members to collectively analyze data, discuss insights, and make decisions based on shared information. The ability to leave comments, chat within the document, and see who else is viewing or editing the spreadsheet enhances communication and teamwork, making Google Sheets an ideal platform for collaborative data analysis projects.
Version control is another significant advantage of using Google Sheets for Pivot Tables. The platform automatically saves your work as you go, creating a detailed version history that allows you to review or revert to previous versions of your spreadsheet. This feature is invaluable when experimenting with different Pivot Table configurations or when multiple team members are making changes. If a mistake is made or an undesired change occurs, you can easily roll back to a previous version, ensuring that your data analysis work is always protected.
Google Sheets also offers robust integration with other Google Workspace (formerly G Suite) applications and third-party tools. This integration allows for seamless data import from various sources, including Google Forms for survey data, Google Analytics for web traffic data, and numerous other platforms through add-ons and APIs. The ability to easily connect and refresh data from multiple sources enhances the power and flexibility of Pivot Tables in Google Sheets, enabling you to create dynamic dashboards and reports that update automatically as new data becomes available.
The user interface of Google Sheets is designed with simplicity and intuitiveness in mind, making it accessible to users with varying levels of spreadsheet experience. When it comes to Pivot Tables, Google Sheets provides a user-friendly interface for creating and modifying tables, with drag-and-drop functionality that simplifies the process of arranging fields and adjusting table layouts. This ease of use reduces the learning curve for new users and allows even those with limited technical skills to create powerful data summaries and analyses.
Performance is a critical factor when working with large datasets, and Google Sheets has made significant strides in this area. While it may not match the raw processing power of some desktop applications for extremely large datasets, Google Sheets can handle substantial amounts of data efficiently, especially when using Pivot Tables. The cloud-based infrastructure allows Google to continually improve performance and introduce new features without requiring users to update their software manually.
Google Sheets also offers a robust set of functions and formulas that complement Pivot Tables. These include advanced statistical functions, lookup functions, and array formulas that can be used in conjunction with Pivot Tables to perform complex analyses. The QUERY function, in particular, is a powerful tool that allows you to use SQL-like syntax to manipulate and analyze data, providing an additional layer of flexibility when working with Pivot Tables.
The platform's commitment to regular updates and new feature releases ensures that Google Sheets remains at the forefront of spreadsheet technology. New Pivot Table features and enhancements are frequently introduced, often based on user feedback and emerging data analysis needs. This continuous improvement cycle means that your skills and capabilities with Pivot Tables in Google Sheets will continue to grow and evolve over time.
Security and data protection are paramount concerns when working with sensitive business data. Google Sheets benefits from Google's robust security infrastructure, including encryption of data in transit and at rest, advanced access controls, and compliance with various industry standards. For organizations, Google Workspace offers additional security features and administrative controls, ensuring that data remains protected and compliant with relevant regulations.
The cost-effectiveness of Google Sheets is another significant advantage, especially for small to medium-sized businesses and individual users. The basic version of Google Sheets is available for free with a Google account, providing access to powerful Pivot Table functionality without any upfront investment. For organizations requiring additional features and support, Google Workspace offers affordable subscription plans that include Google Sheets along with other productivity tools.
Lastly, the extensive community and support ecosystem surrounding Google Sheets is a valuable resource for users working with Pivot Tables. Numerous online forums, tutorials, and third-party resources are available to help you learn new techniques, troubleshoot issues, and discover innovative ways to use Pivot Tables in Google Sheets. This community-driven knowledge base complements the official documentation and support provided by Google, ensuring that help is always available when you need it.
In conclusion, Google Sheets offers a compelling platform for working with Pivot Tables, combining accessibility, collaboration, and powerful features in a user-friendly package. Its cloud-based nature, integration capabilities, and continuous improvement make it an excellent choice for professionals seeking to enhance their data analysis skills. As we delve deeper into the world of Pivot Tables throughout this book, you'll discover how to leverage these advantages to create insightful analyses and drive data-informed decision-making in your work.
This is the end of the free sample. The full book has 13 chapters.
Want this book written for you?
Tell us your goals and background, and get your own version of this book, tailored by AI to you.


Benefits of AI-tailored books
- Read one book, not ten:
- all the Data Analytics knowledge you need, gathered into a single book.
- Save days of learning:
- tell us your goals, choose your topics, and the whole book is built around them.
- Learn effortlessly:
- Data Analytics book written for your specific background and expertise.
- Understand at a glance:
- includes charts, tables, timelines, checklists, decision trees, and more.
- Stay current:
- written the day you order it, not years ago.
- Trust what you read:
- every book is checked for accuracy, with real research when your subject needs it.
Create your unique book in 3 steps
- 1. Select your focus
Select the focus of your Data Analytics book and share your background
- 2. Personalize your book
Specify your goals and choose sub-topics to include
- 3. Get your tailored book
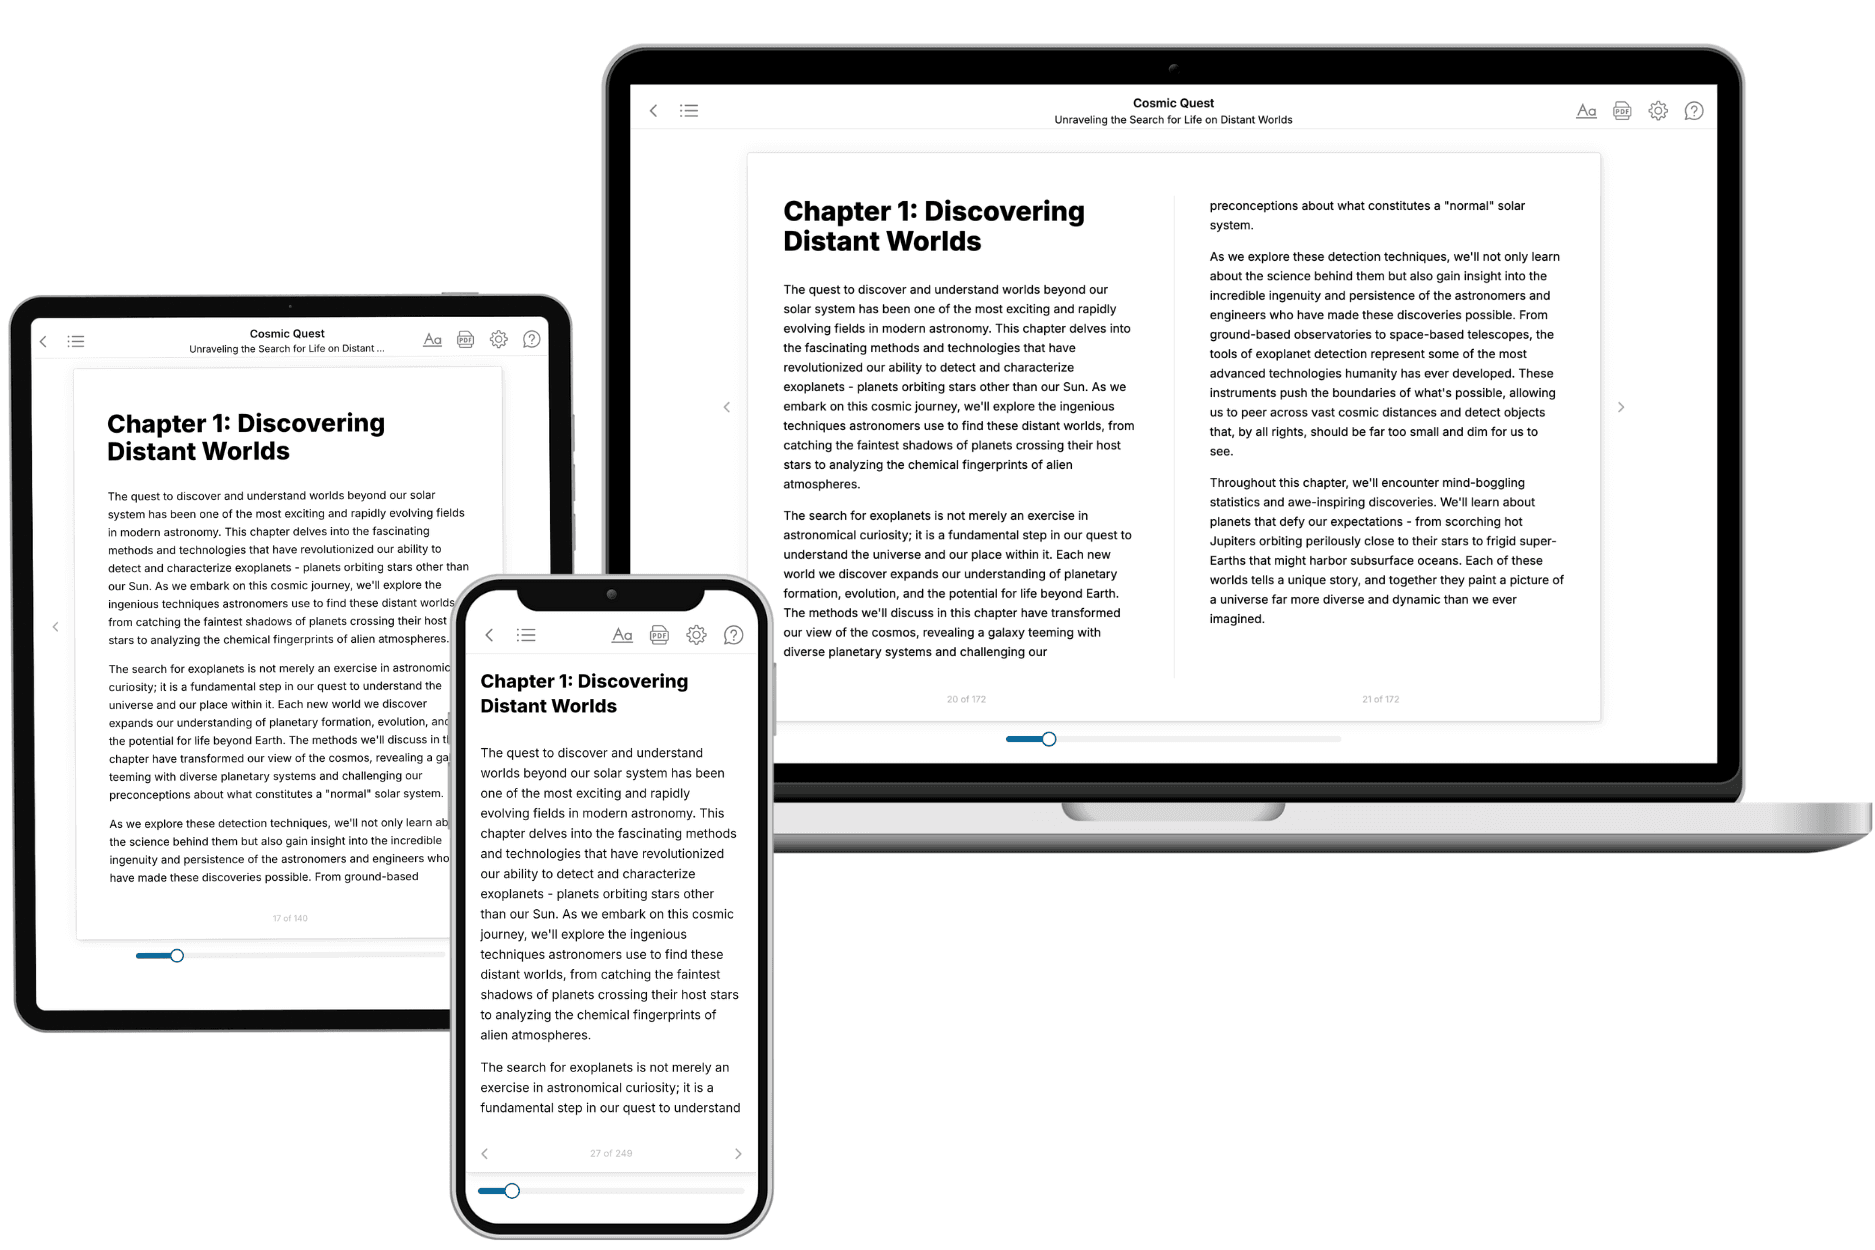
Your book is ready in 10 minutes. Read it online, download as EPUB or PDF, or send to Kindle.

Frequently asked questions
- What is TailoredRead?
TailoredRead creates complete, full-length nonfiction ebooks, written specifically for you. Tell us what you want to learn and why, and TailoredRead writes you a complete ebook on it, with charts, tables, and diagrams throughout. Read it online, on Kindle, or on any e-reader, or download it as a PDF or EPUB. Every book is written fresh the day you order it.
- How is the book tailored to me?
Before anything is written, you answer a few short questions about your goals, your background, and the topics you care about. Your book is then planned around your answers: written at your level, focused on your goals, and covering the topics you chose, instead of the one-size-fits-all book a store sells everyone.
- Will it read like generic AI content?
No. Your book isn't a chat transcript: it's planned chapter by chapter before a single word is written, told in a clear book voice, and explains ideas visually with charts, tables, and diagrams. After writing, every book goes through an editorial pass that polishes chapters so the book reads consistent from start to finish. Judge for yourself: browse thousands of sample books on our Explore Books page.
- How accurate is the content?
Our AI first checks whether your subject needs live research. Niche and fast-moving subjects are researched before writing, and the book plan and chapters are grounded in what it finds. After writing, every book goes through a quality pass that checks its facts and consistency, and researched books list their sources in a Notes section at the back.
- How long is the book?
You choose the length: Comprehensive (250-300 pages), Detailed (150-200 pages), Essential (70-100 pages), or Short (30-50 pages).
- Does the book include visuals?
Yes. Every book includes charts, tables, and diagrams: timelines, checklists, step-by-step guides, decision trees, comparison tables, matrices, and bar charts. A typical book includes dozens of these visual elements.
- Can I read it on Kindle? What formats can I download?
Yes. Every book can be read in our online reader or downloaded as a PDF or EPUB. The EPUB can be opened with Kindle, Apple Books, Kobo, and any e-reader. The Commercial and Author licenses also include an editable Word (DOCX) and Markdown download.
- How much does it cost?
About the price of a regular ebook. The exact price depends on your book's length and complexity, from $2 for the shortest books to $35 for the most comprehensive, and it's shown when you review your book, before you commit to anything. Each book is a one-time purchase, yours to keep, no subscription. Licenses that let you share, teach, or publish your book range from $35.99 to $49.99.
- Can I preview the book before purchasing?
Before you pay, you'll see what your book will cover: the title, a detailed description, the estimated length, and the complete chapter-by-chapter table of contents, so you know what you're getting before you decide. The full text itself is written after you purchase.
- How long does it take to create a book?
About 10 minutes. You can start reading the opening chapters while the rest is still being written.