Population Density Mapping
Understanding Human Distribution Through Spatial Data and Visualization
Discover how population density mapping transforms raw demographic data into powerful visual insights that reveal the true patterns of human settlement and distribution.
238 pages11 chaptersMay 16, 2026GIS
About this book
This comprehensive guide takes you from foundational concepts to advanced applications, equipping you with the knowledge to create, interpret, and apply population density maps effectively. Learn the science behind different mapping techniques, understand how to select the right method for your specific questions, and explore real-world applications from urban planning to public health. Whether you're analyzing migration patterns, planning infrastructure, or understanding demographic shifts, this book provides the practical frameworks and technical knowledge you need to harness the power of spatial population data. Gain the skills to work with GIS tools, navigate data limitations, and communicate demographic insights through compelling visualizations that drive better decision-making.
Table of contents
- IntroductionWhy Population Density Matters, The Evolution of Population Mapping, What You'll Learn in This BookRead below
- Chapter 1: Fundamentals of Population DensityDefining Population Density, Measurement Units and Scales, Global Population Distribution Patterns
- Chapter 2: Data Sources and Collection MethodsCensus Data and Official Statistics, Remote Sensing and Satellite Imagery, Alternative Data Sources and Big Data, Assessing Data Quality and Limitations
- Chapter 3: Core Mapping TechniquesChoropleth Maps: Color-Coded Regions, Dot Density Maps: Individual Point Representation, Heat Maps and Kernel Density Estimation, Cartograms: Distorted Geography
- Chapter 4: Classification and Normalization MethodsClassification Schemes and Their Impact, Normalization Techniques for Fair Comparison, Choosing the Right Method for Your Data
- Chapter 5: GIS Tools and SoftwareGIS Fundamentals and Spatial Analysis, Popular GIS Platforms and Software, Open-Source and Web-Based Tools
- Chapter 6: Applications in Urban Planning and DevelopmentInfrastructure Planning and Resource Allocation, Analyzing Urban Growth and Sprawl, Housing and Service Distribution
- Chapter 7: Public Health and Epidemiology ApplicationsDisease Mapping and Epidemiological Patterns, Identifying Health Disparities and Access Issues, Population Density in Pandemic Response
- Chapter 8: Environmental and Climate ApplicationsEnvironmental Impact Assessment, Climate Vulnerability and Population Exposure, Natural Resource Management and Conservation
- Chapter 9: Interpreting and Analyzing Population MapsReading and Understanding Population Maps, Identifying Spatial Patterns and Anomalies, Statistical Analysis of Spatial Data
- Chapter 10: Visualization Design and CommunicationDesign Principles for Effective Maps, Color, Symbolization, and Visual Hierarchy, Telling Stories with Population Data
- Chapter 11: Ethical Considerations and Data PrivacyPrivacy Concerns and Data Protection, Representation Bias and Accuracy, Responsible Mapping Practices
- ConclusionKey Takeaways and Next Steps, The Future of Population Density Mapping
- Glossary of Terms
- Further Reading and Resources
Introduction
Look at any map of the world's population, and something immediately becomes clear: people are not spread evenly across the Earth's surface. They cluster along coastlines, river valleys, and fertile plains. They concentrate in cities and scatter across rural hinterlands. Some regions hold billions of people within a few hundred square miles, while vast stretches of land remain nearly empty. These patterns are not random. They reflect centuries of history, geography, economics, and culture, all written into the landscape in the form of human settlement. Population density mapping is the discipline that makes these patterns visible, measurable, and useful.
At its core, population density mapping is about translating numbers into spatial understanding. A census table can tell you that a country has 50 million people. A population density map can show you where those people actually live, how they cluster, and how their distribution relates to roads, rivers, hospitals, and economic centers. That shift from tabular data to spatial visualization is not just aesthetic. It changes what questions you can ask and what answers you can find. Patterns that are invisible in a spreadsheet become obvious on a well-constructed map, and those patterns often carry enormous practical significance.
This book is designed for professionals and students who already have some grounding in mapping and earth sciences and want to go deeper into the specific domain of population density analysis. Whether you work in urban planning, public health, environmental management, disaster response, or academic research, the ability to create, interpret, and communicate population density maps is an increasingly valuable skill. The chapters ahead will take you from foundational concepts through advanced techniques, covering data sources, mapping methods, GIS tools, real-world applications, and the ethical responsibilities that come with working with demographic data.
The field has changed dramatically in recent years. Digital tools, satellite imagery, and large-scale datasets have made it possible to map population distribution at resolutions and scales that were unimaginable just two decades ago. Open-source GIS platforms have lowered the barrier to entry, and web-based visualization tools have made it easier than ever to share spatial insights with broad audiences. At the same time, these advances have introduced new challenges around data quality, privacy, and the risk of misrepresentation. Understanding both the power and the limitations of population density mapping is essential for anyone who wants to use it responsibly and effectively.
Why Population Density Matters
Population density is one of the most fundamental descriptors of human geography. It tells you not just how many people live somewhere, but how intensely they occupy space. That distinction matters enormously across a wide range of practical fields. A region with 10 million people spread across 500,000 square kilometers faces very different infrastructure challenges than a region with the same population packed into 500 square kilometers. The density shapes everything from traffic patterns and housing costs to disease transmission rates and emergency response times.
Consider urban planning as a concrete example. City planners use population density maps to decide where to build new transit lines, schools, and hospitals. A neighborhood with rapidly increasing density may need new water and sewage infrastructure before it reaches a crisis point. A low-density suburban fringe may be expanding in ways that make public transit economically unviable. Without spatial data showing where people actually live and how that distribution is changing, these decisions become guesswork. With good population density maps, planners can make evidence-based choices that serve communities more effectively.[1]
Public health is another domain where population density mapping has proven indispensable. The spread of infectious diseases is directly influenced by how densely people are packed together. During the COVID-19 pandemic, researchers and public health officials used population density maps to predict which areas were at highest risk for rapid transmission, to allocate testing resources, and to design targeted intervention strategies. Studies showed that high-density urban areas experienced faster initial spread, while lower-density regions often saw delayed but still significant outbreaks.[2] Maps made those patterns actionable.
Environmental management also depends heavily on understanding where people are. Assessing the human impact on ecosystems, identifying communities most vulnerable to flooding or wildfire, and planning conservation areas all require knowing how population density interacts with the physical landscape. A forest buffer zone that looks adequate on a topographic map may be dangerously thin when overlaid with a population density layer showing rapid suburban expansion. The spatial relationship between people and their environment is a core concern in sustainability planning, and population density mapping is the tool that makes that relationship visible.
Beyond these professional applications, population density data shapes policy at the highest levels of government. Electoral district boundaries, federal funding allocations, and national infrastructure investments are all influenced by where people live and how densely they are concentrated. Misrepresenting or misunderstanding population distribution can lead to policies that systematically underserve certain communities. Accurate, well-interpreted population density maps are therefore not just technical products. They are instruments of equity and governance.
It is also worth noting what population density mapping reveals about human behavior and history. Settlement patterns encode the decisions of countless generations: where agriculture was possible, where trade routes ran, where safety could be found, and where opportunity emerged. Reading a population density map with historical awareness turns it into a kind of palimpsest, a layered record of human choices and constraints written across the landscape. That interpretive dimension makes population density mapping as much a humanistic discipline as a technical one.
Population density is not just a statistic. It is a spatial story about how human life organizes itself across the surface of the Earth, shaped by geography, history, economics, and culture in ways that a single number can never fully capture.
The Evolution of Population Mapping
The history of population mapping stretches back further than most people realize. Long before digital GIS systems or satellite imagery, cartographers and statisticians were developing methods to represent human distribution in spatial form. Understanding that history helps explain why modern techniques look the way they do, and why certain conventions and challenges have persisted across centuries of mapmaking.
One of the earliest and most influential examples of population mapping dates to 1837, when the French engineer and statistician Armand Fréchet produced a map showing population distribution across France using shading to indicate density. A few years later, in 1838, the Belgian statistician Adolphe d'Angeville published a comprehensive statistical atlas of France that included choropleth maps representing various demographic variables. These early efforts established the basic visual grammar of population mapping: using color or shading to encode density values across geographic units.[3]
The mid-nineteenth century saw a surge of interest in statistical cartography, driven partly by the growth of national census programs and partly by the urgent need to understand the social conditions of rapidly industrializing cities. John Snow's famous 1854 map of cholera cases in London's Soho district is perhaps the most celebrated early example of using spatial data to understand a public health crisis. By plotting individual cases as dots on a street map, Snow was able to identify the Broad Street water pump as the source of the outbreak, a finding that helped establish the germ theory of disease and demonstrated the power of spatial visualization for practical problem-solving.[4]
Through the late nineteenth and early twentieth centuries, population mapping became increasingly systematic as national census programs expanded and cartographic techniques improved. The development of dot density maps, which represent population by placing dots of uniform value across a geographic area, allowed cartographers to show distribution more intuitively than shaded choropleth maps. Large-scale demographic atlases were produced for many countries, and population mapping became a standard tool of government planning and academic geography.
The real transformation came with the digital revolution. The development of Geographic Information Systems (GIS) in the 1960s and 1970s, pioneered by researchers like Roger Tomlinson at the Canada Land Inventory, created the computational infrastructure for modern spatial analysis. GIS allowed analysts to layer multiple datasets, perform complex spatial calculations, and produce maps at scales and resolutions that were previously impossible. By the 1990s, desktop GIS software like ArcGIS had brought these capabilities to a much wider audience of professionals and researchers.[5]
Satellite remote sensing added another dimension to population mapping. By the early 2000s, researchers had developed methods to estimate population density from satellite imagery, using indicators like nighttime light emissions, building footprints, and land cover classifications to infer where people lived even in areas with poor census coverage. Projects like the LandScan Global Population Database, developed by Oak Ridge National Laboratory, and the WorldPop project at the University of Southampton produced gridded population datasets at resolutions of 1 kilometer or finer, covering the entire globe.[6]
The most recent phase of evolution has been driven by big data and machine learning. Mobile phone records, social media activity, GPS traces, and e-commerce data all contain signals about where people are and how they move. Researchers have developed methods to use these alternative data sources to supplement or correct traditional census-based population estimates, producing near-real-time population maps that capture daily and seasonal fluctuations in human distribution. This shift from static snapshots to dynamic, continuously updated population maps represents a fundamental change in what population density mapping can do and what questions it can answer.
Each phase of this evolution has brought new capabilities but also new challenges. Digital tools have made it easier to produce maps, but they have also made it easier to produce misleading ones. The abundance of data has created new questions about privacy and consent. The democratization of mapping has expanded who can create population maps, but it has also expanded the potential for misuse. Understanding this history is not just an academic exercise. It provides essential context for the technical and ethical choices that every population mapper faces today.
The tools have changed dramatically, but the fundamental challenge has remained constant: how do you represent the complexity of human distribution in a form that is accurate, comprehensible, and useful? That question runs through every chapter of this book, and it is worth keeping in mind as you work through the techniques and applications ahead.
What You'll Learn in This Book
This book is organized to take you through population density mapping in a logical progression, from foundational concepts to advanced applications. Each chapter builds on the ones before it, so working through the book in order will give you the most coherent understanding. That said, if you have specific needs or gaps in your knowledge, each chapter is also designed to stand on its own as a reference.
The first section of the book establishes the conceptual and data foundations you need before you can work effectively with population density maps. Chapter 1 covers the fundamentals of population density: what it means, how it is measured, and what the major global patterns look like. This chapter addresses common misconceptions about density and introduces the different ways density can be calculated and interpreted depending on the context and scale of analysis.
Chapter 2 dives into data sources and collection methods, which is arguably the most critical foundation for any mapping work. You will learn about:
- National and international census programs and how their data is structured
- Remote sensing and satellite-based population estimation methods
- Alternative data sources including mobile phone records, social media, and commercial datasets
- How to assess data quality, identify limitations, and account for uncertainty in your maps
The middle section of the book covers the core technical skills of population density mapping. Chapter 3 introduces the four main mapping techniques: choropleth maps, dot density maps, heat maps, and cartograms. Each technique has specific strengths and weaknesses, and choosing the right one for your data and your question is a skill in itself. Chapter 4 then addresses classification and normalization methods, which determine how raw data values are translated into visual categories. This is an area where small technical choices can have large effects on how a map is interpreted, and the chapter gives you the tools to make those choices deliberately rather than by default.
Chapter 5 provides a practical guide to GIS tools and software, covering both commercial platforms like ArcGIS and QGIS and web-based tools like Mapbox and Google Earth Engine. Rather than providing exhaustive software tutorials, this chapter focuses on helping you understand the landscape of available tools and choose the right one for your specific needs and resources. It also covers the fundamental GIS concepts that apply across all platforms, so the knowledge transfers regardless of which software you use.
The application chapters form the heart of the book. These chapters show how population density mapping is used in practice across four major domains:
- Chapter 6 covers urban planning and development, including infrastructure planning, urban growth analysis, and housing and service distribution
- Chapter 7 addresses public health and epidemiology, including disease mapping, health disparity analysis, and pandemic response
- Chapter 8 explores environmental and climate applications, including impact assessment, climate vulnerability mapping, and natural resource management
- Chapter 9 focuses on interpretation and analysis, giving you frameworks for reading population maps critically and identifying meaningful spatial patterns
Chapter 10 covers visualization design and communication, which is often underemphasized in technical mapping education but is essential for making your work useful to others. A technically accurate map that is poorly designed will not communicate effectively. This chapter covers design principles, color theory, symbolization choices, and the art of telling stories with population data. It includes practical guidance on adapting your visualizations for different audiences, from technical specialists to general public stakeholders.
The final chapter before the conclusion addresses ethical considerations and data privacy, which is a topic that deserves serious attention in any work involving demographic data. Population density maps can be powerful tools for equity and justice, but they can also be misused to justify discrimination, surveillance, or the misallocation of resources. Chapter 11 covers privacy concerns, representation bias, and the principles of responsible mapping practice. These are not abstract philosophical questions. They are practical issues that arise in real mapping projects, and having a framework for addressing them is part of being a competent professional in this field.
Throughout the book, you will find several recurring features designed to make the content as practical and actionable as possible:
- Concrete examples drawn from real projects and published research, with specific details about methods, data sources, and outcomes
- Step-by-step frameworks for common tasks like selecting a classification scheme, evaluating data quality, or designing a map for a specific audience
- Common pitfalls and how to avoid them, drawn from the most frequent mistakes made by practitioners at all levels
- Footnotes and citations pointing to primary sources and further reading for topics where you want to go deeper
By the time you finish this book, you should be able to approach a population density mapping project with confidence at every stage: selecting appropriate data sources, choosing the right mapping technique, applying sound classification and normalization methods, using GIS tools effectively, interpreting the results critically, designing clear and honest visualizations, and navigating the ethical dimensions of working with demographic data. That is a broad skill set, and no single book can make you an expert in all of it. But this book will give you a solid, integrated foundation that you can build on through practice and continued learning.
Population density mapping sits at the intersection of science, design, and social responsibility. It draws on statistics, geography, computer science, and visual communication, and it serves purposes that range from the deeply technical to the profoundly human. The chapters ahead are an invitation to engage with all of those dimensions, to develop not just technical competence but genuine understanding of what population density maps can reveal, what they can obscure, and how to use them in ways that make a real difference in the world.
Notes
Introduction
- 1. M. Batty, The New Science of Cities, MIT Press, 2013
- 2. S. Hamidi and others, "Does Density Aggravate the COVID-19 Pandemic?," Journal of the American Planning Association, 2020
- 3. A. H. Robinson, Early Thematic Mapping in the History of Cartography, University of Chicago Press, 1982
- 4. S. Johnson, The Ghost Map, Riverhead Books, 2006
- 5. R. Tomlinson, Thinking About GIS, ESRI Press, 2007
- 6. A. J. Tatem, WorldPop, open data for spatial demography, Scientific Data, 2017
This is the end of the free sample. The full book has 11 chapters.
Want this book written for you?
Tell us your goals and background, and get your own version of this book, tailored by AI to you.


Benefits of AI-tailored books
- Read one book, not ten:
- all the GIS knowledge you need, gathered into a single book.
- Save days of learning:
- tell us your goals, choose your topics, and the whole book is built around them.
- Learn effortlessly:
- GIS book written for your specific background and expertise.
- Understand at a glance:
- includes charts, tables, timelines, checklists, decision trees, and more.
- Stay current:
- written the day you order it, not years ago.
- Trust what you read:
- every book is checked for accuracy, with real research when your subject needs it.
Create your unique book in 3 steps
- 1. Select your focus
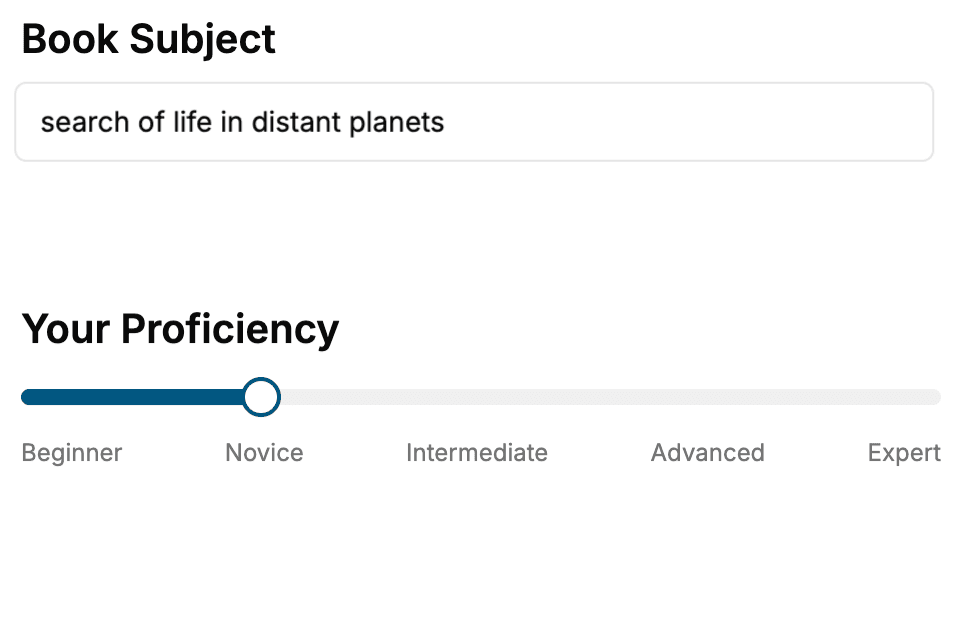
Select the focus of your GIS book and share your background
- 2. Personalize your book
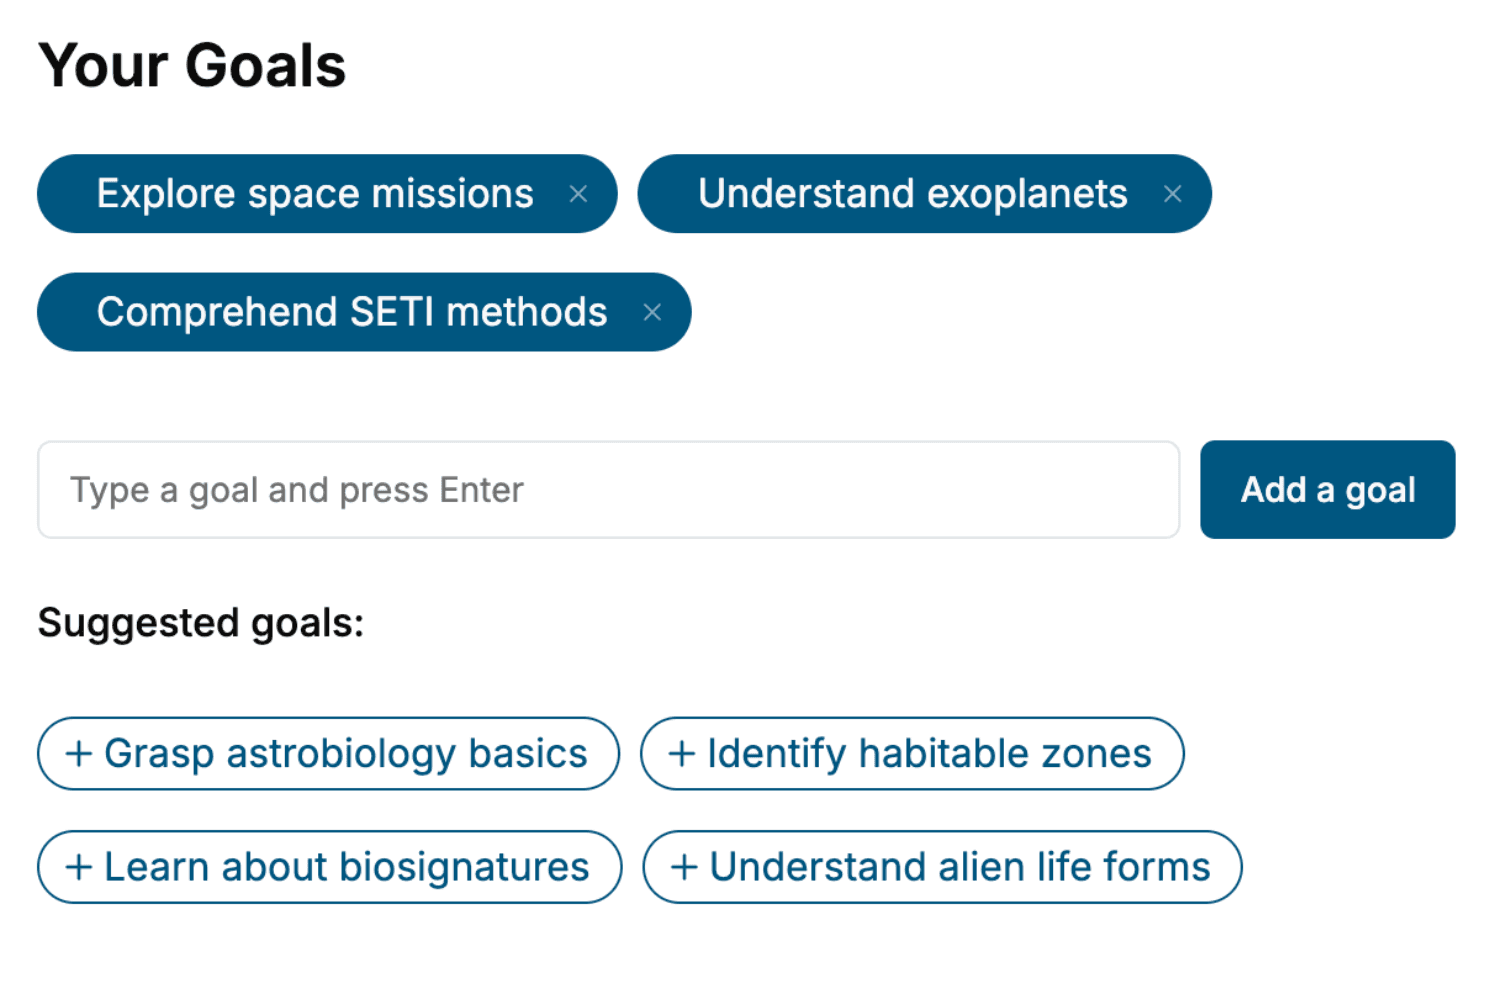
Specify your goals and choose sub-topics to include
- 3. Get your tailored book
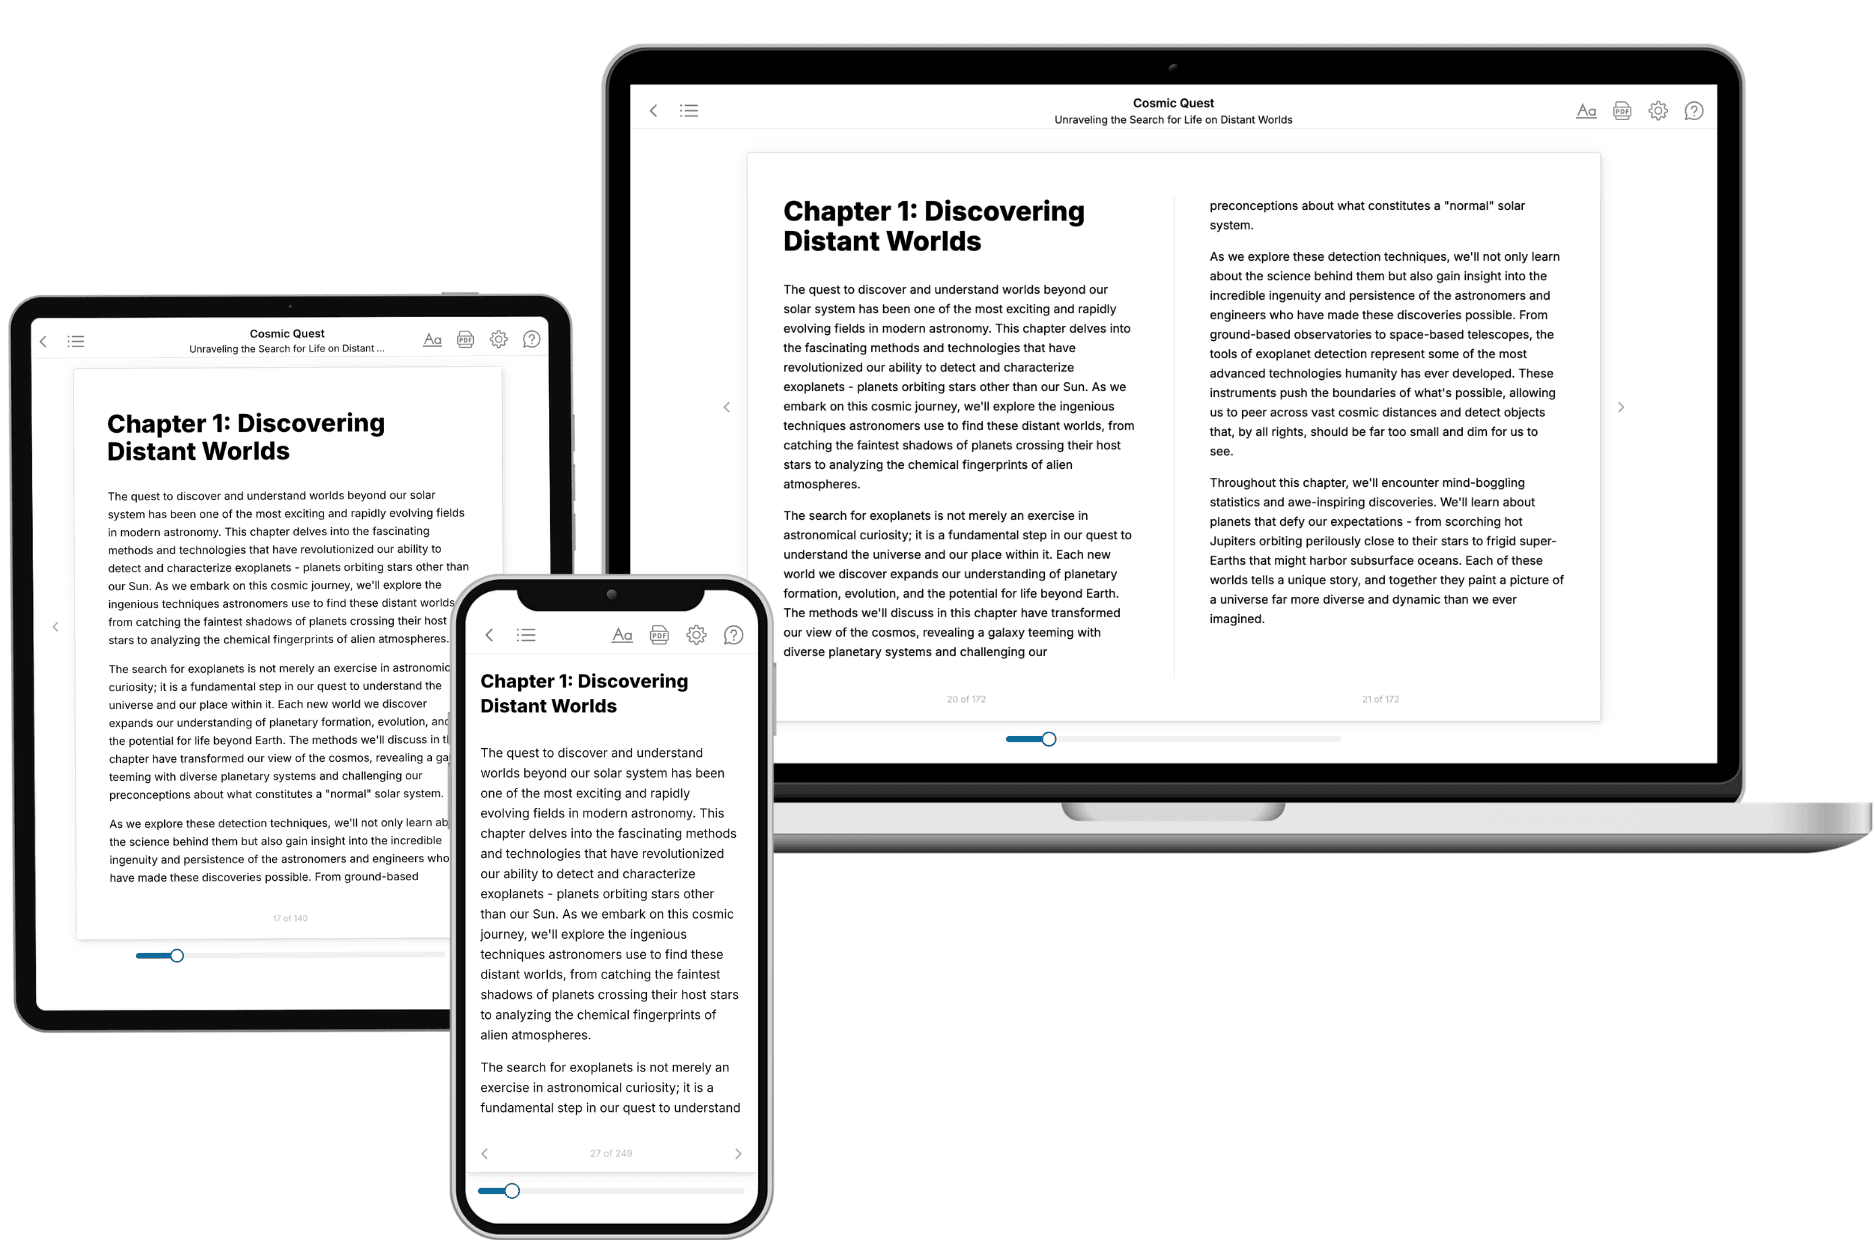
Your book is ready in 10 minutes. Read it online, download as EPUB or PDF, or send to Kindle.
Frequently asked questions
- What is TailoredRead?
TailoredRead creates complete, full-length nonfiction ebooks, written specifically for you. Tell us what you want to learn and why, and TailoredRead writes you a complete ebook on it, with charts, tables, and diagrams throughout. Read it online, on Kindle, or on any e-reader, or download it as a PDF or EPUB. Every book is written fresh the day you order it.
- How is the book tailored to me?
Before anything is written, you answer a few short questions about your goals, your background, and the topics you care about. Your book is then planned around your answers: written at your level, focused on your goals, and covering the topics you chose, instead of the one-size-fits-all book a store sells everyone.
- Will it read like generic AI content?
No. Your book isn't a chat transcript: it's planned chapter by chapter before a single word is written, told in a clear book voice, and explains ideas visually with charts, tables, and diagrams. After writing, every book goes through an editorial pass that polishes chapters so the book reads consistent from start to finish. Judge for yourself: browse thousands of sample books on our Explore Books page.
- How accurate is the content?
Our AI first checks whether your subject needs live research. Niche and fast-moving subjects are researched before writing, and the book plan and chapters are grounded in what it finds. After writing, every book goes through a quality pass that checks its facts and consistency, and researched books list their sources in a Notes section at the back.
- How long is the book?
You choose the length: Comprehensive (250-300 pages), Detailed (150-200 pages), Essential (70-100 pages), or Short (30-50 pages).
- Does the book include visuals?
Yes. Every book includes charts, tables, and diagrams: timelines, checklists, step-by-step guides, decision trees, comparison tables, matrices, and bar charts. A typical book includes dozens of these visual elements.
- Can I read it on Kindle? What formats can I download?
Yes. Every book can be read in our online reader or downloaded as a PDF or EPUB. The EPUB can be opened with Kindle, Apple Books, Kobo, and any e-reader. The Commercial and Author licenses also include an editable Word (DOCX) and Markdown download.
- How much does it cost?
About the price of a regular ebook. The exact price depends on your book's length and complexity, from $2 for the shortest books to $35 for the most comprehensive, and it's shown when you review your book, before you commit to anything. Each book is a one-time purchase, yours to keep, no subscription. Licenses that let you share, teach, or publish your book range from $35.99 to $49.99.
- Can I preview the book before purchasing?
Before you pay, you'll see what your book will cover: the title, a detailed description, the estimated length, and the complete chapter-by-chapter table of contents, so you know what you're getting before you decide. The full text itself is written after you purchase.
- How long does it take to create a book?
About 10 minutes. You can start reading the opening chapters while the rest is still being written.