Probabilistic Graphical Models
Master the Logic of Uncertainty and Complex Relationships
Master the powerful framework that bridges logic and probability to model uncertainty in complex systems.
191 pages10 chaptersJul 14, 2026Machine Learning
About this book
Probabilistic graphical models provide a structured way to represent relationships between variables, encode domain knowledge, and perform intelligent reasoning under uncertainty. This book guides you through the fundamental concepts, mathematical foundations, and practical applications of Bayesian networks, Markov networks, and factor graphs. You'll learn how to construct models that capture real-world dependencies, implement efficient inference algorithms, and extract meaningful insights from incomplete data. Whether you're working in artificial intelligence, machine learning, medical diagnosis, or any field requiring logical reasoning with uncertainty, this comprehensive guide equips you with both theoretical understanding and practical skills. Discover how to leverage graphical models to make better decisions, build more interpretable AI systems, and solve problems where traditional logic alone falls short.
Table of contents
- IntroductionWhy Graphical Models Matter, Where Logic Meets Probability, What You'll Learn in This Book, How to Use This BookRead below
- Chapter 1: Foundations of Probability and LogicProbability Fundamentals, Conditional Probability and Independence, Logical Reasoning and Inference, Bridging Logic and Probability
- Chapter 2: Graph Theory EssentialsGraph Fundamentals, Directed Acyclic Graphs, Undirected Graphs and Cliques, Graph Properties and Algorithms
- Chapter 3: Bayesian NetworksStructure and Semantics of Bayesian Networks, Conditional Probability Tables and Parameters, D-Separation and Conditional Independence, Building Practical Bayesian Networks
- Chapter 4: Markov Networks and Undirected ModelsStructure and Semantics of Markov Networks, Factors, Potentials, and Energy Functions, Markov Blankets and Local Conditional Independence, Applications of Markov Networks
- Chapter 5: Factor Graphs and Unified FrameworksIntroduction to Factor Graphs, Converting Between Model Types, Advantages for Inference and Learning
- Chapter 6: Inference AlgorithmsExact Inference Methods, Variable Elimination Algorithm, Belief Propagation and Message Passing, Approximate Inference Techniques
- Chapter 7: Learning Model StructureStructure Learning Fundamentals, Score-Based Learning Approaches, Constraint-Based Learning Approaches, Avoiding Overfitting and Model Selection
- Chapter 8: Learning Model ParametersMaximum Likelihood Estimation, Bayesian Parameter Learning, Expectation-Maximization Algorithm, Learning from Incomplete Data
- Chapter 9: Real-World ApplicationsMedical Diagnosis and Healthcare, Natural Language Processing, Computer Vision and Image Analysis, Finance, Robotics, and Beyond
- Chapter 10: Advanced Topics and ExtensionsTemporal Models and Hidden Markov Models, Continuous Variables and Gaussian Models, Hybrid Models and Mixed Variables
- ConclusionKey Takeaways, Your Next Steps
Introduction
Every day, the world asks you to make decisions with incomplete information. A doctor looks at a patient's symptoms and tries to figure out the most likely diagnosis. An engineer monitors sensor readings from a complex machine and tries to predict when something might fail. A spam filter reads an email and decides whether it belongs in your inbox or your trash. In each of these situations, the challenge is the same: how do you reason carefully and systematically when you don't know everything you'd like to know? That question sits at the heart of this book.
Probabilistic graphical models, often abbreviated as PGMs, are a family of mathematical tools designed to answer exactly that question. They combine two powerful ideas: the structured relationships captured by graphs, and the language of probability that lets you quantify uncertainty. The result is a framework that can represent complex systems with many interacting variables, encode what you know about how those variables relate to each other, and then perform principled reasoning to answer questions even when data is missing or noisy. PGMs are not a niche academic curiosity. They power real systems in medicine, robotics, natural language processing, and computer vision.
This book is written for learners who already have some familiarity with probability and basic logic, but who want to go deeper. You don't need a graduate degree in mathematics to follow along. What you do need is curiosity, a willingness to think carefully about structure and relationships, and a desire to build models that actually work on real problems. The chapters ahead will take you from foundational concepts through practical algorithms and into genuine applications, building your understanding step by step. By the end, you'll have both the theoretical grounding and the practical skills to construct, analyze, and apply graphical models in your own work.
Before diving into the technical content, this introduction sets the stage. It explains why graphical models matter, how they connect the worlds of logic and probability, what you'll learn across the chapters, and how to get the most out of reading this book. Think of this as your orientation before the journey begins.
Why Graphical Models Matter
The world is full of systems where many things influence each other at once. Think about the weather: temperature, humidity, wind speed, cloud cover, and atmospheric pressure all interact in complicated ways. Or think about a social network, where the opinions and behaviors of individuals are shaped by the people around them. Traditional statistical tools often struggle with these kinds of systems because they either ignore the relationships between variables or require you to model every possible interaction explicitly, which becomes computationally impossible as the number of variables grows.
Graphical models solve this problem by using a graph to encode which variables are directly related to each other. Instead of tracking every possible combination of variables, you only need to specify the local relationships. This is sometimes called the locality principle, and it's what makes graphical models both interpretable and computationally tractable. A graph with 20 variables might have only 30 or 40 edges, each representing a meaningful dependency, rather than the millions of parameters you'd need to describe all possible interactions without any structure.
Consider a concrete example from medicine. Suppose you want to model the relationship between a patient's smoking history, their lung condition, whether they have a positive X-ray result, and whether they experience shortness of breath. These four variables don't all directly influence each other. Smoking affects the lung condition, and the lung condition affects both the X-ray result and the shortness of breath. A graphical model captures this chain of influence explicitly, so when you observe that a patient has shortness of breath, you can reason backward through the graph to update your belief about whether they smoke or have a lung condition. This kind of structured reasoning is exactly what makes PGMs so powerful in practice.[1]
Beyond interpretability, graphical models offer something that many modern machine learning approaches do not: transparency. When you build a neural network with millions of parameters, it can be very hard to understand why it makes a particular prediction. A graphical model, by contrast, makes its assumptions explicit in the graph structure. You can look at the model and see exactly which variables are assumed to influence which others. This transparency is not just aesthetically pleasing. It matters enormously in high-stakes domains like healthcare, law, and finance, where you need to be able to explain and justify your reasoning.
Graphical models also provide a natural way to incorporate domain knowledge. If you're a medical expert who knows that a certain disease causes certain symptoms, you can encode that knowledge directly into the graph structure before you ever look at any data. This is a significant advantage over purely data-driven approaches, which need large amounts of data to discover relationships that an expert already knows. In practice, the best graphical model applications combine expert knowledge with data-driven learning, getting the best of both worlds.
Finally, graphical models are not just a single tool but a whole family of related frameworks. Bayesian networks, Markov networks, factor graphs, hidden Markov models, and Gaussian graphical models are all members of this family. Each has its own strengths and is suited to different kinds of problems. Learning graphical models means gaining access to a rich toolkit that you can adapt to a wide range of challenges, from analyzing genetic data to building intelligent dialogue systems.
Key insight: Graphical models matter because they make complex, multi-variable reasoning tractable, interpretable, and principled. They let you encode what you know, represent what you're uncertain about, and compute answers to questions that would otherwise be intractable.
Where Logic Meets Probability
For most of the history of artificial intelligence, logic and probability were treated as separate tools for separate problems. Logic was the language of certainty: if A is true and A implies B, then B must be true. Probability was the language of uncertainty: if there's a 70% chance of rain, you might want to bring an umbrella. These two frameworks seemed to live in different worlds, and for a long time, researchers in AI had to choose one or the other depending on the problem they were working on.
The trouble with pure logic is that the real world is rarely certain. A doctor can't say with absolute certainty that a patient has pneumonia just because they have a fever and a cough. There are many possible explanations, and the evidence only makes some of them more or less likely. Classical logical inference breaks down when you try to apply it to noisy, incomplete, real-world data. You end up with systems that are brittle: they work perfectly when all the conditions are exactly right, but fail completely when anything is uncertain or missing.
The trouble with pure probability, on the other hand, is that it can become computationally overwhelming when you have many variables. If you have 100 binary variables and you want to represent a full joint probability distribution over all of them, you need to store 2100 numbers. That's more numbers than there are atoms in the observable universe. Without some structure to exploit, probabilistic reasoning over complex systems is simply not feasible.
Graphical models resolve this tension by bringing structure to probability. The graph encodes logical relationships between variables: this variable depends on that one, these two are conditionally independent given a third. Those structural relationships are essentially logical statements about the world. But the edges in the graph carry probabilistic weights, so the model can represent degrees of belief rather than just true or false. The result is a framework that has the expressive power of logic and the flexibility of probability at the same time.
This synthesis has deep roots. The philosopher Rudolf Carnap spent much of his career trying to develop a logic of probability, a formal system that could reason about degrees of belief the way classical logic reasons about truth.[2] Judea Pearl's development of Bayesian networks in the 1980s can be seen as a practical realization of that vision. Pearl showed that if you represent dependencies as a directed graph, you can perform probabilistic inference efficiently using algorithms that look a lot like logical deduction, passing messages through the graph to update beliefs based on evidence.
One of the most important concepts that emerges from this synthesis is conditional independence. In logic, you might say that two facts are unrelated. In probability, you say that two variables are independent given some third variable. Graphical models make these independence relationships visible in the graph structure, so you can read off which variables are relevant to a query and which can be safely ignored. This is what makes inference tractable: instead of considering all variables at once, you can focus on the relevant parts of the graph.
Understanding where logic meets probability also helps you appreciate the limits of each approach. Pure logical systems can't handle noise or uncertainty. Pure probabilistic systems without structure can't scale to complex problems. Graphical models occupy a productive middle ground, and that's precisely why they've become so central to modern AI and machine learning. As you work through this book, you'll see this synthesis in action again and again, in the structure of Bayesian networks, in the inference algorithms, and in the learning methods.
Example: Consider diagnosing whether a network server is overloaded. Logically, you might say: "If CPU usage is high AND memory usage is high, then the server is overloaded." But in practice, these relationships are probabilistic. A graphical model lets you say: "High CPU usage makes overload more likely, and high memory usage also makes it more likely, and these two signals are somewhat correlated." You get the structure of logical reasoning with the flexibility of probabilistic belief.
What You'll Learn in This Book
This book is organized to take you from the ground up. It starts with the mathematical foundations you need, builds through the core model types, covers the algorithms that make inference and learning possible, and then shows you how everything comes together in real-world applications. Each chapter builds on the ones before it, so the order matters. That said, if you already have strong foundations in a particular area, the structure makes it easy to skip ahead and come back when you need a refresher.
The first two chapters establish the foundations. Chapter 1 reviews probability theory and logical reasoning, making sure you have a solid grasp of the concepts that graphical models are built on. This includes joint and conditional probability, Bayes' theorem, and the basics of logical inference. Chapter 2 covers the graph theory you'll need: what graphs are, how directed and undirected graphs differ, and what properties like connectivity and cycles mean for the models you'll build.
The next three chapters introduce the three main types of graphical models:
- Chapter 3: Bayesian Networks. These use directed acyclic graphs to represent causal or conditional relationships. You'll learn how to read the structure of a Bayesian network, how to specify the conditional probability tables that define the model, and how to use a concept called d-separation to determine which variables are conditionally independent.
- Chapter 4: Markov Networks. These use undirected graphs to represent symmetric relationships. You'll learn about factors and potential functions, the Markov blanket concept, and why undirected models are particularly well-suited to problems like image segmentation and social network analysis.
- Chapter 5: Factor Graphs. These provide a unified framework that can represent both Bayesian and Markov networks. You'll see how factor graphs make certain inference algorithms cleaner and more general.
Chapters 6 through 8 focus on the algorithms that bring graphical models to life. Chapter 6 covers inference: given a model and some observed evidence, how do you compute the probability of something you care about? You'll learn exact methods like variable elimination and belief propagation, as well as approximate methods for when exact inference is too expensive. Chapter 7 covers structure learning: how do you figure out the right graph structure from data? Chapter 8 covers parameter learning: once you have a structure, how do you estimate the numerical probabilities from data, including when some data is missing?
Chapter 9 brings everything together with real-world applications. You'll see how graphical models are used in medical diagnosis, natural language processing, and computer vision, with concrete examples that show how the theory translates into practice. Chapter 10 extends the framework to more advanced topics, including temporal models like hidden Markov models, continuous variables and Gaussian graphical models, and hybrid models that mix discrete and continuous variables.
Throughout the book, you'll encounter worked examples, concrete scenarios, and practical guidance. The goal is not just to understand the theory but to be able to apply it. By the time you finish, you should be able to:
- Identify when a problem is a good candidate for a graphical model approach.
- Choose between Bayesian networks, Markov networks, and factor graphs based on the problem structure.
- Construct a model by specifying its graph structure and parameters.
- Apply inference algorithms to answer probabilistic queries.
- Learn model structure and parameters from data.
- Evaluate and compare models to avoid overfitting.
- Connect graphical model concepts to related ideas in machine learning and AI.
One thing worth noting is that this book deliberately balances mathematical rigor with practical accessibility. The mathematics is not avoided, because you genuinely need it to understand what's happening and why. But every mathematical concept is introduced with motivation and illustrated with examples before being formalized. If you find a section mathematically dense, slow down, work through the examples, and don't hesitate to revisit earlier material. The concepts build on each other, and a solid understanding of the foundations pays dividends throughout.
How to Use This Book
This book is designed to be read sequentially, especially for the first time through. The concepts in later chapters genuinely depend on the ones introduced earlier, and skipping ahead can leave you with gaps that make the material harder to follow. That said, once you've read through the book once, it works well as a reference. Each chapter is relatively self-contained, and the index and table of contents make it easy to find specific topics when you need to revisit them.
Your background will shape how you engage with different parts of the book. If you're already comfortable with probability theory and Bayes' theorem, you can move through Chapter 1 quickly, treating it as a review. If graph theory is new to you, spend extra time with Chapter 2 and make sure you're comfortable with the terminology before moving on. The chapters on inference algorithms (Chapter 6) and learning (Chapters 7 and 8) are the most technically demanding, and it's worth working through the examples carefully rather than just reading them.
Here are some practical strategies for getting the most out of each chapter:
- Work through the examples actively. Don't just read the examples passively. Try to work out the answer yourself before reading the solution. This is especially important for inference problems, where the process of working through the steps is what builds intuition.
- Draw the graphs. Whenever a graphical model is described, draw it out on paper or a whiteboard. Visualizing the structure is essential for understanding how the model works and what the independence assumptions mean.
- Connect concepts to problems you care about. As you read, think about problems in your own domain that might be amenable to a graphical model approach. Trying to apply concepts to familiar problems is one of the best ways to solidify understanding.
- Don't skip the foundations. It can be tempting to jump straight to the applications in Chapter 9, but the applications will make much more sense if you understand the underlying machinery. The foundations are worth the investment.
If you're using this book as part of a course or study group, the chapter structure maps naturally onto a semester-length curriculum. Chapters 1 and 2 work well as a two-week foundation unit. Chapters 3 through 5 cover the core model types and can occupy three to four weeks. Chapters 6 through 8 on inference and learning are the technical core and deserve four to five weeks. Chapters 9 and 10 on applications and advanced topics round out the course. This pacing gives you time to work through problems and build genuine understanding rather than just surface familiarity.
For self-directed learners, a reasonable pace is one chapter per week, with time set aside to work through examples and think about applications. Some chapters, particularly the ones on inference algorithms, may take longer. That's fine. Depth of understanding matters more than speed. If you find yourself reading a section and feeling like you understand it but can't explain it in your own words, that's a signal to slow down and engage more actively with the material.
It's also worth saying something about the mathematical notation used throughout the book. Probability and graphical models have a fairly standard notation that you'll encounter in research papers and other textbooks, and this book follows those conventions. Capital letters like X and Y typically denote random variables. Lowercase letters like x and y denote specific values those variables can take. The notation P(X | Y) means the probability of X given that Y is observed. These conventions are introduced carefully when they first appear, but it helps to be aware that notation is a tool for precision, not an obstacle. Once you're comfortable with it, the notation actually makes things clearer.
Finally, this book is not the last word on probabilistic graphical models. It's an introduction to a rich and active field. The conclusion points toward further reading and next steps for those who want to go deeper. Research in this area continues to advance rapidly, with new connections being drawn between graphical models and deep learning, causal inference, and probabilistic programming. The foundations you build here will serve you well as you explore those frontiers. The goal is to give you a solid enough understanding that you can read research papers, engage with more advanced texts, and contribute to the field yourself if that's where your interests take you.
A note on prerequisites: You'll get the most from this book if you're comfortable with basic probability (joint distributions, conditional probability, Bayes' theorem), elementary linear algebra (vectors and matrices), and basic programming concepts. You don't need to be an expert in any of these areas, but familiarity will help. Chapter 1 reviews the probability concepts most essential to the rest of the book, so even if you're a bit rusty, you'll have a chance to refresh before the material gets demanding.
This is the end of the free sample. The full book has 10 chapters.
Want this book written for you?
Tell us your goals and background, and get your own version of this book, tailored by AI to you.


Benefits of AI-tailored books
- Read one book, not ten:
- all the Machine Learning knowledge you need, gathered into a single book.
- Save days of learning:
- tell us your goals, choose your topics, and the whole book is built around them.
- Learn effortlessly:
- Machine Learning book written for your specific background and expertise.
- Understand at a glance:
- includes charts, tables, timelines, checklists, decision trees, and more.
- Stay current:
- written the day you order it, not years ago.
- Trust what you read:
- every book is checked for accuracy, with real research when your subject needs it.
Create your unique book in 3 steps
- 1. Select your focus
Select the focus of your Machine Learning book and share your background
- 2. Personalize your book
Specify your goals and choose sub-topics to include
- 3. Get your tailored book
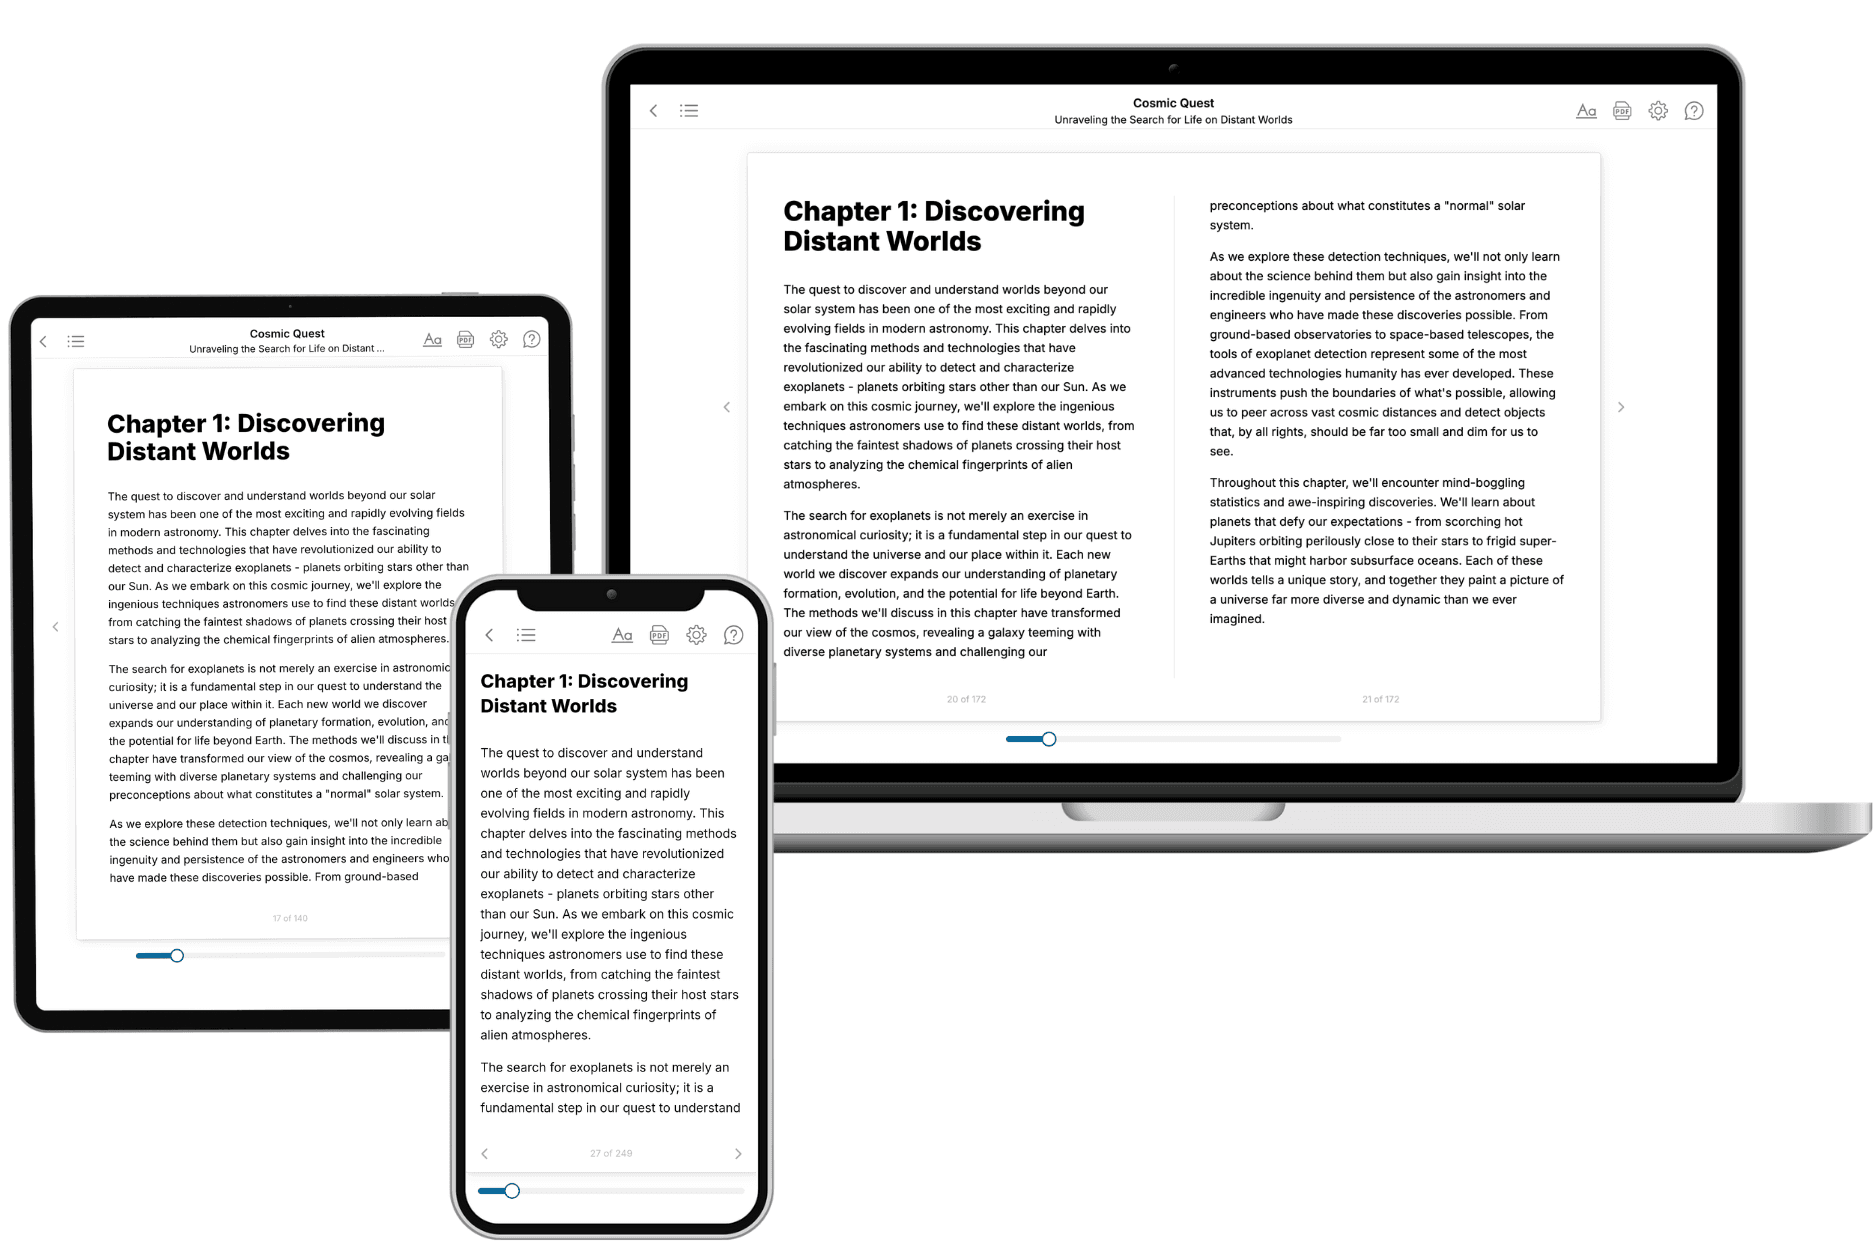
Your book is ready in 10 minutes. Read it online, download as EPUB or PDF, or send to Kindle.
Frequently asked questions
- What is TailoredRead?
TailoredRead creates complete, full-length nonfiction ebooks, written specifically for you. Tell us what you want to learn and why, and TailoredRead writes you a complete ebook on it, with charts, tables, and diagrams throughout. Read it online, on Kindle, or on any e-reader, or download it as a PDF or EPUB. Every book is written fresh the day you order it.
- How is the book tailored to me?
Before anything is written, you answer a few short questions about your goals, your background, and the topics you care about. Your book is then planned around your answers: written at your level, focused on your goals, and covering the topics you chose, instead of the one-size-fits-all book a store sells everyone.
- Will it read like generic AI content?
No. Your book isn't a chat transcript: it's planned chapter by chapter before a single word is written, told in a clear book voice, and explains ideas visually with charts, tables, and diagrams. After writing, every book goes through an editorial pass that polishes chapters so the book reads consistent from start to finish. Judge for yourself: browse thousands of sample books on our Explore Books page.
- How accurate is the content?
Our AI first checks whether your subject needs live research. Niche and fast-moving subjects are researched before writing, and the book plan and chapters are grounded in what it finds. After writing, every book goes through a quality pass that checks its facts and consistency, and researched books list their sources in a Notes section at the back.
- How long is the book?
You choose the length: Comprehensive (250-300 pages), Detailed (150-200 pages), Essential (70-100 pages), or Short (30-50 pages).
- Does the book include visuals?
Yes. Every book includes visual elements such as timelines, checklists, step-by-step guides, decision trees, comparison tables, and matrices, and many include bar charts. A typical book includes dozens of these visual elements.
- Can I read it on Kindle? What formats can I download?
Yes. Every book can be read in our online reader or downloaded as a PDF or EPUB. The EPUB can be opened with Kindle, Apple Books, Kobo, and any e-reader. The Commercial and Author licenses also include an editable Word (DOCX) and Markdown download.
- How much does it cost?
About the price of a regular ebook. The exact price depends on your book's length and complexity, from $2 for the shortest books to $35 for the most comprehensive, and it's shown when you review your book, before you commit to anything. Each book is a one-time purchase, yours to keep, no subscription. Licenses that let you share, teach, or publish your book range from $35.99 to $49.99.
- Can I preview the book before purchasing?
Before you pay, you'll see what your book will cover: the title, a detailed description, the estimated length, and the complete chapter-by-chapter table of contents, so you know what you're getting before you decide. The full text itself is written after you purchase.
- How long does it take to create a book?
About 10 minutes. You can start reading the opening chapters while the rest is still being written.