Probability Distributions Demystified
Master the Math Behind Real-World Uncertainty and Data Patterns
Many people struggle with probability distributions because they seem abstract and disconnected from real life.
207 pages10 chaptersDec 20, 2025Statistics
About this book
You might understand the formulas but wonder why they matter or how to actually use them. This book bridges that gap by showing you that probability distributions are simply mathematical descriptions of uncertainty—tools that help you understand patterns in data and make better decisions. You'll start with the fundamental concepts that make everything else click into place, then progress through the most important distributions you'll encounter: binomial, normal, and exponential. Each chapter builds on the previous one, using clear explanations, practical examples, and visual intuition rather than overwhelming mathematics. By the end, you'll not only understand how distributions work but also recognize them in real-world situations—from test scores to weather patterns to business forecasting. You'll gain the confidence to interpret statistical information critically and apply these concepts to solve actual problems.
Table of contents
- IntroductionWhy Probability Distributions Matter, What You'll Learn in This Book, How to Use This BookRead below
- Chapter 1: Foundations of ProbabilityBasic Probability Concepts, Sample Spaces and Events, Calculating Probabilities
- Chapter 2: What Are Probability Distributions?From Single Events to Patterns, Discrete vs. Continuous Distributions, Visualizing Distributions
- Chapter 3: Describing Distributions: Mean, Variance, and Standard DeviationThe Mean: Center of Gravity, Variance and Spread, Standard Deviation: A Practical Measure
- Chapter 4: The Binomial DistributionWhen to Use the Binomial Distribution, Calculating Binomial Probabilities, Binomial Distribution in Action
- Chapter 5: The Normal DistributionWhy Normal Is Everywhere, Properties of the Normal Distribution, The 68-95-99.7 Rule
- Chapter 6: Working with the Normal DistributionStandardization and Z-Scores, Finding Probabilities with the Normal Distribution, Reverse Problems: Finding Values from Probabilities
- Chapter 7: Other Important DistributionsThe Exponential Distribution, The Uniform Distribution, When to Use Which Distribution
- Chapter 8: Probability Density and Cumulative FunctionsProbability Density Functions (PDFs), Cumulative Distribution Functions (CDFs), Reading and Interpreting Both Functions
- Chapter 9: The Central Limit TheoremWhat the Central Limit Theorem Says, Why It Matters, Applying the Central Limit Theorem
- Chapter 10: Real-World Applications and Problem SolvingIdentifying Distributions in Data, Solving Practical Problems, Common Pitfalls and How to Avoid Them
- ConclusionYour Next Steps
- Glossary of Key Terms
Introduction
Probability distributions are everywhere, even if you don't realize it yet. When a weather forecaster says there's a 70% chance of rain, they're using probability distributions. When a company decides how much inventory to stock, they're relying on these mathematical models. When doctors interpret medical test results or engineers design safety systems, probability distributions guide their decisions. These tools transform uncertainty from something vague and intimidating into something you can measure, understand, and work with systematically. The challenge is that most people encounter probability distributions as abstract formulas in textbooks, disconnected from the real-world patterns they describe. This book changes that by showing you how these mathematical concepts connect directly to the uncertainty you encounter every day.
You might have some experience with basic statistics—perhaps you've calculated averages or percentages—but probability distributions take your understanding to the next level. They don't just tell you what happened in the past; they help you predict what might happen in the future and quantify how confident you should be in those predictions. Think of probability distributions as lenses that bring fuzzy, uncertain situations into focus. Without them, you're guessing. With them, you're making informed decisions based on mathematical principles that have been tested and refined over centuries. The good news is that you don't need advanced mathematics to grasp the core concepts. What you need is clear explanations, practical examples, and a willingness to see the patterns that surround you.
This introduction sets the stage for your journey through probability distributions. You'll discover why these concepts matter beyond the classroom, what specific skills and knowledge you'll gain from this book, and how to approach the material for maximum understanding. Whether you're studying for a course, preparing for a career that uses data analysis, or simply curious about how uncertainty works, this book provides the foundation you need. The goal isn't to memorize formulas—it's to develop intuition about how probability distributions work and confidence in applying them to real situations. By the end of this book, you'll recognize probability distributions in news articles, business reports, and scientific studies. You'll understand what the numbers mean and how to use them to make better decisions.
Why Probability Distributions Matter
Probability distributions matter because they provide a systematic way to understand and work with uncertainty. Life is full of situations where you can't predict exactly what will happen, but you can describe the range of possibilities and how likely each one is. Consider a simple example: if you flip a fair coin ten times, you won't get exactly five heads every time. Sometimes you'll get four, sometimes six, occasionally three or seven. A probability distribution tells you not just that different outcomes are possible, but precisely how probable each outcome is. This transforms vague statements like it could go either way
into specific, actionable information like there's a 24.6% chance of getting exactly five heads.
This precision makes all the difference when you're making decisions that matter.
In professional contexts, probability distributions are essential tools for risk assessment and planning. Financial analysts use them to model investment returns and calculate the probability of losses exceeding certain thresholds. Manufacturing companies use them to set quality control standards and predict defect rates. Healthcare researchers use them to determine whether new treatments are genuinely effective or whether observed improvements might be due to chance. Insurance companies build their entire business model on probability distributions, calculating premiums based on the likelihood of various claims. Without understanding these distributions, professionals in these fields would be operating on intuition alone, unable to quantify risks or make data-driven decisions. The mathematical framework that probability distributions provide turns guesswork into science.
Beyond professional applications, probability distributions help you think more clearly about everyday decisions and evaluate information critically. When you read that a medical test is 95% accurate,
understanding probability distributions helps you ask the right follow-up questions: 95% accurate at detecting the condition when it's present, or 95% accurate at ruling it out when it's absent? What's the base rate of the condition in the population? These questions matter enormously for interpreting what a positive or negative test result actually means for you. Similarly, when political polls report margins of error, or when scientific studies report confidence intervals, you're encountering concepts rooted in probability distributions. Understanding these concepts protects you from misinterpreting statistics and helps you make better-informed decisions about health, finances, and other important aspects of life.
Probability distributions also reveal deep patterns in nature and human behavior that aren't immediately obvious. Many phenomena follow predictable patterns even though individual instances are unpredictable. Human heights cluster around an average with a characteristic spread. The time between arrivals at a service counter follows a specific mathematical pattern. Test scores, measurement errors, and countless other variables follow distributions that mathematicians have studied and characterized. Recognizing these patterns gives you insight into how the world works. When you understand that certain types of events naturally follow a normal distribution while others follow an exponential distribution, you can make predictions and spot anomalies. You develop an intuition for what's typical and what's unusual, what's random variation and what might indicate a real change or problem.
The power of probability distributions extends to their role as building blocks for more advanced statistical methods. Nearly every statistical technique you'll encounter—from hypothesis testing to regression analysis to machine learning algorithms—relies on assumptions about probability distributions. Understanding the foundations means you'll grasp not just how to use these techniques, but why they work and when they're appropriate. You'll recognize when assumptions are violated and know what that means for your conclusions. This foundational knowledge compounds over time. Each new statistical concept you learn will make more sense because you understand the probability distributions underneath. Rather than memorizing disconnected procedures, you'll see how everything fits together into a coherent framework for reasoning about data and uncertainty.
Perhaps most importantly, probability distributions change how you think about certainty and uncertainty. In everyday language, people often speak in absolutes: something will definitely happen or definitely won't happen. But most real-world situations exist in the gray area between these extremes. Probability distributions give you a language and framework for thinking precisely about this gray area. Instead of feeling paralyzed by uncertainty, you can quantify it, work with it, and make rational decisions despite it. This shift in thinking—from seeking impossible certainty to working effectively with quantified uncertainty—is one of the most valuable skills you can develop. It applies far beyond mathematics, influencing how you approach problems, evaluate evidence, and make decisions in every area of life.
Understanding probability distributions also helps you communicate more effectively about uncertain situations. When you can say based on this distribution, there's a 15% chance of exceeding our target
instead of we might exceed our target,
you're providing information that others can actually use. You're enabling better collective decision-making. In team settings, business contexts, or any situation where you need to explain risks and possibilities to others, the precision that probability distributions provide makes your communication clearer and more credible. You move from subjective opinions to objective analysis, from vague concerns to quantified risks. This doesn't mean eliminating judgment—human judgment remains essential—but it means grounding that judgment in solid mathematical reasoning that others can examine, question, and build upon.
What You'll Learn in This Book
This book takes you on a carefully structured journey from fundamental probability concepts to practical applications of the most important probability distributions. You'll start by building a solid foundation in basic probability—understanding sample spaces, events, and how to calculate probabilities systematically. These fundamentals are essential because probability distributions are built on top of them. You'll learn to think about probability not as mysterious or arbitrary, but as a logical system with clear rules. This foundation includes understanding what probability actually means, how to combine probabilities for different events, and how to avoid common logical errors that trip up even experienced practitioners. By the time you move to distributions themselves, you'll have the conceptual tools you need to understand them deeply rather than just memorizing formulas.
The core of the book focuses on the probability distributions you'll encounter most frequently in real-world applications. You'll master the binomial distribution, which models situations with a fixed number of yes-or-no trials—like the number of successful sales calls out of twenty attempts, or the number of defective items in a batch. You'll understand exactly when this distribution applies and how to calculate probabilities for specific outcomes. Then you'll dive deep into the normal distribution, the most important distribution in all of statistics. You'll learn why so many real-world phenomena follow this bell-shaped curve, how to work with it mathematically, and how to use it to make predictions and assess probabilities. The book also covers the exponential distribution for modeling waiting times and the uniform distribution for situations where all outcomes in a range are equally likely. For each distribution, you'll learn not just the mathematics but the intuition—when to recognize it, how to apply it, and what it tells you about the situation you're analyzing.
You'll develop practical skills for working with these distributions, not just theoretical knowledge. This includes learning how to calculate key parameters like mean, variance, and standard deviation—the numbers that completely characterize a distribution's behavior. You'll understand what these parameters mean intuitively and how changes in them affect the distribution's shape and the probabilities it assigns to different outcomes. You'll learn to work with both probability density functions (PDFs) and cumulative distribution functions (CDFs), understanding how these two perspectives on the same distribution complement each other. The PDF tells you about the relative likelihood of different values, while the CDF tells you the probability of being below a certain threshold. Both perspectives are valuable, and you'll learn when to use each one.
A major focus of the book is developing your ability to solve real-world problems using probability distributions. You'll work through numerous examples that show how to:
- Identify which distribution applies to a given situation based on the characteristics of the problem
- Set up the problem mathematically by identifying the relevant parameters
- Calculate probabilities for specific outcomes or ranges of outcomes
- Interpret your results in the context of the original problem
- Make decisions based on probability calculations, weighing risks and benefits
You'll also learn about the Central Limit Theorem, one of the most powerful results in all of statistics. This theorem explains why the normal distribution appears so frequently in nature and why it's so useful for statistical inference. Understanding the Central Limit Theorem gives you insight into how sample averages behave, why larger samples give more reliable results, and how to quantify the uncertainty in estimates based on sample data. This connects probability distributions to the broader field of statistical inference, showing you how these mathematical models enable us to draw conclusions about populations based on samples. The Central Limit Theorem is the bridge between descriptive statistics (summarizing data you have) and inferential statistics (making predictions about data you don't have).
Throughout the book, you'll develop visual intuition for probability distributions. You'll learn to interpret graphs and charts that display distributions, understanding what different shapes tell you about the underlying data or process. You'll see how changing parameters shifts or stretches a distribution, and what that means for probabilities. This visual understanding complements the mathematical formulas, giving you multiple ways to think about the same concepts. When you can visualize a distribution, you can often estimate probabilities or identify errors without detailed calculations. This intuition is what separates people who merely know formulas from those who truly understand probability distributions and can apply them flexibly to new situations.
Finally, you'll learn to think critically about probability distributions and their limitations. Real-world data rarely fits theoretical distributions perfectly. You'll understand when it's appropriate to use a particular distribution as a model and when the assumptions break down. You'll learn about common pitfalls—like assuming independence when events are actually related, or applying the normal distribution to situations where it doesn't fit. This critical perspective helps you use probability distributions as powerful tools while avoiding the trap of blindly applying formulas to situations where they don't apply. You'll develop the judgment to know when a distribution-based analysis is reliable and when you need to be more cautious or use different approaches. This combination of technical skill and critical judgment is what makes probability distributions truly useful rather than just academically interesting.
How to Use This Book
This book is designed to be read sequentially, with each chapter building on concepts from previous chapters. The structure is deliberate: you need to understand basic probability before you can grasp probability distributions, and you need to understand what distributions are before you can work effectively with specific distributions like the binomial or normal. Resist the temptation to skip ahead to topics that seem immediately relevant to your needs. The foundational chapters might seem basic, but they establish the conceptual framework that makes everything else make sense. Even if you think you already know the basics, reviewing them in the context of this book ensures you're building on solid ground. Many people discover gaps in their understanding when they revisit fundamentals with the goal of truly mastering them rather than just passing a test.
As you read each chapter, engage actively with the material rather than passively absorbing it. This means working through examples yourself before looking at the solutions, pausing to think about how concepts apply to situations from your own experience, and questioning whether you truly understand or are just following along. When you encounter a formula, don't just memorize it—understand what each component represents and why the formula has that particular form. When you see an example, think about how you might modify it or what would happen if the parameters changed. This active engagement transforms reading from a passive activity into a learning experience that builds lasting understanding. The goal isn't to finish the book quickly; it's to finish with genuine comprehension that you can apply.
Pay special attention to the examples throughout the book, as they bridge the gap between abstract concepts and practical applications. Each example is chosen to illustrate not just how to perform calculations, but how to think about the problem. Notice the process: how the problem is translated from words into mathematical terms, which distribution is selected and why, how parameters are identified, and how results are interpreted back in the original context. This problem-solving process is more important than any individual calculation. Try to internalize this approach so you can apply it to new problems you haven't seen before. When you encounter an example, consider covering up the solution and attempting it yourself first. Even if you struggle, the effort primes your brain to understand the solution more deeply when you do read it.
Use the visual representations throughout the book as learning tools, not just illustrations. Graphs of probability distributions convey information that's difficult to express in words or formulas alone. Spend time studying these visualizations, understanding what the axes represent, how the shape relates to the underlying mathematics, and what different features of the graph tell you about probabilities. Try sketching your own rough graphs when working through problems—you don't need artistic skill or perfect accuracy, just a visual representation that helps you think about the problem. Many people find that drawing a distribution helps them understand what a problem is asking and what a reasonable answer might look like. This visual thinking complements algebraic thinking and often reveals insights that pure calculation misses.
When you encounter mathematical notation, take time to become comfortable with it rather than letting it intimidate you. Mathematical notation is simply a precise language for expressing ideas that would be cumbersome in words. Each symbol has a specific meaning, and once you know what it represents, the notation becomes a helpful shorthand rather than an obstacle. The book introduces notation gradually and explains each symbol when it first appears. Keep track of what different symbols mean—you might even maintain your own reference list. Over time, the notation will become familiar and you'll appreciate how it makes complex ideas easier to express and manipulate. Remember that mathematicians use notation not to be obscure, but because it's actually the clearest way to communicate mathematical ideas once you understand the language.
Practice is essential for mastering probability distributions. Reading about concepts creates familiarity, but working through problems builds competence. After completing each chapter, test your understanding by attempting to solve problems without referring back to the text. If you get stuck, that's valuable information—it tells you where your understanding is still shaky. Go back and review that specific concept, then try again. This process of attempting, struggling, reviewing, and re-attempting is how deep learning happens. Don't be discouraged by difficulty; it's a sign that you're working at the edge of your current understanding, which is exactly where learning occurs. The book provides examples and explanations, but your own problem-solving practice is what transforms that information into genuine skill.
Connect the material to your own interests and experiences whenever possible. If you work in business, think about how probability distributions apply to sales forecasting, inventory management, or customer behavior. If you're interested in science, consider how they apply to experimental data and measurement uncertainty. If you're studying for academic purposes, relate the concepts to other courses you're taking. These personal connections make the material more meaningful and memorable. They also help you see probability distributions as practical tools rather than abstract mathematics. When you encounter probability distributions in your work or studies after finishing this book, you'll recognize them and know how to apply what you've learned. This transfer from book learning to real-world application is the ultimate goal.
Finally, be patient with yourself and maintain realistic expectations about the learning process. Probability distributions involve both conceptual understanding and technical skill, and both take time to develop. You won't master everything on first reading, and that's completely normal. Some concepts will click immediately while others require multiple exposures and considerable practice. What matters is steady progress, not instant mastery. If you find yourself confused, slow down rather than pushing forward. Confusion is often a sign that you're missing a prerequisite concept or making an incorrect assumption. Go back, review, and make sure you truly understand before moving on. The time you invest in building solid understanding pays dividends throughout the rest of the book and beyond. By the end, you'll have developed a valuable skill set that applies across many domains and a way of thinking about uncertainty that will serve you for years to come.
This is the end of the free sample. The full book has 10 chapters.
Want this book written for you?
Tell us your goals and background, and get your own version of this book, tailored by AI to you.


Benefits of AI-tailored books
- Read one book, not ten:
- all the Statistics knowledge you need, gathered into a single book.
- Save days of learning:
- tell us your goals, choose your topics, and the whole book is built around them.
- Learn effortlessly:
- Statistics book written for your specific background and expertise.
- Understand at a glance:
- includes charts, tables, timelines, checklists, decision trees, and more.
- Stay current:
- written the day you order it, not years ago.
- Trust what you read:
- every book is checked for accuracy, with real research when your subject needs it.
Create your unique book in 3 steps
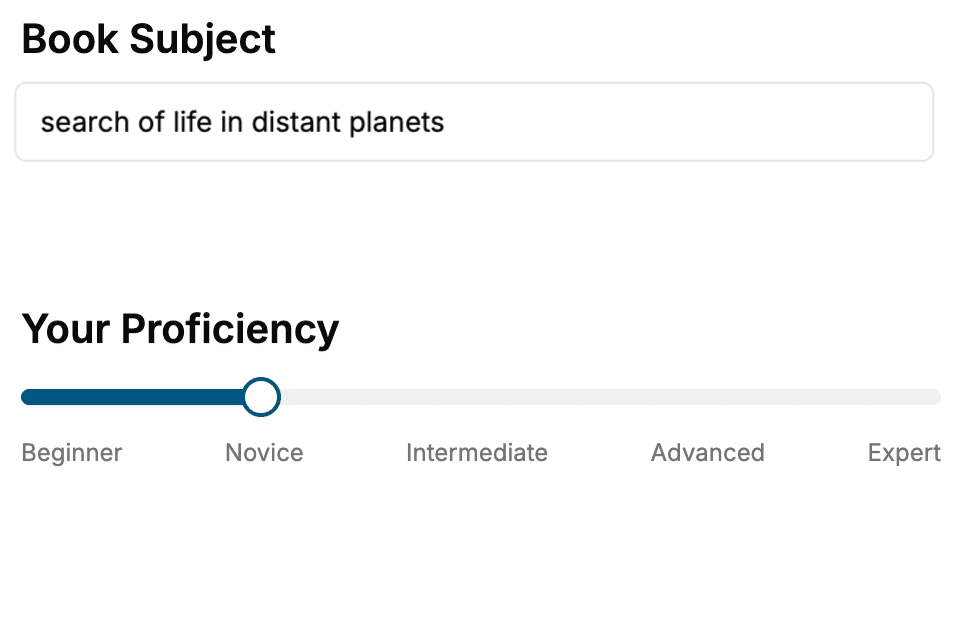
- 1. Select your focus
Select the focus of your Statistics book and share your background
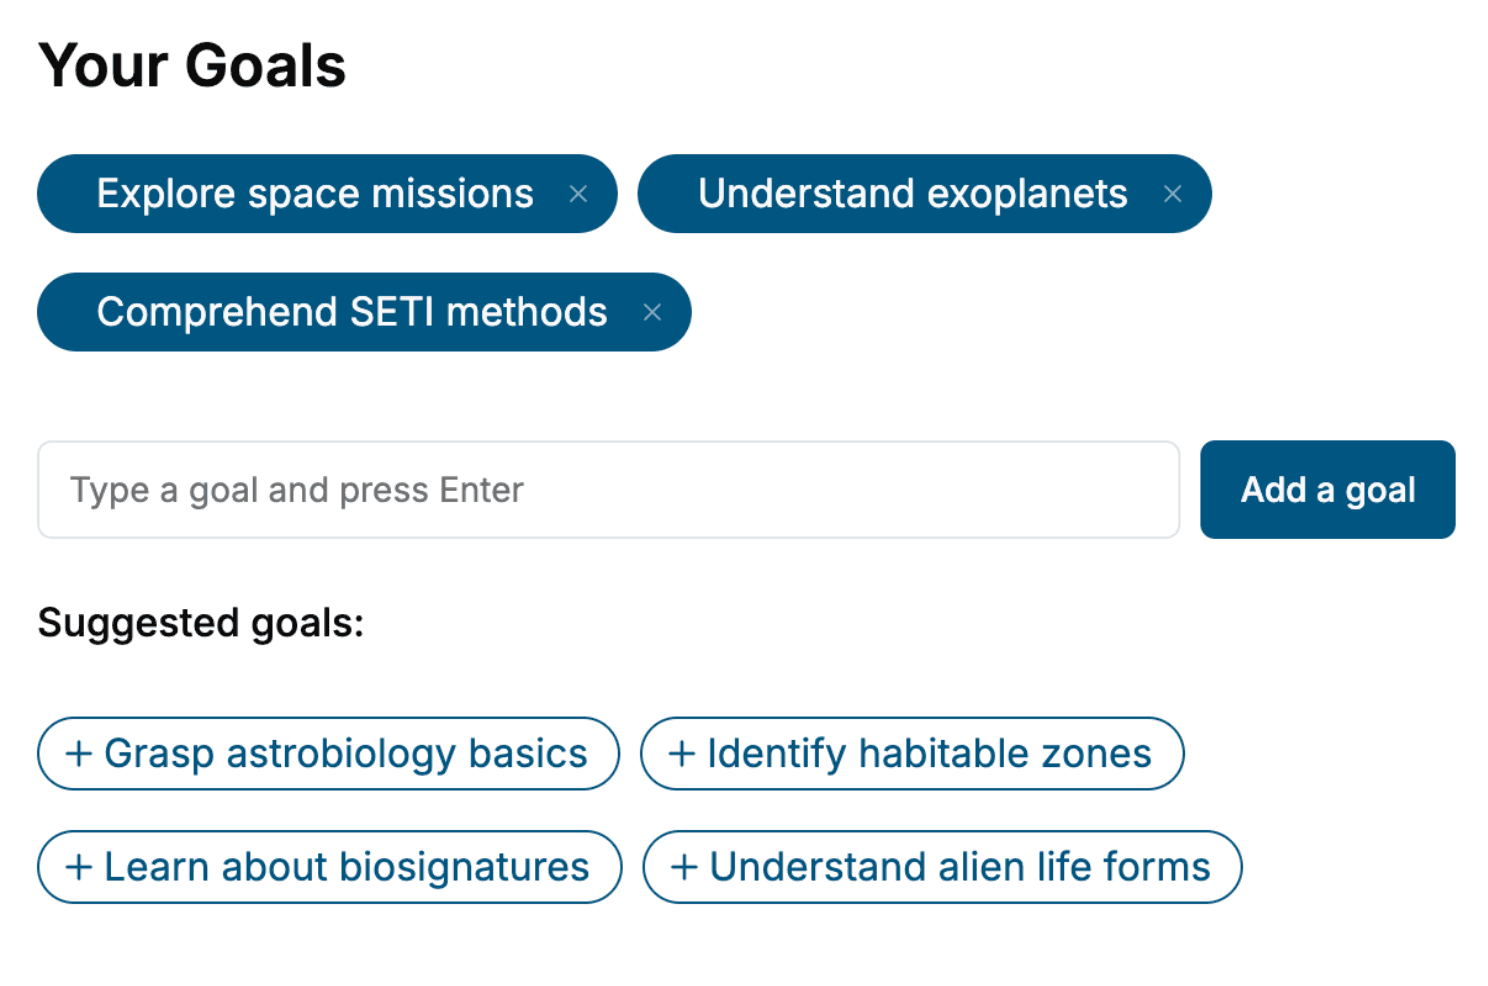
- 2. Personalize your book
Specify your goals and choose sub-topics to include
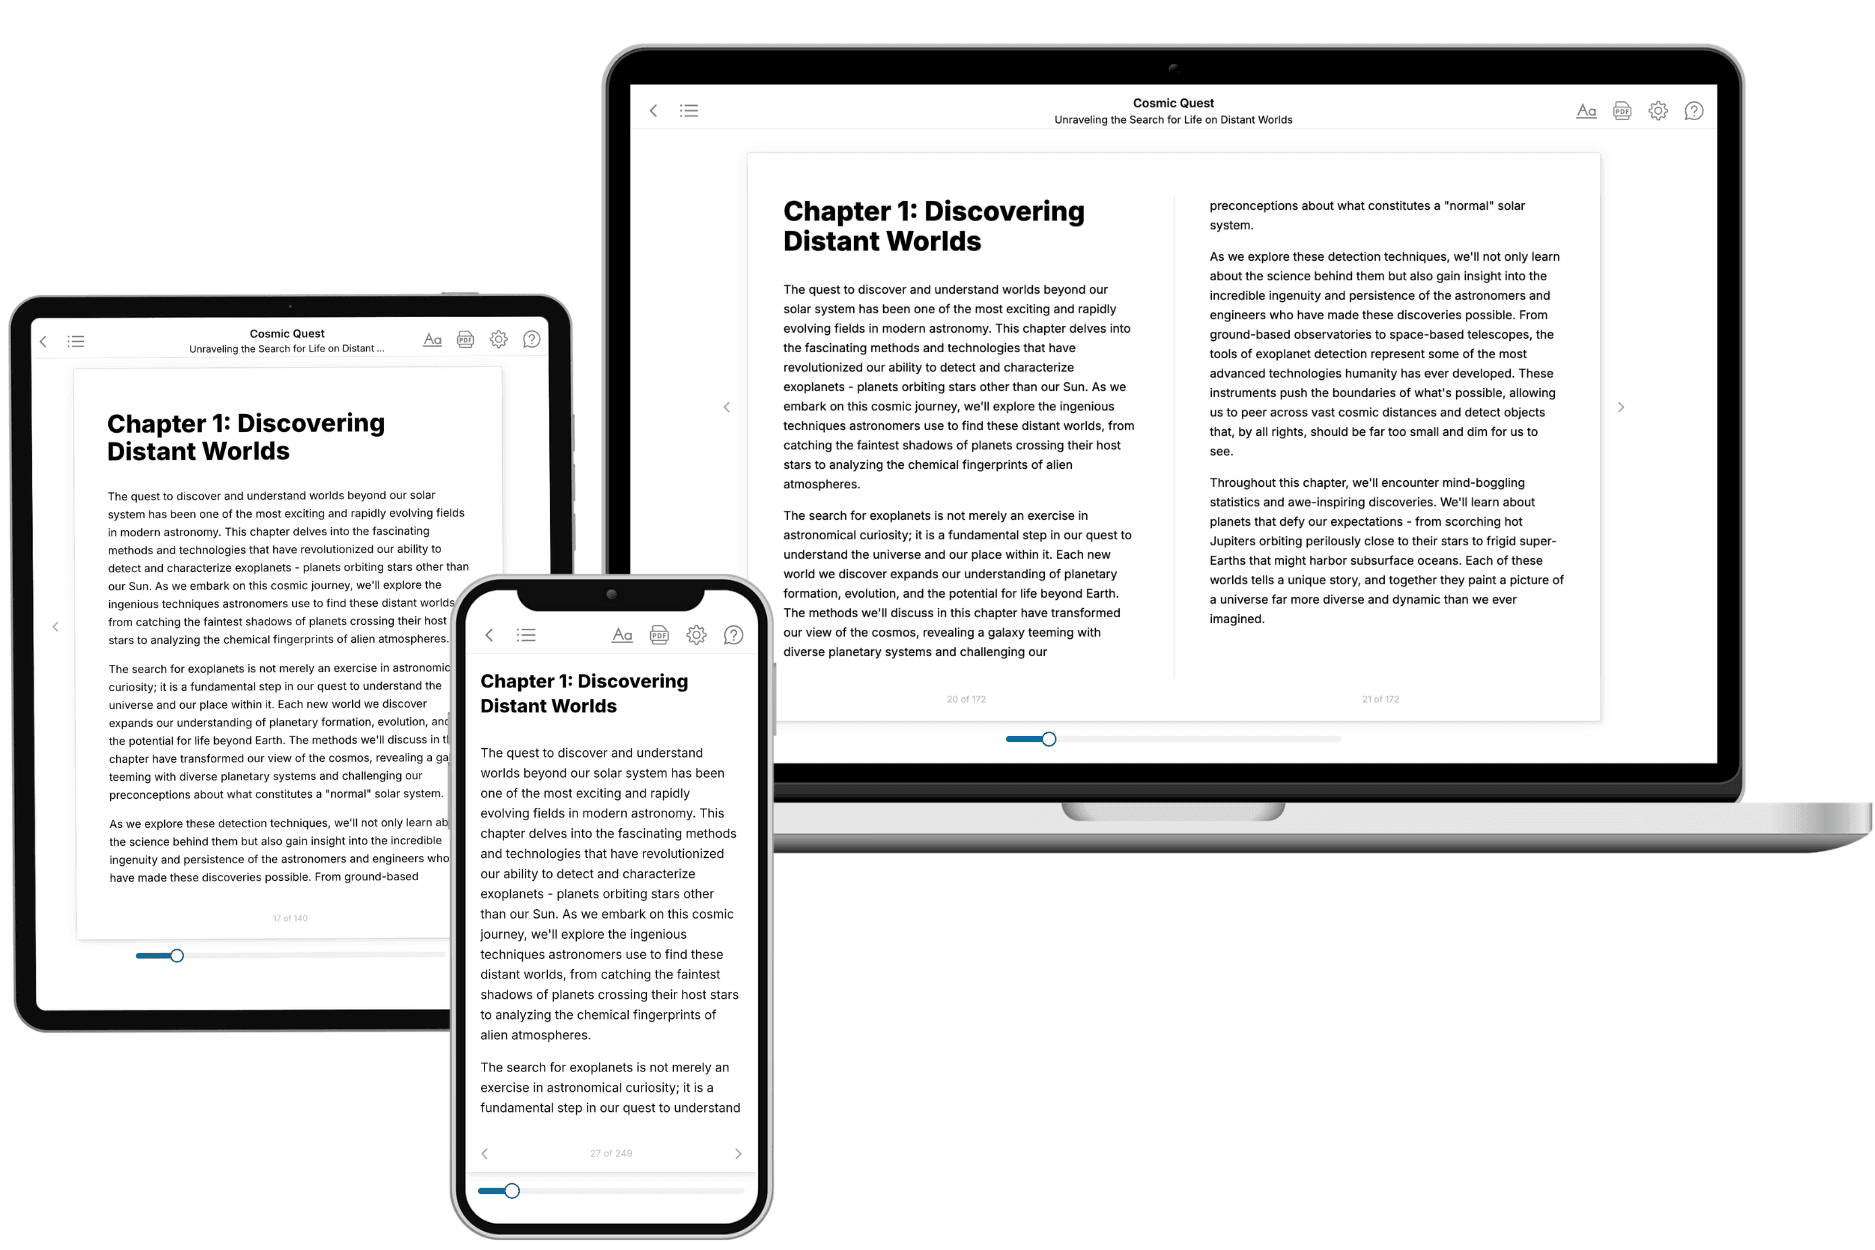
- 3. Get your tailored book
Your book is ready in 10 minutes. Read it online, download as EPUB or PDF, or send to Kindle.
Frequently asked questions
- What is TailoredRead?
TailoredRead creates complete, full-length nonfiction ebooks, written specifically for you. Tell us what you want to learn and why, and TailoredRead writes you a complete ebook on it, with charts, tables, and diagrams throughout. Read it online, on Kindle, or on any e-reader, or download it as a PDF or EPUB. Every book is written fresh the day you order it.
- How is the book tailored to me?
Before anything is written, you answer a few short questions about your goals, your background, and the topics you care about. Your book is then planned around your answers: written at your level, focused on your goals, and covering the topics you chose, instead of the one-size-fits-all book a store sells everyone.
- Will it read like generic AI content?
No. Your book isn't a chat transcript: it's planned chapter by chapter before a single word is written, told in a clear book voice, and explains ideas visually with charts, tables, and diagrams. After writing, every book goes through an editorial pass that polishes chapters so the book reads consistent from start to finish. Judge for yourself: browse thousands of sample books on our Explore Books page.
- How accurate is the content?
Our AI first checks whether your subject needs live research. Niche and fast-moving subjects are researched before writing, and the book plan and chapters are grounded in what it finds. After writing, every book goes through a quality pass that checks its facts and consistency, and researched books list their sources in a Notes section at the back.
- How long is the book?
You choose the length: Comprehensive (250-300 pages), Detailed (150-200 pages), Essential (70-100 pages), or Short (30-50 pages).
- Does the book include visuals?
Yes. Every book includes charts, tables, and diagrams: timelines, checklists, step-by-step guides, decision trees, comparison tables, matrices, and bar charts. A typical book includes dozens of these visual elements.
- Can I read it on Kindle? What formats can I download?
Yes. Every book can be read in our online reader or downloaded as a PDF or EPUB. The EPUB can be opened with Kindle, Apple Books, Kobo, and any e-reader. The Commercial and Author licenses also include an editable Word (DOCX) and Markdown download.
- How much does it cost?
About the price of a regular ebook. The exact price depends on your book's length and complexity, from $2 for the shortest books to $35 for the most comprehensive, and it's shown when you review your book, before you commit to anything. Each book is a one-time purchase, yours to keep, no subscription. Licenses that let you share, teach, or publish your book range from $35.99 to $49.99.
- Can I preview the book before purchasing?
Before you pay, you'll see what your book will cover: the title, a detailed description, the estimated length, and the complete chapter-by-chapter table of contents, so you know what you're getting before you decide. The full text itself is written after you purchase.
- How long does it take to create a book?
About 10 minutes. You can start reading the opening chapters while the rest is still being written.