The Probability and Statistics Handbook
Master the Mathematical Foundations of Data, Uncertainty, and Decision-Making
Imagine confidently analyzing data, understanding uncertainty, and making informed decisions backed by mathematical rigor.
191 pages10 chaptersFeb 27, 2026Probability and Statistics
About this book
This comprehensive handbook guides you through the essential concepts of probability and statistics, building from foundational principles to sophisticated applications. You'll discover how probability quantifies uncertainty, explore the distributions that model real-world phenomena, and master the statistical methods that transform raw data into actionable insights. Whether you're evaluating research claims, analyzing business metrics, or simply seeking to understand the mathematical principles underlying modern data science, this book provides clear explanations, practical examples, and the theoretical depth you need. Each chapter builds systematically on previous concepts, ensuring you develop both intuitive understanding and technical competence. By the end, you'll possess a robust framework for thinking probabilistically and statistically about the world around you.
Table of contents
- IntroductionWhy Probability and Statistics Matter, How to Use This Book, Mathematical Foundations You'll NeedRead below
- Chapter 1: Fundamentals of ProbabilityDefining Probability and Sample Spaces, Basic Rules of Probability, Conditional Probability and Independence, Bayes' Theorem and Updating Beliefs
- Chapter 2: Discrete Probability DistributionsRandom Variables and Probability Mass Functions, The Binomial Distribution, The Poisson Distribution, Other Important Discrete Distributions
- Chapter 3: Continuous Probability DistributionsProbability Density Functions and Cumulative Distribution Functions, The Normal Distribution and Its Properties, Exponential and Uniform Distributions, Applying Continuous Distributions to Real Data
- Chapter 4: Expectation, Variance, and MomentsExpected Value and Its Interpretation, Variance and Standard Deviation, Covariance and Correlation
- Chapter 5: Sampling Distributions and the Central Limit TheoremUnderstanding Sampling Distributions, The Central Limit Theorem Explained, Standard Error and Its Significance
- Chapter 6: Point Estimation and Confidence IntervalsPoint Estimators and Their Properties, Constructing and Interpreting Confidence Intervals, Margin of Error and Sample Size Determination
- Chapter 7: Hypothesis TestingThe Hypothesis Testing Framework, P-Values and Significance Levels, Type I and Type II Errors, Common Hypothesis Tests
- Chapter 8: Correlation and Linear RegressionCorrelation Analysis and Interpretation, Simple Linear Regression, Regression Diagnostics and Model Validation, Causation Versus Correlation
- Chapter 9: Bayesian Methods and Modern ApplicationsThe Bayesian Framework, Prior and Posterior Distributions, Bayesian Inference in Practice
- Chapter 10: Common Pitfalls and MisinterpretationsStatistical Fallacies and Cognitive Biases, P-Hacking, Selection Bias, and Publication Bias, Correctly Interpreting Statistical Results
- ConclusionIntegrating Your Knowledge, Next Steps in Your Learning Journey
Introduction
Every day, you encounter uncertainty. Will it rain this afternoon? Is this new medication actually effective, or did the trial results happen by chance? Should your company invest in a new product line based on survey data from a few hundred customers? These questions all share something in common: they require you to reason carefully about incomplete information. Probability and statistics are the mathematical tools built precisely for this purpose. They give you a rigorous, systematic way to think about uncertainty, draw conclusions from data, and make decisions that hold up under scrutiny.
The reach of these tools is extraordinary. Epidemiologists use statistical models to track the spread of disease and evaluate the effectiveness of vaccines. Engineers apply probability theory to predict when components will fail and design systems with acceptable safety margins. Financial analysts build probabilistic models to assess risk and price complex instruments. Machine learning algorithms, at their core, are sophisticated statistical systems trained to find patterns in data. Even a weather forecast is a probability statement, a carefully computed estimate of how likely different outcomes are given current atmospheric conditions. Probability and statistics are not abstract academic exercises. They are the language of evidence-based reasoning in the modern world.
This handbook is designed to give you a thorough, connected understanding of both fields. It moves from foundational concepts through to sophisticated applications, always keeping one foot in theory and the other in practice. You will not just learn formulas. You will learn why those formulas work, when to use them, and what their results actually mean. Along the way, you will also learn to recognize the common mistakes that trip up even experienced analysts, from misreading p-values to confusing correlation with causation. By the time you finish, you will have a robust framework for thinking probabilistically and statistically about almost any problem you encounter.
Before diving into the chapters themselves, this introduction covers three important pieces of groundwork. First, it makes the case for why probability and statistics deserve your serious attention, with concrete examples from fields you likely care about. Second, it explains how this book is structured and how to get the most out of it depending on your goals and background. Third, it reviews the mathematical prerequisites you will need, so you can honestly assess where you stand and fill any gaps before moving forward. Think of this introduction as your orientation session before the real work begins.
Why Probability and Statistics Matter
It is tempting to think of probability and statistics as tools reserved for scientists and mathematicians. In reality, they shape decisions in virtually every domain of modern life. Consider medicine. When a clinical trial reports that a new drug reduces the risk of heart attack by 30%, that number comes from statistical analysis of patient data. Understanding what that figure actually means, whether it is a relative or absolute risk reduction, how large the study was, and whether the result could have occurred by chance, is essential for both doctors and patients making treatment decisions. Without statistical literacy, you are at the mercy of whoever is presenting the numbers.
Business and economics are equally dependent on these tools. Companies run A/B tests to decide which version of a website converts more customers. Economists use regression analysis to estimate the effect of policy changes on employment. Supply chain managers use probability distributions to model demand uncertainty and set inventory levels. In each case, the quality of the decision depends directly on the quality of the statistical reasoning behind it. A manager who misunderstands confidence intervals, for example, might act on results that are far less certain than they appear.
The rise of data science and machine learning has made statistical fluency even more critical. Algorithms that power recommendation systems, fraud detection, and natural language processing are built on probabilistic foundations. Concepts like Bayesian inference, probability distributions, and maximum likelihood estimation are not optional extras for data scientists. They are the bedrock of the field. Even if you never write a line of machine learning code, understanding these ideas helps you evaluate the outputs of such systems intelligently and critically.
Public policy is another arena where statistical reasoning matters enormously. Debates about crime rates, economic inequality, educational outcomes, and environmental risk all hinge on data interpretation. Poorly understood statistics can lead to bad policy, wasted resources, and real harm to real people. A classic example is the misuse of crime statistics that count raw numbers rather than rates, making a growing city look more dangerous simply because it has more people. Statistical literacy is, in a meaningful sense, a civic skill.
Perhaps most importantly, probability and statistics train a particular kind of thinking. They teach you to ask: How was this data collected? How large was the sample? Could this result be due to chance? What assumptions are baked into this model? These are not just technical questions. They are habits of mind that make you a sharper, more skeptical, and ultimately more effective thinker. The goal of this book is not just to teach you techniques, but to help you develop that mindset.
A concrete illustration: In 2005, researcher John Ioannidis published a landmark paper titled "Why Most Published Research Findings Are False." His argument rested on statistical reasoning about sample sizes, significance thresholds, and the number of hypotheses being tested across a field. The paper sparked a major reckoning in science about reproducibility and research methodology. Understanding his argument requires exactly the kind of statistical thinking this book develops.[1]
The good news is that the core ideas of probability and statistics, while mathematically precise, are fundamentally intuitive once you see them clearly. The challenge is that most people encounter these subjects through rote formula memorization rather than genuine conceptual understanding. This book takes a different approach. Every formula is accompanied by an explanation of what it is actually measuring and why it is defined that way. Every technique is grounded in a real problem it was designed to solve. That combination of rigor and intuition is what makes statistical knowledge stick and become genuinely useful.
How to Use This Book
This handbook is organized as a progressive journey through probability and statistics. Each chapter builds on the concepts introduced in previous ones, so the sequence is deliberate and important. If you are new to the subject or returning after a long gap, reading from beginning to end is strongly recommended. If you already have solid grounding in some areas, you can use the structure below to identify where to start and which chapters to prioritize.
Here is a brief map of the book's structure to help you orient yourself:
- Chapters 1 through 4 cover the foundations of probability theory, including sample spaces, probability rules, conditional probability, Bayes' theorem, discrete and continuous distributions, and the key summary measures of expectation and variance. These chapters form the theoretical core of the book.
- Chapter 5 bridges probability and statistics by introducing sampling distributions and the Central Limit Theorem, which explains why statistical methods work in practice.
- Chapters 6 and 7 cover classical statistical inference: point estimation, confidence intervals, and hypothesis testing. These are the tools most commonly used in research and data analysis.
- Chapter 8 explores correlation and linear regression, including how to build, interpret, and validate regression models, and how to avoid the trap of confusing correlation with causation.
- Chapter 9 introduces Bayesian methods, offering an alternative and increasingly important framework for statistical inference.
- Chapter 10 addresses common pitfalls, fallacies, and misinterpretations that can undermine even technically correct analyses.
Each chapter is designed to be self-contained enough that you can revisit individual sections as reference material after your first read-through. Key terms are highlighted in bold when first introduced, and important results are called out clearly so they are easy to find when you need them. Examples are woven throughout, not collected at the end, because seeing a concept applied immediately after it is introduced is the most effective way to build understanding.
To get the most out of this book, engage actively with the material rather than reading passively. When a formula appears, pause and think about what each component represents before moving on. When an example is presented, try to work through the reasoning yourself before reading the solution. This kind of active engagement is what separates readers who finish a book with genuine understanding from those who finish it feeling like they followed along but cannot apply anything independently.
You will also benefit from keeping a few tools handy as you work through the chapters. A scientific calculator or access to a computational tool like Python, R, or even a spreadsheet application will let you verify calculations and experiment with the concepts. For example, when Chapter 3 introduces the normal distribution, you can immediately explore how changing the mean and standard deviation shifts and stretches the curve. That kind of hands-on experimentation accelerates understanding significantly.
Suggested reading paths by goal:
- Building foundational understanding: Read all chapters in order, spending extra time on Chapters 1, 2, 3, and 5.
- Preparing for data science or machine learning: Prioritize Chapters 1, 3, 4, 5, 6, 7, and 9.
- Improving research literacy and critical thinking: Focus on Chapters 1, 5, 6, 7, 8, and 10.
- Refreshing knowledge for professional use: Use the table of contents to target specific topics, then read Chapter 10 regardless.
Finally, do not be discouraged if some concepts require multiple passes. Probability and statistics contain ideas that are genuinely subtle. The Central Limit Theorem, the correct interpretation of a confidence interval, and the logic of Bayesian updating are all concepts that even experienced practitioners sometimes get wrong. Encountering difficulty is not a sign that you are not capable. It is a sign that you are engaging with ideas that have real depth. Return to difficult sections, try different examples, and trust that the understanding will come with persistence.
Mathematical Foundations You'll Need
This book assumes you have a foundational level of mathematical comfort, but it does not require advanced mathematics. The goal here is to be honest about what background knowledge will make your experience smoother, so you can assess where you stand and prepare accordingly. The good news is that the prerequisites are more modest than many people expect. You do not need calculus to understand most of the book, though some sections on continuous distributions will be clearer if you have encountered the concept of an integral before.
The most important prerequisite is comfort with algebra. You should be able to rearrange equations, work with fractions and percentages, and follow multi-step algebraic derivations without getting lost. For example, understanding the formula for variance requires you to be comfortable with expressions like (x - μ)² and to understand what it means to sum a series of such terms. If algebra feels rusty, a brief review of core algebraic manipulation will pay dividends throughout the book.
A working understanding of set notation is also helpful, particularly for the early chapters on probability. Sets are collections of elements, and probability theory uses set operations to describe events. The key concepts to be familiar with are:
- Union (A ∪ B): the event that A or B or both occur
- Intersection (A ∩ B): the event that both A and B occur
- Complement (Aᶜ or A'): the event that A does not occur
- Subset (A ⊆ B): every element of A is also in B
These concepts are introduced and explained in Chapter 1, so you do not need to master them beforehand. But if you have seen them before, the early chapters will feel more natural. If set notation is entirely new to you, consider spending an hour with a basic introduction before starting Chapter 1. Many free resources online cover this material clearly and concisely.
Summation notation appears frequently throughout the book. The symbol Σ (sigma) is used to represent the sum of a series of terms. For example, the expression Σᵢ xᵢ means "add up all the values of x." If you have not encountered this notation before, it is worth learning the basics before proceeding. It is not complicated, but seeing it for the first time in the middle of a formula can be disorienting. Here is a simple example to illustrate:
Σᵢ₌₁ⁿ xᵢ = x₁ + x₂ + x₃ + ... + xₙ

Example: If x = {2, 4, 6, 8}, then Σxᵢ = 2 + 4 + 6 + 8 = 20
For the chapters on continuous distributions (Chapter 3 and parts of Chapter 4), some exposure to basic calculus is beneficial. Specifically, understanding what an integral represents geometrically, as the area under a curve, will help you grasp why probability density functions work the way they do. You do not need to be able to compute complex integrals by hand. The conceptual picture is what matters most. If calculus is unfamiliar territory, the relevant sections include enough explanation that you can still follow the core ideas, but some of the finer details may require supplementary reading.
Logarithms and exponentials appear in several distributions and in the discussion of likelihood functions in later chapters. You should be comfortable with the idea that log(ab) = log(a) + log(b) and that the natural logarithm ln is the inverse of the exponential function eˣ. These properties are used in deriving and working with distributions like the Poisson and exponential distributions. Again, a brief review if needed will make those sections much smoother.
Beyond specific mathematical tools, the most important foundation is a general comfort with abstract reasoning. Probability and statistics require you to think carefully about definitions, to distinguish between similar-sounding concepts, and to follow logical arguments step by step. This is a skill that develops with practice. If you find yourself confused by a definition or argument, the right response is to slow down and work through it carefully, not to skip ahead and hope it becomes clear later. The concepts in this book are interconnected, and gaps in understanding tend to compound as you progress.
To summarize the mathematical prerequisites clearly:
- Essential: Algebra, fractions and percentages, basic set notation, summation notation
- Helpful: Basic calculus concepts (especially the idea of integration as area), logarithms and exponentials
- Not required: Advanced calculus, linear algebra, differential equations (though these become relevant if you pursue more advanced study after this book)
If you find that your mathematical background has gaps in the essential areas, do not let that stop you from starting. Many of the conceptual ideas in the early chapters can be grasped without heavy computation. But do plan to address those gaps in parallel, because the later chapters will require more mathematical fluency. The investment is absolutely worth it. Mathematical tools are not obstacles to understanding probability and statistics. They are the precise language that makes the ideas clear and unambiguous in a way that plain English simply cannot achieve.
One final note on notation: this book uses standard mathematical conventions throughout, but always introduces notation explicitly when it first appears. You will never encounter a symbol that has not been defined. If you ever feel uncertain about what a symbol means, check back to where it was first introduced. Building the habit of tracking notation carefully is itself a valuable mathematical skill, and one that will serve you well far beyond the pages of this book.
Notes
Introduction
- 1. J. P. A. Ioannidis, "Why Most Published Research Findings Are False," PLOS Medicinee124, 2005
This is the end of the free sample. The full book has 10 chapters.
Want this book written for you?
Tell us your goals and background, and get your own version of this book, tailored by AI to you.


Benefits of AI-tailored books
- Read one book, not ten:
- all the Probability and Statistics knowledge you need, gathered into a single book.
- Save days of learning:
- tell us your goals, choose your topics, and the whole book is built around them.
- Learn effortlessly:
- Probability and Statistics book written for your specific background and expertise.
- Understand at a glance:
- includes charts, tables, timelines, checklists, decision trees, and more.
- Stay current:
- written the day you order it, not years ago.
- Trust what you read:
- every book is checked for accuracy, with real research when your subject needs it.
Create your unique book in 3 steps
- 1. Select your focus
Select the focus of your Probability and Statistics book and share your background
- 2. Personalize your book
Specify your goals and choose sub-topics to include
- 3. Get your tailored book
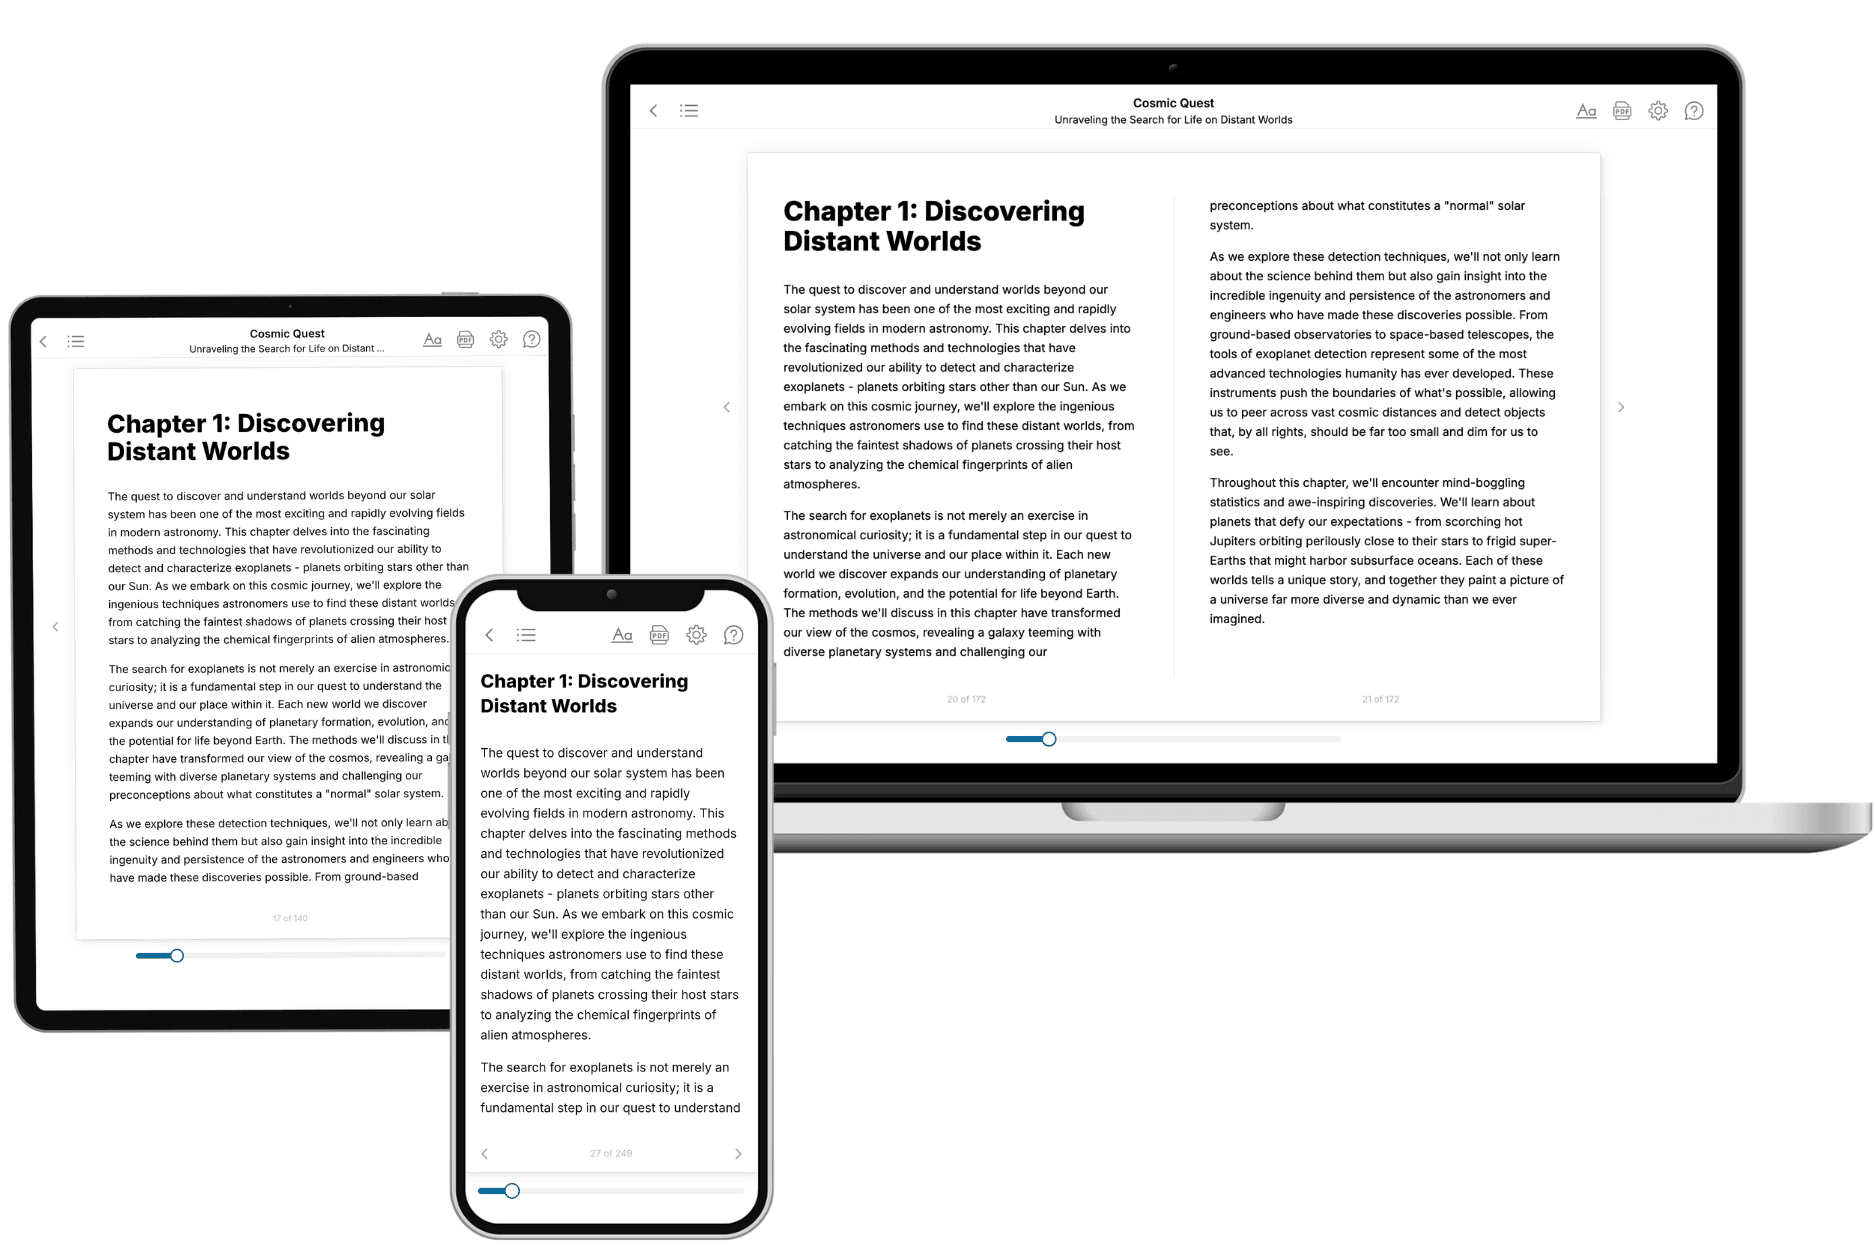
Your book is ready in 10 minutes. Read it online, download as EPUB or PDF, or send to Kindle.
Frequently asked questions
- What is TailoredRead?
TailoredRead creates complete, full-length nonfiction ebooks, written specifically for you. Tell us what you want to learn and why, and TailoredRead writes you a complete ebook on it, with charts, tables, and diagrams throughout. Read it online, on Kindle, or on any e-reader, or download it as a PDF or EPUB. Every book is written fresh the day you order it.
- How is the book tailored to me?
Before anything is written, you answer a few short questions about your goals, your background, and the topics you care about. Your book is then planned around your answers: written at your level, focused on your goals, and covering the topics you chose, instead of the one-size-fits-all book a store sells everyone.
- Will it read like generic AI content?
No. Your book isn't a chat transcript: it's planned chapter by chapter before a single word is written, told in a clear book voice, and explains ideas visually with charts, tables, and diagrams. After writing, every book goes through an editorial pass that polishes chapters so the book reads consistent from start to finish. Judge for yourself: browse thousands of sample books on our Explore Books page.
- How accurate is the content?
Our AI first checks whether your subject needs live research. Niche and fast-moving subjects are researched before writing, and the book plan and chapters are grounded in what it finds. After writing, every book goes through a quality pass that checks its facts and consistency, and researched books list their sources in a Notes section at the back.
- How long is the book?
You choose the length: Comprehensive (250-300 pages), Detailed (150-200 pages), Essential (70-100 pages), or Short (30-50 pages).
- Does the book include visuals?
Yes. Every book includes charts, tables, and diagrams: timelines, checklists, step-by-step guides, decision trees, comparison tables, matrices, and bar charts. A typical book includes dozens of these visual elements.
- Can I read it on Kindle? What formats can I download?
Yes. Every book can be read in our online reader or downloaded as a PDF or EPUB. The EPUB can be opened with Kindle, Apple Books, Kobo, and any e-reader. The Commercial and Author licenses also include an editable Word (DOCX) and Markdown download.
- How much does it cost?
About the price of a regular ebook. The exact price depends on your book's length and complexity, from $2 for the shortest books to $35 for the most comprehensive, and it's shown when you review your book, before you commit to anything. Each book is a one-time purchase, yours to keep, no subscription. Licenses that let you share, teach, or publish your book range from $35.99 to $49.99.
- Can I preview the book before purchasing?
Before you pay, you'll see what your book will cover: the title, a detailed description, the estimated length, and the complete chapter-by-chapter table of contents, so you know what you're getting before you decide. The full text itself is written after you purchase.
- How long does it take to create a book?
About 10 minutes. You can start reading the opening chapters while the rest is still being written.