Regression Analysis Mastery
From Theory to Problem-Solving Excellence
Many people believe regression analysis is simply about drawing a line through data points and reading off predictions.
222 pages10 chaptersNov 15, 2025Statistics
About this book
This misconception leads to flawed analyses, misinterpreted results, and poor decision-making. Regression analysis is actually a sophisticated framework for understanding relationships between variables and solving complex mathematical problems. This book takes you beyond surface-level formulas to develop genuine mastery of regression methods. You'll learn how to construct appropriate models for different problem types, validate your assumptions, diagnose issues when they arise, and interpret results with confidence. Whether you're working with simple linear relationships or navigating the complexities of multicollinearity and non-linear patterns, you'll discover practical techniques grounded in mathematical principles. Each concept builds systematically, connecting theory to real problem-solving scenarios. By the end, you'll approach regression analysis with both technical precision and intuitive understanding, equipped to tackle challenges that initially seemed insurmountable.
Table of contents
- IntroductionWhy Regression Analysis Matters in Problem-Solving, Common Misconceptions About Regression, How to Use This Book for Maximum LearningRead below
- Chapter 1: Foundations of Regression AnalysisWhat Is Regression and Why It Works, Understanding Variables and Their Relationships, Regression Versus Correlation: Key Distinctions, Identifying Problem Types Regression Can Solve
- Chapter 2: Simple Linear Regression EssentialsThe Structure of a Linear Model, The Least Squares Method Explained, Calculating Slope and Intercept, Interpreting Coefficients and Predictions
- Chapter 3: Assumptions and DiagnosticsThe Five Core Assumptions of Linear Regression, Testing Assumptions in Your Data, Residual Analysis and What It Reveals, Using Diagnostic Plots to Identify Problems
- Chapter 4: Model Validation and Goodness of FitUnderstanding R-Squared and Its Limitations, Adjusted R-Squared and Model Complexity, Statistical Significance Versus Practical Significance, Cross-Validation and Out-of-Sample Testing
- Chapter 5: Multiple Regression and BeyondExtending to Multiple Predictor Variables, Matrix Formulation of Multiple Regression, Understanding Partial Effects and Control Variables, Incorporating Categorical Variables
- Chapter 6: Multicollinearity and Its SolutionsWhat Multicollinearity Is and Why It Matters, Detecting Multicollinearity in Your Model, Strategies for Addressing Multicollinearity, Ridge and Lasso Regression as Solutions
- Chapter 7: Handling Violations and OutliersHeteroscedasticity: Detection and Correction, Non-Normality of Residuals and Transformations, Identifying and Managing Outliers and Influential Points, Robust Regression Methods for Problematic Data
- Chapter 8: Polynomial and Non-Linear RegressionPolynomial Regression for Curved Relationships, Splines and Smoothing Techniques, Log and Other Transformations for Non-Linearity, Choosing the Right Level of Model Complexity
- Chapter 9: Logistic Regression for ClassificationRegression for Binary Outcomes, The Logistic Function and Odds Ratios, Interpreting Logistic Regression Coefficients, Classification Metrics and Model Evaluation
- Chapter 10: Problem-Solving Strategies and Case StudiesA Systematic Approach to Regression Problems, Case Study: Predicting Continuous Outcomes, Case Study: Classification and Decision-Making, Common Pitfalls and How to Avoid Them
- ConclusionYour Regression Analysis Mastery Journey, Next Steps and Advanced Topics
- Glossary of Key Terms
- Further Reading and Resources
Introduction
Regression analysis stands as one of the most powerful and widely applied mathematical tools in modern problem-solving. From predicting housing prices to understanding the relationship between education and income, from forecasting sales trends to modeling biological processes, regression techniques provide the framework for extracting meaningful insights from data. Yet despite its ubiquity, regression analysis remains widely misunderstood. Many approach it as a mechanical process of plugging numbers into formulas, missing the deeper conceptual understanding that separates competent calculation from genuine mastery. This book exists to bridge that gap, transforming your relationship with regression from procedural execution to intuitive comprehension.
The journey from intermediate mathematical knowledge to regression mastery requires more than memorizing equations. It demands understanding why methods work, recognizing when assumptions fail, and developing the judgment to select appropriate techniques for specific problems. You've likely encountered basic statistical concepts and have some familiarity with mathematical notation. Perhaps you've even run simple regressions using software or calculated correlation coefficients by hand. What you may lack is the systematic framework that connects these isolated skills into a coherent problem-solving approach. This book provides that framework, building your capabilities layer by layer until complex regression challenges become approachable and solvable.
Throughout these chapters, you'll discover that regression analysis is fundamentally about relationships. Every technique, every diagnostic test, every validation method serves the central purpose of understanding how variables relate to one another and using those relationships to make predictions or inform decisions. The mathematics provides precision, but the conceptual understanding provides wisdom. You'll learn not just how to calculate a regression coefficient, but what that coefficient actually means in context. You'll discover not just how to compute an R-squared value, but when that metric misleads and what alternatives exist. Most importantly, you'll develop the critical thinking skills that allow you to approach unfamiliar problems with confidence, knowing you possess the tools and understanding to find solutions.
This introduction sets the stage for your learning journey by addressing three essential questions. First, why does regression analysis matter for problem-solving, and what makes it so valuable across diverse fields? Second, what misconceptions about regression might be limiting your current understanding, and how can correcting them accelerate your progress? Third, how should you approach this book to maximize your learning and skill development? By answering these questions clearly, you'll begin your regression mastery journey with clarity of purpose and realistic expectations about the work ahead.
Why Regression Analysis Matters in Problem-Solving
Regression analysis matters because it transforms raw data into actionable understanding. In a world increasingly driven by data, the ability to identify patterns, quantify relationships, and make evidence-based predictions separates effective problem-solvers from those who rely on intuition alone. Consider a business analyst trying to understand what drives customer satisfaction. Dozens of variables might influence satisfaction scores—product quality, price, customer service response time, delivery speed, and more. Regression analysis provides the mathematical framework to disentangle these factors, determining which variables matter most and by how much. This isn't merely academic exercise; it directly informs resource allocation decisions worth millions of dollars.
The power of regression extends far beyond business applications. Medical researchers use regression to identify risk factors for diseases, controlling for confounding variables like age and lifestyle. Environmental scientists employ regression techniques to model climate patterns and predict future changes. Engineers apply regression to optimize manufacturing processes, reducing defects and improving efficiency. Social scientists use regression to understand complex phenomena like educational achievement, crime rates, and economic mobility. What unites these diverse applications is the fundamental challenge: understanding how multiple factors interact to produce observed outcomes. Regression provides the mathematical language for expressing and testing these relationships rigorously.
One reason regression analysis proves so valuable is its flexibility. The basic linear regression framework extends naturally to handle increasingly complex scenarios. When relationships aren't linear, polynomial regression or transformations adapt the approach. When outcomes are categorical rather than continuous, logistic regression modifies the technique appropriately. When standard assumptions fail, robust methods provide alternatives. This adaptability means that mastering regression fundamentals opens doors to solving an enormous range of problems. You're not learning a single narrow technique but rather a family of related methods that share common principles while addressing different challenges.
Regression analysis also matters because it forces disciplined thinking about causation and correlation. A common pitfall in data analysis involves confusing association with causation—observing that two variables move together and incorrectly concluding that one causes the other. Regression analysis, properly applied, helps navigate this treacherous territory. While regression alone cannot prove causation, it provides tools for testing hypotheses, controlling for confounding factors, and building evidence for causal relationships. Understanding regression means understanding the difference between predictive models (which forecast outcomes without claiming causation) and explanatory models (which attempt to identify causal mechanisms). This distinction proves critical in real-world problem-solving.
Consider a concrete example: A city government wants to reduce traffic accidents at intersections. Initial data shows that intersections with traffic lights have more accidents than those with stop signs. Does this mean traffic lights cause accidents? A naive interpretation might suggest removing traffic lights. However, regression analysis reveals the confounding variable: traffic volume. High-volume intersections receive traffic lights precisely because they're busy, and busy intersections naturally have more accidents. When regression controls for traffic volume, the analysis shows traffic lights actually reduce accident rates compared to stop signs at similar-volume intersections. This example illustrates how regression prevents costly mistakes by revealing true relationships hidden within complex data.
The mathematical rigor of regression analysis provides another crucial benefit: reproducibility and transparency. When you document your regression model—specifying variables, transformations, and assumptions—others can verify your work, test your conclusions, and build upon your findings. This transparency stands in stark contrast to black-box approaches or purely intuitive decision-making. In professional contexts, the ability to justify your conclusions with clear mathematical reasoning proves invaluable. Stakeholders may question your recommendations, but a well-constructed regression analysis provides objective evidence that withstands scrutiny. This doesn't mean regression results are infallible, but it means they're testable and improvable through systematic methods.
Regression analysis also develops broader analytical skills that transfer to other domains. The process of building regression models teaches you to think systematically about problems: defining objectives clearly, identifying relevant variables, recognizing limitations in available data, testing assumptions, validating results, and communicating findings effectively. These skills apply far beyond regression itself. Whether you're debugging software, designing experiments, or evaluating competing strategies, the disciplined approach learned through regression analysis serves you well. The habit of questioning assumptions, seeking evidence, and thinking critically about relationships between variables becomes second nature.
Finally, regression matters because it provides a foundation for more advanced techniques. Machine learning algorithms like neural networks and random forests often seem mysterious and complex. However, many advanced methods represent extensions or combinations of regression principles. Understanding how linear regression works—how it fits models to data, how it balances complexity against overfitting, how it handles multiple variables—provides intuition for understanding more sophisticated approaches. You cannot truly master advanced analytics without first mastering regression. The concepts you'll learn in this book—bias-variance tradeoff, regularization, cross-validation, feature selection—appear repeatedly in cutting-edge data science. Regression provides the conceptual vocabulary for the entire field.
Common Misconceptions About Regression
Perhaps the most pervasive misconception about regression is that it's simply about drawing a line through data points. This oversimplification misses the conceptual depth that makes regression powerful. Yes, simple linear regression produces a line, but that line represents a mathematical model of the relationship between variables. The line's equation contains parameters estimated from data, and those parameters have specific interpretations. The slope isn't just a number; it quantifies how much the dependent variable changes for each unit change in the independent variable. The process of finding the best line involves minimizing prediction errors according to specific criteria. Understanding these deeper concepts transforms regression from mechanical line-drawing into purposeful model-building.
Another common misconception holds that regression proves causation. You've likely heard the warning that correlation doesn't imply causation
, yet many still interpret regression coefficients as causal effects. A significant regression coefficient tells you that two variables are associated, controlling for other variables in the model. It does not automatically mean one variable causes changes in the other. Establishing causation requires additional evidence: theoretical justification for why causation should exist, temporal ordering (causes must precede effects), ruling out confounding variables, and ideally experimental manipulation. Regression can support causal arguments when properly designed, but the technique itself doesn't prove causation. Recognizing this distinction prevents overconfident conclusions and inappropriate interventions based on regression results.
Many people believe that more variables always improve regression models. This misconception leads to kitchen-sink models that include every available variable without theoretical justification. In reality, adding variables creates several problems. First, it increases model complexity, making interpretation harder and overfitting more likely. Second, it introduces multicollinearity when variables correlate with each other, destabilizing coefficient estimates. Third, it reduces statistical power by consuming degrees of freedom. Fourth, it obscures the true relationships you're trying to understand. Effective regression modeling requires thoughtful variable selection based on theory, prior research, and the specific questions you're trying to answer. Sometimes simpler models with fewer variables provide clearer insights and better predictions than complex models with dozens of variables.
A related misconception assumes that statistical significance equals practical importance. A regression coefficient might be statistically significant (unlikely to occur by chance) yet represent a trivially small effect with no practical relevance. Conversely, a coefficient might fail to reach statistical significance due to small sample size yet represent a substantial effect worth investigating further. Statistical significance depends heavily on sample size—with enough data, even tiny effects become statistically significant. Practical significance requires considering the magnitude of effects in real-world units and contexts. For example, a statistically significant finding that a new teaching method improves test scores by 0.5 points on a 100-point scale might not justify the cost and effort of implementation, despite the statistical significance.
Consider this scenario: A researcher finds that each additional hour of weekly exercise correlates with a 0.02-point increase in life satisfaction (measured on a 10-point scale), with p < 0.001 indicating high statistical significance. The researcher concludes exercise significantly improves life satisfaction. However, the practical significance is questionable. A person would need to exercise 50 additional hours weekly to gain one full point of life satisfaction—clearly unrealistic. The statistical significance reflects the large sample size (10,000 participants), not the practical importance of the relationship. This example illustrates why you must always consider effect sizes alongside statistical significance.
Some believe regression requires perfectly linear relationships between variables. This misconception causes people to abandon regression when they observe curved patterns in their data. In reality, regression techniques handle non-linear relationships through several approaches: polynomial terms that model curves, logarithmic or other transformations that linearize relationships, and spline methods that fit flexible curves. The term linear regression refers to linearity in the parameters (coefficients), not necessarily linearity in the variables themselves. A model like y = β₀ + β₁x + β₂x² is still linear regression because it's linear in the β coefficients, even though it models a curved relationship between x and y. Understanding this distinction expands the range of problems you can address with regression techniques.
Another misconception holds that regression assumptions are optional guidelines rather than critical requirements. The assumptions underlying regression—linearity, independence, homoscedasticity, normality of residuals, and absence of multicollinearity—aren't arbitrary rules. They're mathematical conditions required for the regression estimates to have desirable properties like unbiasedness and minimum variance. When assumptions are violated, coefficient estimates may be biased, standard errors may be wrong, and hypothesis tests may be invalid. This doesn't mean you must abandon regression when assumptions fail; it means you must diagnose violations, understand their consequences, and apply appropriate corrections. Ignoring assumptions leads to unreliable results and flawed conclusions. Respecting assumptions and knowing how to address violations separates competent regression analysis from superficial number-crunching.
Many people also believe that high R-squared values automatically indicate good models. R-squared measures the proportion of variance explained by the model, and higher values seem better. However, R-squared can be misleading in several ways. First, it always increases when you add variables, even if those variables add no real explanatory power. Second, R-squared says nothing about whether you've included the right variables or whether the model makes theoretical sense. Third, high R-squared doesn't guarantee good predictions for new data—overfitted models can have high R-squared on training data but perform poorly on new data. Fourth, in some contexts, low R-squared is expected and acceptable. For example, predicting individual human behavior often yields low R-squared because humans are complex and variable, yet the model might still provide valuable insights about average tendencies.
A final misconception worth addressing is that regression analysis is purely objective and free from researcher judgment. While regression provides mathematical rigor, numerous subjective decisions shape the analysis: which variables to include, how to handle missing data, whether to transform variables, which observations to exclude as outliers, and how to interpret results. Two competent analysts working with the same data might make different defensible choices and reach somewhat different conclusions. This doesn't invalidate regression analysis; it means you must approach it thoughtfully, document your decisions, test the sensitivity of results to alternative choices, and communicate limitations honestly. Regression is a tool that requires skilled judgment, not a mechanical process that eliminates human decision-making.
How to Use This Book for Maximum Learning
This book is structured to build your regression mastery systematically, with each chapter building on previous concepts. The progression moves from foundational principles through increasingly sophisticated techniques, culminating in comprehensive problem-solving strategies. While you might be tempted to skip ahead to advanced topics, resist that urge. The later chapters assume solid understanding of earlier material. A shaky foundation in simple linear regression will undermine your ability to understand multiple regression, and confusion about assumptions will make diagnostics incomprehensible. Approach the book sequentially, ensuring you understand each chapter before advancing. This disciplined approach pays dividends as concepts compound and interconnect.
Each chapter follows a consistent structure designed to facilitate learning. Concepts are introduced with clear explanations that emphasize intuition before diving into mathematical details. You'll encounter concrete examples that illustrate abstract principles, making them tangible and memorable. Mathematical formulas appear when necessary, but always with explanation of what they mean and why they matter. The goal isn't to overwhelm you with equations but to build genuine understanding. When you encounter a formula, don't just memorize it—work through the logic of why it takes that form. Ask yourself what each component represents and how changing values would affect results. This active engagement transforms passive reading into deep learning.
To maximize your learning, approach this book with paper and pencil in hand. Work through examples yourself rather than just reading them. When the text presents a calculation, pause and perform it independently before checking the provided answer. When a concept seems clear, test your understanding by explaining it in your own words or creating your own example. This active practice cements understanding far more effectively than passive reading. You might also benefit from keeping a notebook where you summarize key concepts in your own words, note questions that arise, and track your progress. The physical act of writing reinforces learning and creates a personalized reference you can revisit.
The book includes numerous examples and case studies drawn from diverse fields. Don't skip these even if the specific context doesn't match your interests. A medical example teaches the same regression principles as a business example; the context differs but the methodology remains consistent. In fact, seeing how regression applies across different domains strengthens your understanding by highlighting the universal principles that transcend specific applications. Pay attention to how problems are framed, how variables are selected and defined, how assumptions are tested, and how results are interpreted. These problem-solving patterns repeat across contexts and represent transferable skills you'll apply to your own challenges.
Here's a practical learning strategy: After completing each chapter, identify three key concepts you learned and write a one-paragraph explanation of each in your own words without referring to the book. Then, create one original example problem that applies a technique from the chapter to a context you care about—your work, your studies, or a personal interest. Finally, identify one question or confusion point that remains unclear. This three-part reflection—summarize, apply, question—ensures active processing of material and identifies gaps requiring additional attention.
The chapters on assumptions and diagnostics deserve special attention. Many learners rush through these topics, eager to reach advanced techniques. This is a mistake. Understanding assumptions and knowing how to test them represents the difference between competent and incompetent regression analysis. A sophisticated technique applied without checking assumptions produces unreliable results. A simple technique applied with careful attention to assumptions produces trustworthy insights. Spend extra time on these chapters. Practice identifying assumption violations in example datasets. Learn to interpret diagnostic plots fluently. Develop the habit of always checking assumptions before trusting regression results. This discipline will serve you throughout your analytical career.
As you progress through the book, you'll notice increasing emphasis on judgment and decision-making rather than mechanical calculation. Early chapters focus on understanding how techniques work and how to execute them correctly. Later chapters increasingly address questions like: Which technique is appropriate for this problem? How do I choose between competing models? What do these results actually mean in context? This progression is intentional. Mastery requires not just technical skill but also the judgment to apply techniques appropriately. Pay attention to the reasoning behind methodological choices. When the text explains why one approach is preferred over another, understand the logic. These judgment calls represent the art of regression analysis that complements the mathematical science.
The book assumes you have intermediate mathematical knowledge, including algebra, basic calculus concepts, and some exposure to statistics. You should be comfortable with mathematical notation, understand concepts like means and standard deviations, and have some familiarity with hypothesis testing. If you encounter mathematical concepts that seem unfamiliar, don't panic. The book explains key ideas as they arise, and you can supplement with additional resources as needed. However, if you find yourself consistently confused by the mathematical level, you might benefit from reviewing foundational statistics before continuing. The goal is challenge without overwhelming frustration—you should feel stretched but not lost.
Consider forming a study group or finding a learning partner if possible. Discussing regression concepts with others deepens understanding through multiple perspectives. Explaining concepts to someone else reveals gaps in your own understanding and forces you to articulate ideas clearly. Working through problems collaboratively exposes you to different problem-solving approaches. Even if you prefer independent study, occasional discussion with others who are learning regression can provide valuable insights and motivation. Online forums and communities focused on statistics and data analysis can serve this purpose if local study partners aren't available.
Finally, approach this book with patience and realistic expectations. Regression mastery doesn't happen overnight. You'll encounter concepts that initially seem confusing, problems that frustrate you, and moments when you question whether you're making progress. This is normal and expected. Learning complex material requires persistence through difficulty. When you feel stuck, revisit earlier sections, work through additional examples, or take a break and return with fresh perspective. The investment you make in truly understanding regression will pay dividends throughout your career. The skills you develop here—analytical thinking, attention to assumptions, careful interpretation of results—transfer far beyond regression itself. You're not just learning a statistical technique; you're developing a disciplined approach to problem-solving that will serve you in countless contexts. Begin this journey with commitment, curiosity, and confidence that mastery lies ahead.
This is the end of the free sample. The full book has 10 chapters.
Want this book written for you?
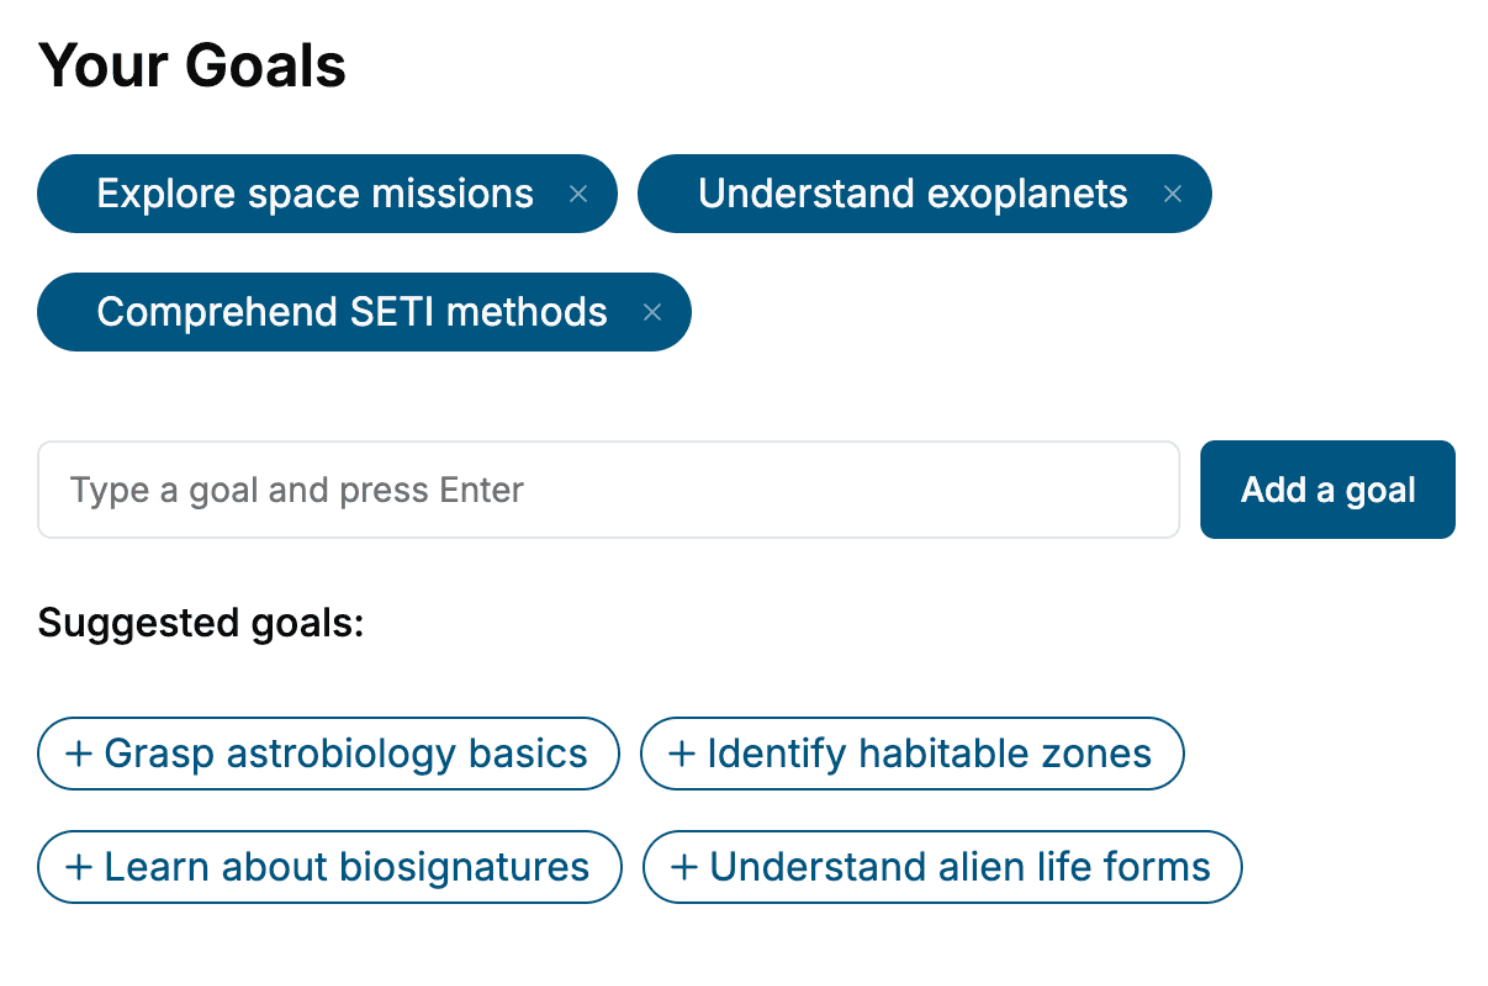
Tell us your goals and background, and get your own version of this book, tailored by AI to you.


Benefits of AI-tailored books
- Read one book, not ten:
- all the Statistics knowledge you need, gathered into a single book.
- Save days of learning:
- tell us your goals, choose your topics, and the whole book is built around them.
- Learn effortlessly:
- Statistics book written for your specific background and expertise.
- Understand at a glance:
- includes charts, tables, timelines, checklists, decision trees, and more.
- Stay current:
- written the day you order it, not years ago.
- Trust what you read:
- every book is checked for accuracy, with real research when your subject needs it.
Create your unique book in 3 steps
- 1. Select your focus
Select the focus of your Statistics book and share your background
- 2. Personalize your book
Specify your goals and choose sub-topics to include
- 3. Get your tailored book
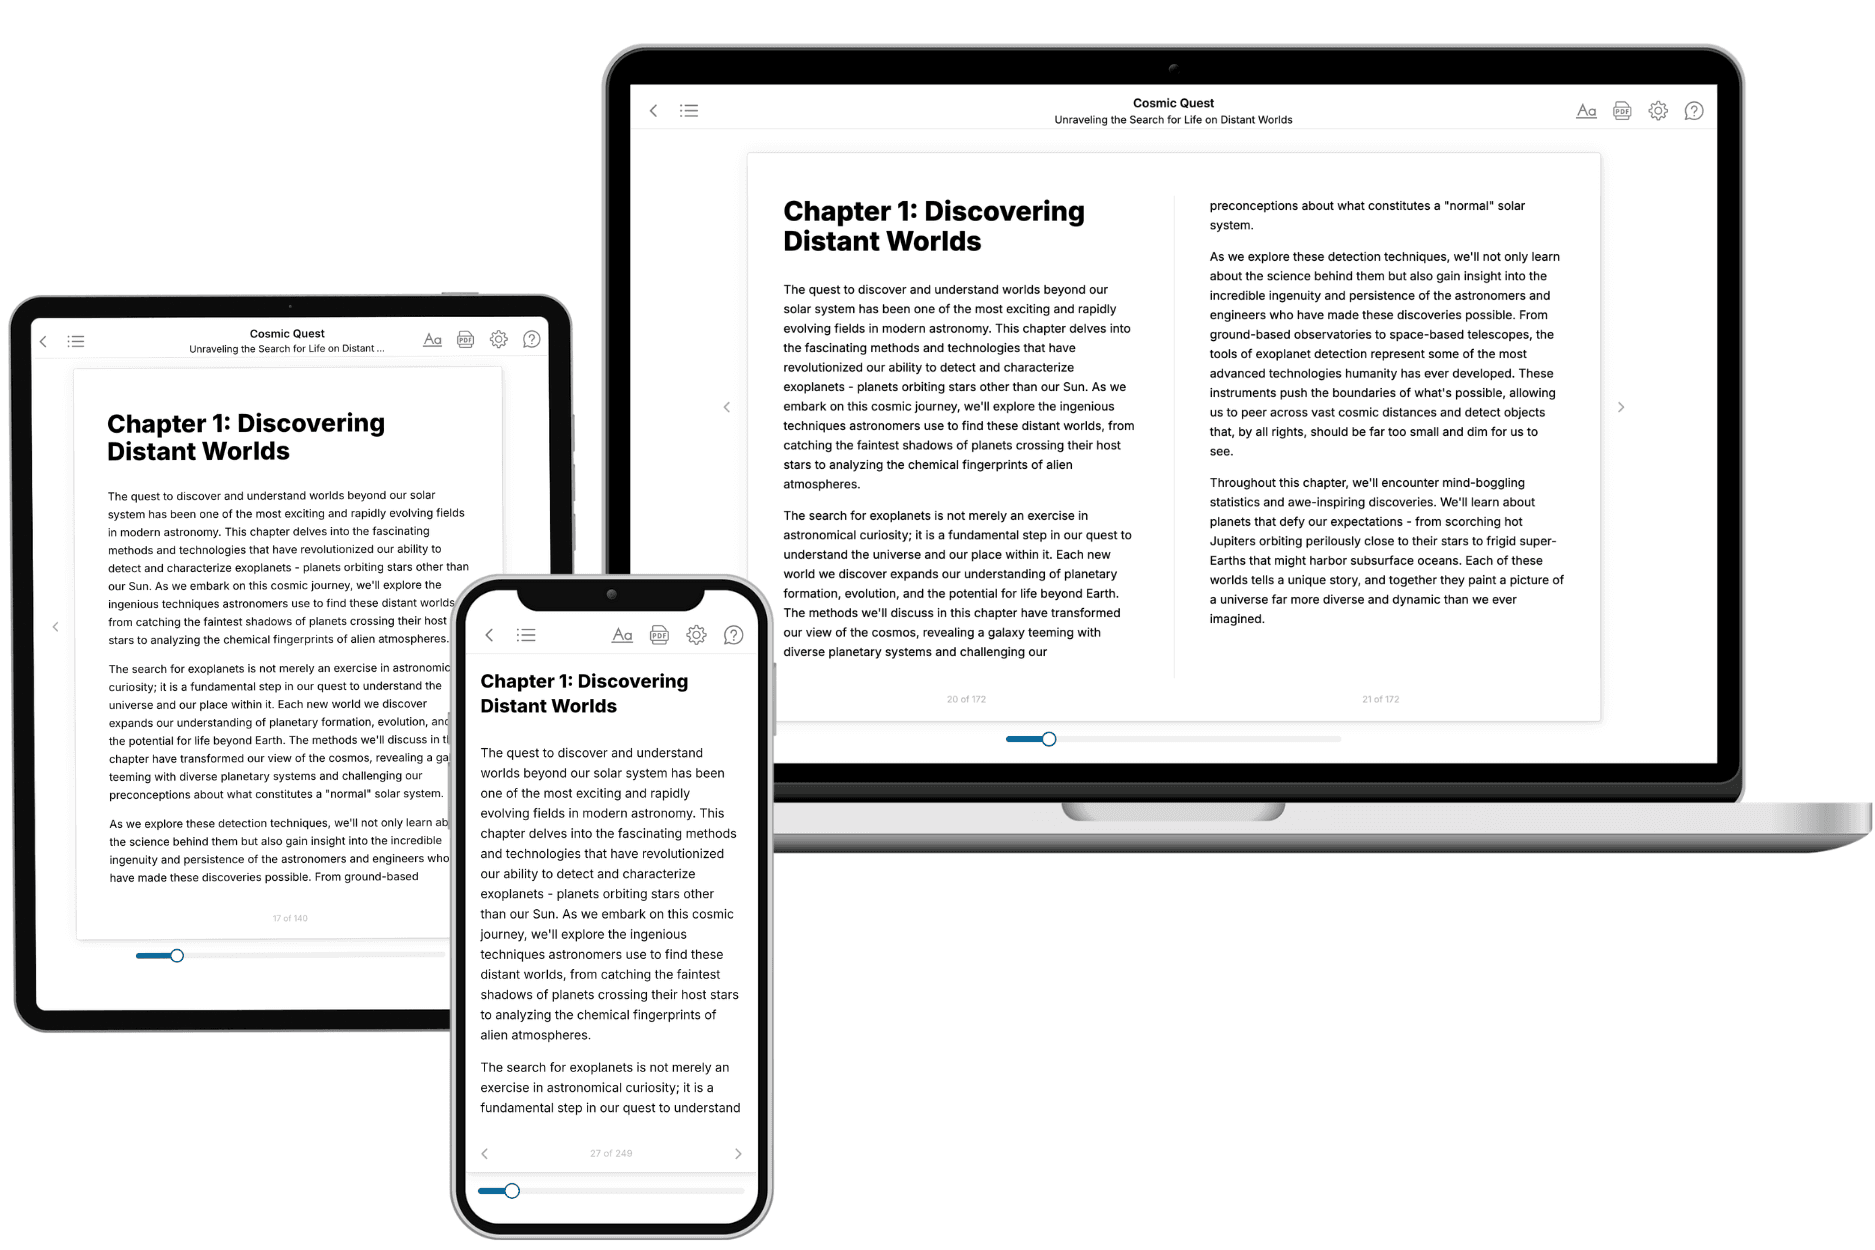
Your book is ready in 10 minutes. Read it online, download as EPUB or PDF, or send to Kindle.

Frequently asked questions
- What is TailoredRead?
TailoredRead creates complete, full-length nonfiction ebooks, written specifically for you. Tell us what you want to learn and why, and TailoredRead writes you a complete ebook on it, with charts, tables, and diagrams throughout. Read it online, on Kindle, or on any e-reader, or download it as a PDF or EPUB. Every book is written fresh the day you order it.
- How is the book tailored to me?
Before anything is written, you answer a few short questions about your goals, your background, and the topics you care about. Your book is then planned around your answers: written at your level, focused on your goals, and covering the topics you chose, instead of the one-size-fits-all book a store sells everyone.
- Will it read like generic AI content?
No. Your book isn't a chat transcript: it's planned chapter by chapter before a single word is written, told in a clear book voice, and explains ideas visually with charts, tables, and diagrams. After writing, every book goes through an editorial pass that polishes chapters so the book reads consistent from start to finish. Judge for yourself: browse thousands of sample books on our Explore Books page.
- How accurate is the content?
Our AI first checks whether your subject needs live research. Niche and fast-moving subjects are researched before writing, and the book plan and chapters are grounded in what it finds. After writing, every book goes through a quality pass that checks its facts and consistency, and researched books list their sources in a Notes section at the back.
- How long is the book?
You choose the length: Comprehensive (250-300 pages), Detailed (150-200 pages), Essential (70-100 pages), or Short (30-50 pages).
- Does the book include visuals?
Yes. Every book includes charts, tables, and diagrams: timelines, checklists, step-by-step guides, decision trees, comparison tables, matrices, and bar charts. A typical book includes dozens of these visual elements.
- Can I read it on Kindle? What formats can I download?
Yes. Every book can be read in our online reader or downloaded as a PDF or EPUB. The EPUB can be opened with Kindle, Apple Books, Kobo, and any e-reader. The Commercial and Author licenses also include an editable Word (DOCX) and Markdown download.
- How much does it cost?
About the price of a regular ebook. The exact price depends on your book's length and complexity, from $2 for the shortest books to $35 for the most comprehensive, and it's shown when you review your book, before you commit to anything. Each book is a one-time purchase, yours to keep, no subscription. Licenses that let you share, teach, or publish your book range from $35.99 to $49.99.
- Can I preview the book before purchasing?
Before you pay, you'll see what your book will cover: the title, a detailed description, the estimated length, and the complete chapter-by-chapter table of contents, so you know what you're getting before you decide. The full text itself is written after you purchase.
- How long does it take to create a book?
About 10 minutes. You can start reading the opening chapters while the rest is still being written.