Regression Analysis for Runtime Performance
Mastering Predictive Modeling Techniques for Algorithm Optimization
You'll navigate the intersection of statistics and computer science to build predictive models that reveal how algorithms truly perform.
207 pages9 chaptersMar 20, 2026Regression
About this book
This book guides you through collecting meaningful runtime data, constructing regression models that capture algorithm behavior, and validating your findings against real-world performance. You'll learn when simple linear models suffice and when polynomial, nonlinear, or multivariate approaches become necessary. Each technique is grounded in practical examples using sorting algorithms, graph traversals, and optimization problems. You'll discover how to diagnose model failures, handle outliers and anomalies, and integrate regression analysis into your development workflow. By the end, you'll confidently apply regression techniques to predict performance bottlenecks, compare algorithm efficiency, and make data-driven optimization decisions that directly impact system performance.
Table of contents
- IntroductionWhy Runtime Analysis Matters in Modern Computing, What Regression Analysis Can Tell You About Algorithms, How This Book Is OrganizedRead below
- Chapter 1: Foundations of Regression AnalysisCore Concepts: Variables, Relationships, and Predictions, Understanding Algorithm Complexity Through a Statistical Lens, Collecting Meaningful Runtime Data for Analysis
- Chapter 2: Linear Regression for Algorithm PerformanceSimple Linear Regression: Input Size and Execution Time, Fitting and Interpreting Linear Models, When Linear Models Fall Short
- Chapter 3: Multiple Regression and Multivariate AnalysisModeling Multiple Performance Factors Simultaneously, Selecting and Engineering Relevant Features, Capturing Interaction Effects Between Variables
- Chapter 4: Polynomial and Nonlinear Regression ModelsPolynomial Regression for Complex Runtime Patterns, Exponential and Logarithmic Transformations, Choosing the Right Model Complexity
- Chapter 5: Model Diagnostics and ValidationAnalyzing Residuals to Assess Model Fit, Verifying Regression Assumptions, Detecting and Handling Outliers and Anomalies
- Chapter 6: Cross-Validation and GeneralizationUnderstanding Overfitting and Underfitting, Cross-Validation Techniques for Robust Models, Evaluating Model Performance with Appropriate Metrics
- Chapter 7: Practical Applications in Algorithm AnalysisAnalyzing Sorting Algorithm Performance, Regression Models for Graph Traversal and Search, Predicting Runtime for Optimization Algorithms
- Chapter 8: Implementation and IntegrationTools and Frameworks for Regression Analysis, Integrating Regression with Profiling and Benchmarking, Automating Analysis and Continuous Performance Monitoring
- Chapter 9: Advanced Regression TechniquesRegularization Methods: Ridge and Lasso Regression, Robust Regression for Noisy Runtime Data, Ensemble Approaches and Model Combination
- ConclusionKey Takeaways and Best Practices, Future Directions in Runtime Analysis
- Glossary of Terms
- Further Reading and Resources
Introduction
Every algorithm has a story hidden inside its runtime data. When you run a sorting function on ten thousand elements and then on a hundred thousand, the difference in execution time is not random noise. It follows a pattern, and that pattern carries real information about how the algorithm scales, where it struggles, and what you can do to improve it. The challenge is that most developers never look closely enough at that data to extract the story it tells. They rely on Big-O notation as a shorthand, which is useful but incomplete, and they miss the practical, measurable behavior that only shows up when you actually run the code.
Regression analysis is the statistical tool that bridges the gap between theoretical complexity and observed performance. It gives you a systematic way to take raw timing measurements, fit a mathematical model to them, and produce predictions you can act on. If you have ever wondered why your algorithm runs slower than expected on certain inputs, or why two algorithms with the same Big-O complexity behave so differently in practice, regression analysis can help you find concrete answers. It turns performance investigation from guesswork into a disciplined, repeatable process.
This book is built for computer science professionals and algorithm developers who already have some grounding in both programming and basic statistics. You do not need to be a statistician to benefit from what follows. What you do need is a willingness to look at runtime data carefully and apply structured methods to understand it. The techniques covered here range from simple linear regression to polynomial models, multivariate analysis, and advanced regularization methods. Each one is grounded in real examples drawn from sorting algorithms, graph traversals, and optimization problems, so the concepts stay connected to the kind of work you actually do.
Performance problems are expensive. A poorly scaling algorithm in a production system can translate directly into higher infrastructure costs, slower user experiences, and engineering hours spent firefighting instead of building. The ability to predict how an algorithm will behave before it causes problems, and to compare alternatives with statistical rigor, is a genuinely valuable skill. This book aims to give you that skill in a form you can apply immediately, not just understand in the abstract.
Why Runtime Analysis Matters in Modern Computing
Software systems today operate at scales that were difficult to imagine even a decade ago. A single web service might process millions of requests per hour. A data pipeline might ingest billions of records per day. At these scales, the difference between an algorithm that runs in O(n log n) time and one that runs in O(n²) time is not academic. It is the difference between a system that handles load gracefully and one that collapses under pressure. Understanding runtime behavior in precise, quantitative terms is no longer optional for engineers working on performance-sensitive systems.
Big-O notation is the standard language for describing algorithmic complexity, and it is genuinely useful for reasoning about how algorithms scale asymptotically. However, it deliberately ignores constant factors, lower-order terms, and the practical realities of hardware. Two algorithms that are both O(n log n) can differ by a factor of five or ten in actual execution time, depending on memory access patterns, cache behavior, and implementation details. Big-O tells you the shape of the curve; it does not tell you where the curve sits or how steep it is in the range of inputs you actually care about.[1]
Runtime analysis using empirical measurement fills this gap. When you collect actual timing data across a range of input sizes and conditions, you capture the real behavior of your algorithm on real hardware. This includes effects that theoretical analysis cannot predict, such as garbage collection pauses, branch misprediction penalties, and the impact of data locality on cache performance. Empirical data is messy and noisy, but it is honest. It reflects what your users will actually experience.
Consider a concrete example. Suppose you are comparing two implementations of a graph search algorithm for a routing application. Theoretical analysis suggests both are O(V + E) where V is vertices and E is edges. But when you benchmark them on graphs with ten thousand nodes, one implementation consistently runs 40% faster. Without empirical measurement and a model to explain the difference, you have no principled way to choose between them or to predict how the gap will change as graph size grows. Regression analysis gives you that model.
The stakes are also financial. Cloud computing charges by the millisecond. An algorithm that processes a batch job in two hours instead of one hour doubles your compute cost for that job. At scale, these differences accumulate quickly. Organizations that invest in rigorous performance analysis and optimization often find that the engineering effort pays back many times over in reduced infrastructure spending. The ability to predict and model runtime behavior is a direct input to those cost calculations.
Beyond cost, there is the matter of user experience. Research consistently shows that response time has a measurable impact on user engagement and conversion rates. A study by Google found that a 100-millisecond increase in page load time could reduce conversion rates by up to 1%.[2] For high-traffic applications, that fraction of a second translates into significant revenue impact. Runtime analysis is not just a technical exercise; it connects directly to business outcomes.
Modern development workflows also create new demands for runtime analysis. Continuous integration pipelines need automated performance regression detection. Microservice architectures require understanding how latency compounds across service calls. Machine learning inference pipelines need to meet strict latency budgets. In all of these contexts, having a quantitative model of runtime behavior, rather than just intuition or ad hoc benchmarks, makes the difference between reactive firefighting and proactive engineering.
What Regression Analysis Can Tell You About Algorithms
Regression analysis is a family of statistical techniques for modeling the relationship between one or more input variables and an output variable. In the context of algorithm performance, the output variable is typically execution time, and the input variables might include input size, data characteristics, hardware configuration, or any other factor that influences how long the algorithm runs. The goal is to find a mathematical function that describes this relationship well enough to make useful predictions.
At its simplest, regression analysis can confirm or refine your theoretical complexity estimates. If you believe an algorithm runs in O(n²) time, you can fit a quadratic regression model to your timing data and check whether the fit is good. If the model fits well, you have empirical support for your theoretical analysis. If it fits poorly, that is a signal that something more complex is happening, perhaps a phase transition in behavior at certain input sizes, or an interaction between input size and data structure that your theory did not account for.
Regression analysis can also quantify the practical constants that Big-O ignores. A fitted model might tell you that your algorithm's runtime is approximately 2.3 * n² + 150 * n + 800 milliseconds for a given hardware configuration. That level of specificity lets you make concrete predictions. You can answer questions like: "At what input size does this algorithm become too slow for our latency budget?" or "How much faster would we need to make this to handle twice the current load?" These are engineering questions, and regression gives you engineering answers.
One of the most powerful things regression analysis reveals is the presence of factors you did not know mattered. Suppose you are modeling the runtime of a hash table lookup and you include only the number of elements as a predictor. Your model might have poor fit, with large residuals that follow a pattern. When you investigate, you discover that the load factor of the hash table is a significant predictor that you omitted. Multiple regression lets you include both variables and build a model that captures the true relationship. This kind of discovery is genuinely valuable for understanding your system.
A practical illustration: A team optimizing a database query planner collected runtime data for queries across varying table sizes and index configurations. A simple linear model explained only 61% of the variance in query time. When they added index selectivity and join type as additional predictors in a multiple regression model, the explained variance jumped to 94%. The richer model revealed that index selectivity had a larger impact on runtime than table size in many common query patterns, a finding that directly changed how they prioritized their optimization work.
Regression analysis is also a diagnostic tool. When you fit a model and examine the residuals (the differences between predicted and actual values), patterns in those residuals tell you whether your model is missing something important. Systematic patterns in residuals often point to nonlinearity, missing variables, or violations of statistical assumptions. Learning to read residual plots is one of the most practical skills in applied regression, and it is covered in depth later in this book.
It is worth being clear about what regression analysis cannot do. It cannot tell you why an algorithm behaves the way it does at a mechanistic level. It cannot replace profiling tools that identify which specific lines of code are slow. And it cannot extrapolate reliably far beyond the range of data you collected. Regression is a modeling tool, and like all models, it is an approximation. The goal is not a perfect model but a useful one, one that is accurate enough to support good decisions within the domain where you apply it.
The techniques in this book span a wide range of complexity and applicability. Simple linear regression is the right starting point for many analyses and is often sufficient for algorithms with clean, predictable scaling behavior. Polynomial regression handles the curved relationships that appear in quadratic or cubic algorithms. Nonlinear regression with exponential or logarithmic transformations captures the behavior of algorithms like binary search or certain dynamic programming solutions. Multiple regression and interaction terms handle the messy reality that runtime depends on many factors at once. Each technique has its place, and knowing when to use which one is a core skill this book develops.
How This Book Is Organized
This book is structured to build your understanding progressively, starting with the foundations you need and moving toward more sophisticated techniques and real-world applications. Each chapter introduces new concepts in the context of concrete algorithm examples, so the statistical ideas always stay connected to practical performance analysis. You can read the book from start to finish, or you can use it as a reference, jumping to the chapters most relevant to your current work.
Chapter 1: Foundations of Regression Analysis establishes the conceptual and practical groundwork. It covers the core vocabulary of regression, including variables, relationships, and predictions, and explains how statistical thinking applies to algorithm complexity. Critically, it also addresses data collection, because the quality of your regression analysis depends entirely on the quality of the runtime data you feed into it. You will learn how to design benchmarks that produce reliable, representative measurements.
Chapter 2: Linear Regression for Algorithm Performance introduces the simplest and most widely applicable regression technique. You will learn how to fit a linear model to runtime data, interpret the coefficients, and assess the quality of the fit. The chapter uses sorting algorithms as a running example and is honest about the limitations of linear models, setting up the need for more flexible approaches.
Chapter 3: Multiple Regression and Multivariate Analysis extends the framework to handle multiple predictors simultaneously. Real algorithm performance depends on more than just input size. Data distribution, memory pressure, concurrency level, and many other factors all play a role. This chapter shows you how to model those factors together and how to select the variables that matter most.
Chapter 4: Polynomial and Nonlinear Regression Models addresses the curved relationships that appear throughout algorithm analysis. Quadratic and cubic algorithms, logarithmic scaling, and exponential growth all require models that go beyond straight lines. You will learn how to apply polynomial regression, how to use mathematical transformations to linearize nonlinear relationships, and how to choose the right level of model complexity for your data.
The next two chapters focus on making sure your models are trustworthy. Chapter 5: Model Diagnostics and Validation covers residual analysis, assumption checking, and outlier detection. These techniques help you identify when a model is misleading you and what to do about it. Chapter 6: Cross-Validation and Generalization addresses the critical question of whether your model will perform well on new data. You will learn about overfitting, cross-validation strategies, and the metrics that best capture predictive accuracy for runtime models.
Chapter 7: Practical Applications in Algorithm Analysis is where the techniques come together in extended case studies. The chapter works through regression analysis for sorting algorithms, graph traversal algorithms, and optimization problems in detail. These examples are designed to be close enough to real engineering work that you can adapt them directly to your own projects.
Chapter 8: Implementation and Integration covers the practical side of putting regression analysis into your workflow. It surveys the tools and libraries available for regression in Python and R, explains how to integrate regression analysis with profiling and benchmarking frameworks, and describes approaches for automating performance monitoring so that regressions in algorithm performance are detected automatically as part of your development process.
Chapter 9: Advanced Regression Techniques introduces methods for handling the harder cases. Ridge and Lasso regression add regularization to prevent overfitting in models with many predictors. Robust regression handles datasets where outliers would otherwise distort the model. Ensemble approaches combine multiple models to improve prediction accuracy. These techniques are not always necessary, but when you need them, they make a significant difference.
The book closes with a Conclusion that synthesizes the key lessons and points toward emerging directions in runtime analysis, including the growing role of machine learning in performance prediction and the challenges of modeling algorithms in distributed and heterogeneous computing environments. A Glossary and Further Reading section provide reference material and pointers to deeper sources for the topics covered throughout.
Throughout the book, code examples are provided in Python, using libraries including numpy, scipy, scikit-learn, and statsmodels. These are the tools most commonly used in practice for this kind of analysis, and they are accessible to anyone with intermediate Python experience. The statistical concepts are explained in plain language alongside the code, so you understand not just how to run the analysis but what the results mean and how to act on them.
A few things to keep in mind as you work through the material. First, regression analysis is an iterative process. You rarely get a good model on the first attempt. The workflow involves fitting a model, examining diagnostics, revising your approach, and fitting again. This book teaches that iterative mindset, not just the individual techniques. Second, context matters enormously. A model that works well for analyzing a sorting algorithm on a single-core machine may need significant revision to apply to a parallel algorithm on a distributed cluster. Always think critically about whether the assumptions behind your model match the system you are analyzing. Third, the goal is insight, not just numbers. A regression model is most valuable when it changes how you think about your algorithm or your system, not just when it produces a prediction.
The intersection of statistics and computer science is a productive and underexplored space for many practitioners. Most algorithm developers have strong intuitions about performance but limited tools for making those intuitions rigorous and quantitative. Most statisticians have powerful modeling tools but limited exposure to the specific challenges of runtime data. This book is written for the developer who wants to bring statistical rigor to performance analysis without needing to become a statistician. The techniques here are practical, the examples are grounded in real engineering problems, and the goal throughout is to give you tools you will actually use.
This is the end of the free sample. The full book has 9 chapters.
Want this book written for you?
Tell us your goals and background, and get your own version of this book, tailored by AI to you.


Benefits of AI-tailored books
- Read one book, not ten:
- all the Regression knowledge you need, gathered into a single book.
- Save days of learning:
- tell us your goals, choose your topics, and the whole book is built around them.
- Learn effortlessly:
- Regression book written for your specific background and expertise.
- Understand at a glance:
- includes charts, tables, timelines, checklists, decision trees, and more.
- Stay current:
- written the day you order it, not years ago.
- Trust what you read:
- every book is checked for accuracy, with real research when your subject needs it.
Create your unique book in 3 steps
- 1. Select your focus
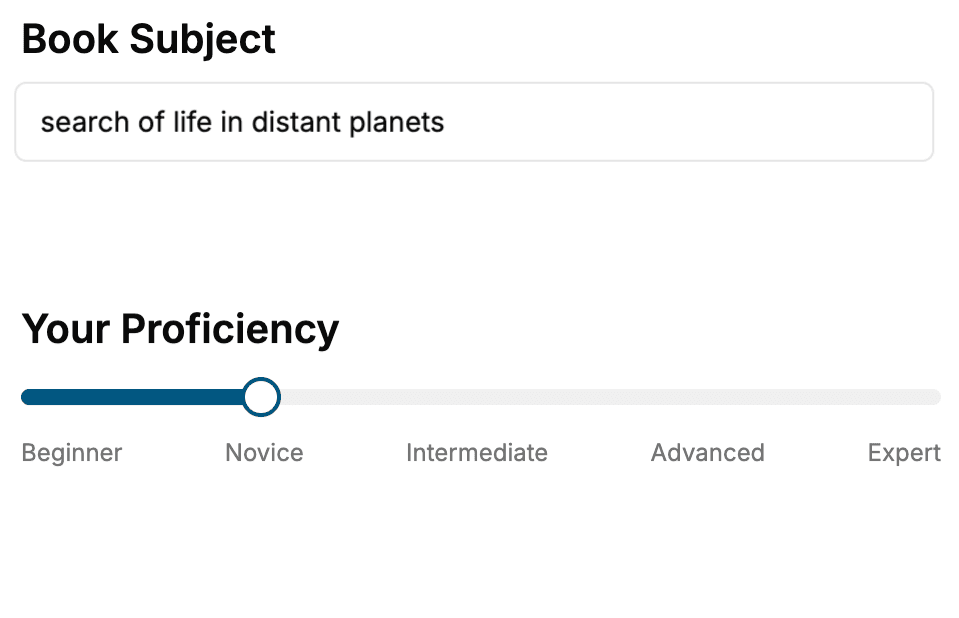
Select the focus of your Regression book and share your background
- 2. Personalize your book
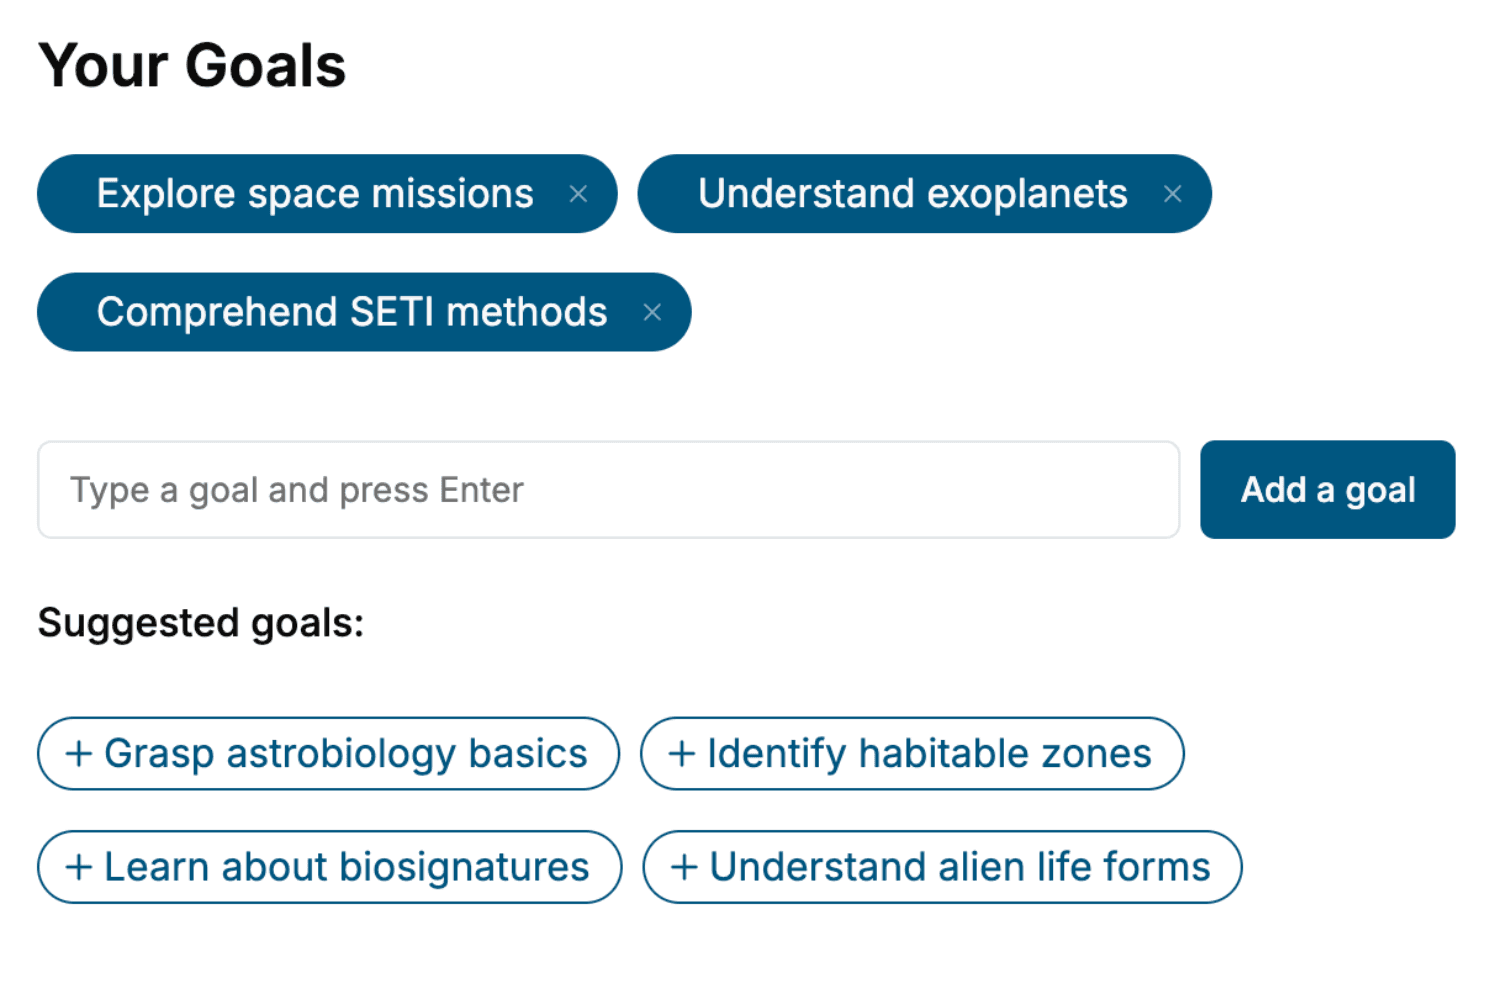
Specify your goals and choose sub-topics to include
- 3. Get your tailored book
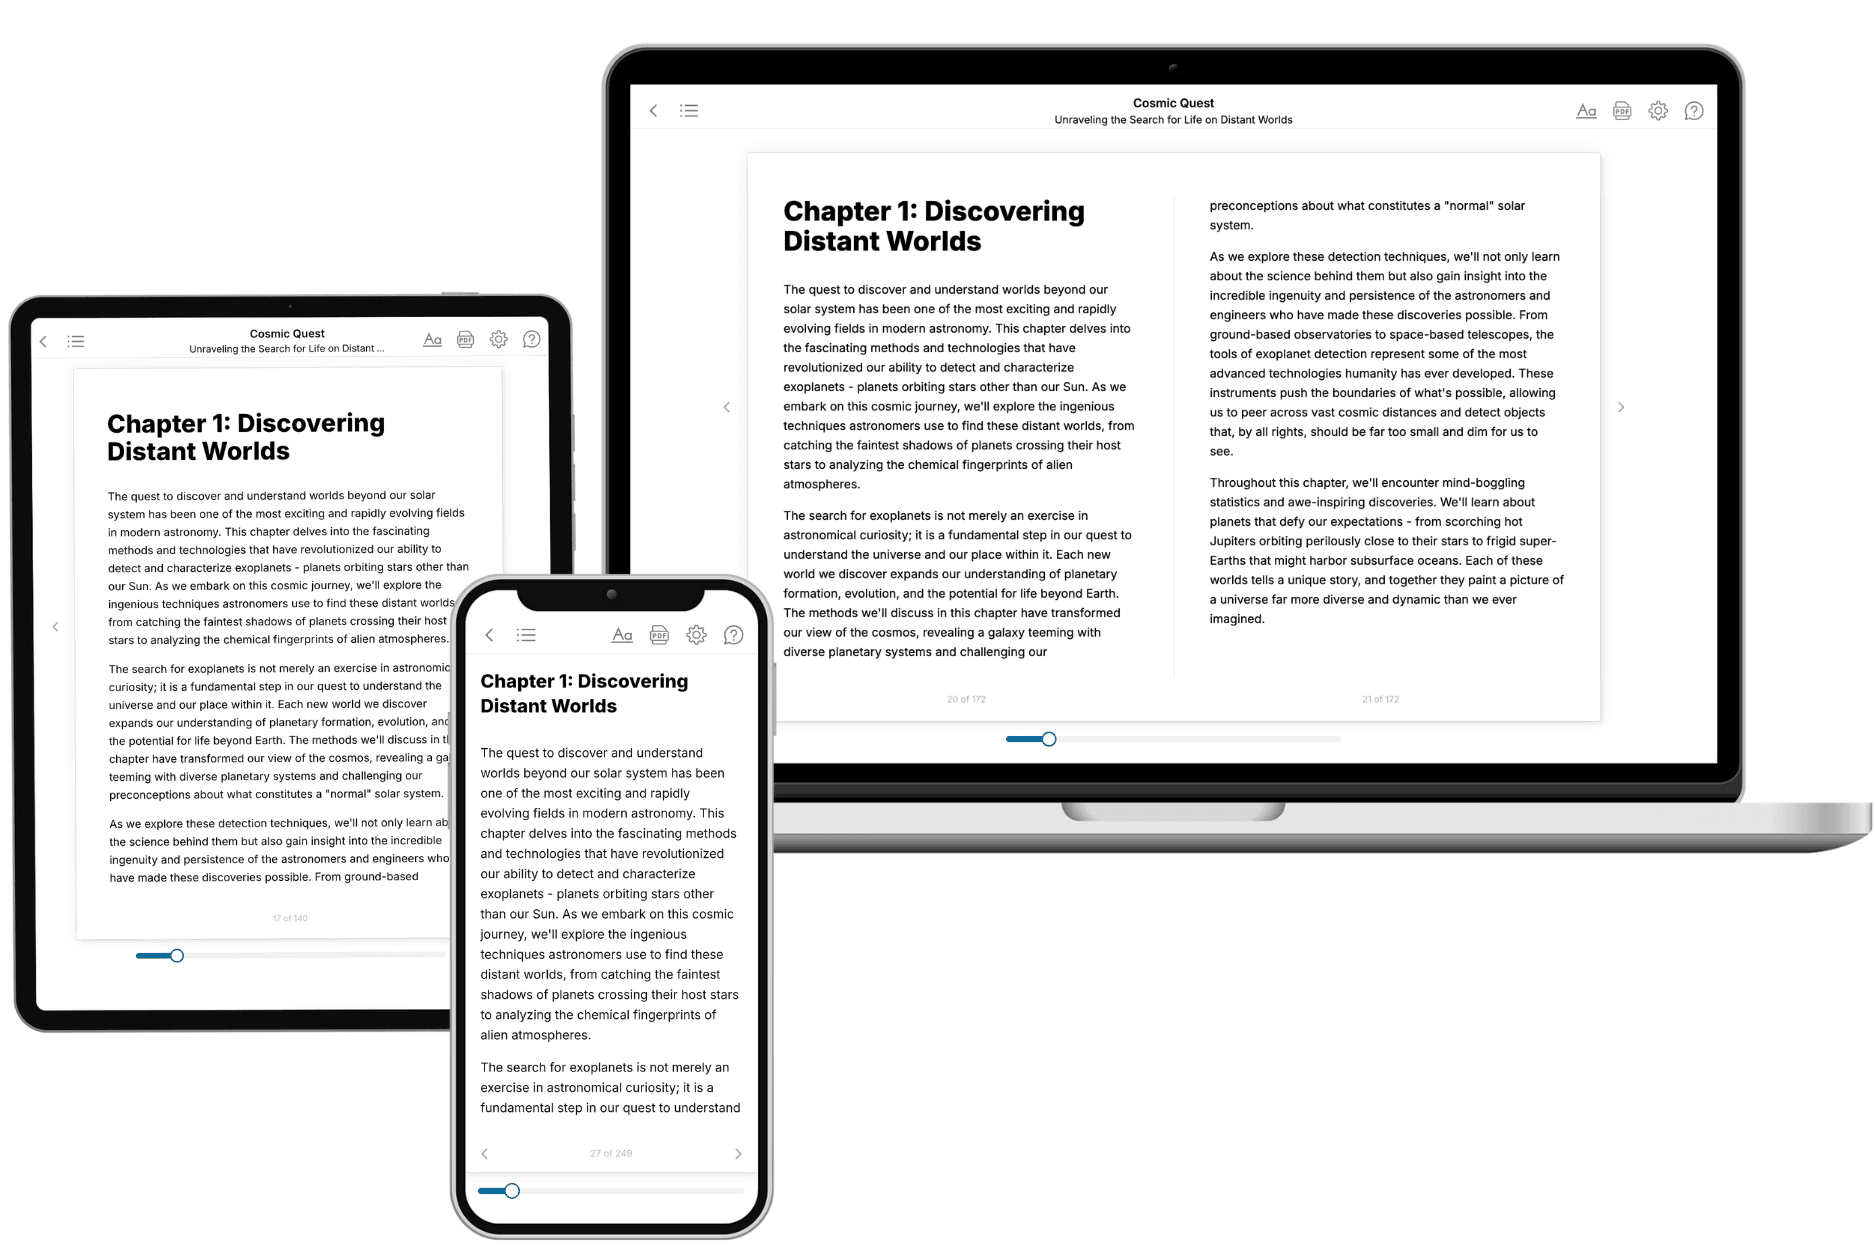
Your book is ready in 10 minutes. Read it online, download as EPUB or PDF, or send to Kindle.
Frequently asked questions
- What is TailoredRead?
TailoredRead creates complete, full-length nonfiction ebooks, written specifically for you. Tell us what you want to learn and why, and TailoredRead writes you a complete ebook on it, with charts, tables, and diagrams throughout. Read it online, on Kindle, or on any e-reader, or download it as a PDF or EPUB. Every book is written fresh the day you order it.
- How is the book tailored to me?
Before anything is written, you answer a few short questions about your goals, your background, and the topics you care about. Your book is then planned around your answers: written at your level, focused on your goals, and covering the topics you chose, instead of the one-size-fits-all book a store sells everyone.
- Will it read like generic AI content?
No. Your book isn't a chat transcript: it's planned chapter by chapter before a single word is written, told in a clear book voice, and explains ideas visually with charts, tables, and diagrams. After writing, every book goes through an editorial pass that polishes chapters so the book reads consistent from start to finish. Judge for yourself: browse thousands of sample books on our Explore Books page.
- How accurate is the content?
Our AI first checks whether your subject needs live research. Niche and fast-moving subjects are researched before writing, and the book plan and chapters are grounded in what it finds. After writing, every book goes through a quality pass that checks its facts and consistency, and researched books list their sources in a Notes section at the back.
- How long is the book?
You choose the length: Comprehensive (250-300 pages), Detailed (150-200 pages), Essential (70-100 pages), or Short (30-50 pages).
- Does the book include visuals?
Yes. Every book includes charts, tables, and diagrams: timelines, checklists, step-by-step guides, decision trees, comparison tables, matrices, and bar charts. A typical book includes dozens of these visual elements.
- Can I read it on Kindle? What formats can I download?
Yes. Every book can be read in our online reader or downloaded as a PDF or EPUB. The EPUB can be opened with Kindle, Apple Books, Kobo, and any e-reader. The Commercial and Author licenses also include an editable Word (DOCX) and Markdown download.
- How much does it cost?
About the price of a regular ebook. The exact price depends on your book's length and complexity, from $2 for the shortest books to $35 for the most comprehensive, and it's shown when you review your book, before you commit to anything. Each book is a one-time purchase, yours to keep, no subscription. Licenses that let you share, teach, or publish your book range from $35.99 to $49.99.
- Can I preview the book before purchasing?
Before you pay, you'll see what your book will cover: the title, a detailed description, the estimated length, and the complete chapter-by-chapter table of contents, so you know what you're getting before you decide. The full text itself is written after you purchase.
- How long does it take to create a book?
About 10 minutes. You can start reading the opening chapters while the rest is still being written.