Regression Analysis Simplified
Master Linear Relationships and Predictive Modeling with Elementary Algebra
You're about to discover how the algebra you already know becomes a powerful tool for understanding patterns in data and making informed predictions.
253 pages11 chaptersOct 25, 2025Statistics
About this book
This book bridges the gap between elementary algebra and practical data analysis, showing you how regression analysis works from the ground up. You'll move beyond memorizing formulas to genuinely understanding why regression works, how to apply it confidently, and when to trust your results. Through clear explanations and practical examples, you'll learn to identify relationships between variables, calculate lines of best fit, interpret statistical measures, and evaluate model quality. Whether you're analyzing business trends, exploring scientific data, or simply curious about the mathematics behind predictive modeling, you'll gain the skills to turn raw data into actionable insights. By the end, you'll have a solid foundation in both simple and multiple regression, complete with the confidence to apply these techniques to real-world problems. No advanced mathematics required—just your existing algebra knowledge and a willingness to see data in a new way.
Table of contents
- IntroductionWhat Is Regression Analysis?, From Algebra to Data Analysis, How to Use This BookRead below
- Chapter 1: Foundations: Variables and RelationshipsDependent and Independent Variables, Visualizing Relationships with Scatter Plots, Types of Relationships: Linear and Nonlinear, Assessing Strength and Direction
- Chapter 2: Essential Algebra for RegressionThe Slope-Intercept Form Revisited, Calculating Slope Between Two Points, Interpreting Linear Equations, Systems of Equations and Solutions
- Chapter 3: Understanding CorrelationThe Correlation Coefficient, Calculating Correlation by Hand, Interpreting Correlation Values, Correlation Does Not Imply Causation
- Chapter 4: The Least Squares MethodWhat Makes a Line 'Best Fit'?, Minimizing Squared Errors, Deriving the Least Squares Formulas, Calculating Regression Coefficients
- Chapter 5: Simple Linear RegressionBuilding the Regression Equation, Making Predictions with Your Model, Worked Examples Step by Step
- Chapter 6: Residuals and Model EvaluationWhat Are Residuals?, Creating and Interpreting Residual Plots, Identifying Patterns and Problems, Outliers and Influential Points
- Chapter 7: Measuring Model Fit with R-SquaredThe Coefficient of Determination, Calculating R-Squared, Interpreting R-Squared Values, Limitations of R-Squared
- Chapter 8: Assumptions and ConditionsThe Linearity Assumption, Independence of Errors, Constant Variance (Homoscedasticity), Checking Assumptions in Practice
- Chapter 9: Introduction to Multiple RegressionWorking with Multiple Predictors, The Multiple Regression Equation, Interpreting Multiple Coefficients, Adjusted R-Squared
- Chapter 10: Practical ApplicationsBusiness and Economic Forecasting, Scientific Research Applications, Social Sciences and Education, Everyday Decision-Making
- Chapter 11: Common Pitfalls and How to Avoid ThemThe Dangers of Extrapolation, Overfitting Your Model, Misinterpreting Results
- ConclusionKey Takeaways, Your Next Steps in Data Analysis
- AppendixFormula Reference Guide, Practice Datasets, Calculation Tables and Worksheets
- Glossary
- Further Reading
Introduction
Every day, you encounter questions that involve relationships between things. Does studying more hours lead to better test scores? How does advertising spending affect sales revenue? Can you predict housing prices based on square footage? These questions share something fundamental: they ask how one thing changes when another thing changes. Regression analysis gives you the mathematical tools to answer these questions with precision and confidence. What makes this approach powerful is that it builds directly on algebra concepts you already understand—the slope-intercept form of a line, calculating averages, and working with equations. You don't need advanced calculus or complex statistical theory to grasp the core ideas. Instead, you'll discover how elementary algebra becomes a sophisticated analytical framework when applied systematically to data.
The beauty of regression analysis lies in its accessibility and versatility. Unlike many statistical techniques that require specialized knowledge, regression starts with the simple idea of drawing a line through points on a graph. You've probably done this informally many times—eyeballing a trend in data and sketching an approximate line. Regression analysis formalizes this intuition, providing objective methods to find the best possible line and measure how well it represents your data. This mathematical rigor transforms subjective guesswork into reliable predictions. Whether you're analyzing business metrics, conducting scientific research, or exploring patterns in everyday life, regression gives you a systematic way to quantify relationships and make informed decisions based on evidence rather than hunches.
This book takes you on a journey from basic algebraic concepts to practical data analysis skills. You'll start by understanding what regression analysis actually is and why it matters. Then you'll build your knowledge step by step, learning how to visualize relationships, calculate correlation, derive regression equations, and evaluate model quality. Each chapter introduces concepts clearly, shows you the mathematical reasoning behind them, and demonstrates practical applications. By the time you finish, you'll have the confidence to perform regression analysis on real datasets, interpret results correctly, and recognize when regression is—or isn't—the right tool for your analytical needs. The goal isn't just to teach you formulas to memorize, but to help you genuinely understand the logic behind regression so you can apply it flexibly and thoughtfully.
What Is Regression Analysis?
Regression analysis is a statistical method for examining the relationship between one dependent variable and one or more independent variables. In simpler terms, it helps you understand how changes in one thing (the independent variable) correspond to changes in another thing (the dependent variable). The word regression itself comes from 19th-century statistician Francis Galton, who studied how children's heights "regressed" toward the average height rather than becoming progressively taller or shorter with each generation[1]. Today, regression has evolved far beyond this original context to become one of the most widely used analytical techniques across virtually every field that works with data. The fundamental question regression answers is: Given what I know about one variable, what can I predict about another?
At its core, regression analysis seeks to find a mathematical equation that best describes the relationship between variables. For simple linear regression—the focus of most of this book—that equation takes the familiar form y = mx + b, where y is the dependent variable you're trying to predict, x is the independent variable you're using to make predictions, m is the slope, and b is the y-intercept. This is exactly the slope-intercept form you learned in algebra class. The difference is that in regression, you're working with real data that doesn't fall perfectly on a line. Your job is to find the line that comes closest to all your data points, then use that line to make predictions and understand the strength of the relationship between variables.
Consider a practical example: a coffee shop owner wants to understand the relationship between daily temperature and iced coffee sales. Intuitively, you'd expect warmer days to generate more iced coffee sales. Regression analysis lets you quantify this relationship precisely. You might discover that for every degree the temperature increases, iced coffee sales increase by an average of 12 cups per day. This isn't just an observation—it's a predictive model. If tomorrow's forecast shows 85 degrees, you can estimate how many iced coffees to prepare, reducing waste and ensuring you don't run out. The regression equation captures this relationship mathematically, turning vague intuition into actionable business intelligence.
Regression analysis serves several important purposes in data analysis:
- Prediction: Estimate unknown values based on known information (predicting sales based on advertising spend)
- Quantification: Measure the strength and direction of relationships (determining how much test scores improve per hour of study)
- Control: Account for multiple factors simultaneously to isolate specific effects (examining salary differences while controlling for experience and education)
- Testing: Evaluate whether relationships exist and whether they're statistically meaningful (determining if a new marketing strategy actually impacts customer retention)
What makes regression particularly valuable is its balance between simplicity and power. The mathematical foundation is straightforward enough to understand with elementary algebra, yet the technique is sophisticated enough to provide genuine insights into complex phenomena. You don't need to be a mathematician or statistician to use regression effectively. You do need to understand the underlying logic, recognize when regression is appropriate, and interpret results correctly. These are exactly the skills this book will help you develop. Regression isn't magic—it's a systematic application of algebraic principles to real-world data, and that's what makes it both accessible and incredibly useful.
The distinction between correlation and regression often confuses newcomers, so it's worth clarifying early. Correlation measures the strength and direction of a relationship between two variables, giving you a single number (the correlation coefficient) between -1 and +1. Regression goes further by creating an equation that models the relationship, allowing you to make specific predictions. If correlation tells you that height and weight are strongly related, regression tells you that for every additional inch of height, weight increases by approximately 5 pounds (for example). Both concepts work together—correlation helps you identify relationships worth investigating, while regression helps you quantify and use those relationships for prediction and decision-making.
Throughout this book, you'll encounter regression in various contexts, from business forecasting to scientific research to everyday problem-solving. The fundamental principles remain consistent across these applications. You'll learn to identify appropriate situations for regression, prepare your data correctly, perform the necessary calculations, and interpret results with appropriate caution. Regression is a tool, and like any tool, it works best when you understand both its capabilities and its limitations. By the end of this book, you'll have that understanding, along with the practical skills to apply regression analysis confidently to problems that matter to you.
From Algebra to Data Analysis
The transition from algebra to data analysis is more natural than you might think. In algebra class, you worked with equations like y = 2x + 3, where the relationship between x and y was perfectly defined. If you plugged in x = 5, you got exactly y = 13, every single time. The world of data analysis deals with messier reality. Real data rarely falls perfectly on a line because countless factors influence outcomes, measurements contain errors, and relationships are approximate rather than exact. Regression analysis adapts the clean algebraic concepts you know to handle this imperfect real-world data. Instead of finding the line that passes through specific points, you find the best line that comes closest to a cloud of scattered points.
This shift from perfect to approximate relationships represents the key conceptual leap from algebra to statistical analysis. In algebra, you might have solved for the line passing through two specific points using the two-point form. In regression, you have dozens, hundreds, or thousands of points, and no single line passes through all of them. The question becomes: which line best represents the overall pattern? The answer involves minimizing the total distance between your line and all the data points—a concept called the least squares method. This method provides an objective, mathematical way to find the optimal line, removing subjectivity from the process. The algebra you already know provides the foundation for understanding how this optimization works.
Consider the algebraic skills you'll apply directly to regression analysis:
- Slope calculation: Finding the rate of change between variables using the rise-over-run concept
- Equation manipulation: Rearranging formulas to solve for different variables
- Substitution: Plugging values into equations to make predictions
- Working with summations: Adding up series of values to calculate means and totals
- Squaring and square roots: Computing distances and standard deviations
- Coordinate geometry: Plotting points and visualizing relationships on graphs
Each of these familiar algebraic operations plays a specific role in regression analysis. When you calculate a regression slope, you're determining how much the dependent variable changes for each unit increase in the independent variable—exactly the same concept as slope in algebra, just applied to real data. When you calculate the y-intercept, you're finding where your regression line crosses the y-axis, representing the predicted value when the independent variable equals zero. The formulas look more complex because they account for multiple data points simultaneously, but the underlying logic remains the same. Understanding this continuity between algebra and regression helps demystify the process and builds your confidence.
The mathematical notation in regression might initially seem intimidating, but it's simply a compact way to express operations you already understand. The symbol Σ (sigma) means "sum up all these values"—it's shorthand for addition. When you see Σx, it means add up all the x-values in your dataset. The notation x̄ (x-bar) represents the mean or average of x-values, calculated by summing all values and dividing by the count. These notational conventions make formulas more concise and precise, but they don't introduce fundamentally new mathematical concepts. Once you become comfortable with the notation, you'll recognize that regression formulas are systematic applications of addition, multiplication, division, and other basic operations you've used for years.
One significant advantage of learning regression through an algebraic lens is that you develop genuine understanding rather than just procedural knowledge. Many statistics courses present regression as a black box: you input data, software outputs results, and you interpret coefficients without really knowing where they came from. This approach works for simple applications but leaves you helpless when something goes wrong or when you need to adapt the technique to unusual situations. By understanding the algebraic foundations, you can trace every step from raw data to final results. You'll know why the formulas work, what assumptions they make, and when they might lead you astray. This deeper understanding makes you a more capable and confident analyst.
The progression from algebra to regression also illustrates a broader principle in mathematics: advanced techniques often build on elementary foundations in systematic ways. You don't need to learn entirely new mathematics to perform sophisticated data analysis. Instead, you learn to apply familiar concepts in new contexts, combine them in structured ways, and interpret results with appropriate care. This book emphasizes these connections throughout, showing you how each new concept relates to algebra you already know. When you encounter the least squares formulas, you'll see how they derive from minimizing squared distances—a geometric concept. When you learn about R-squared, you'll understand it as a ratio of variances—quantities calculated using basic arithmetic operations on your data.
As you progress through this book, you'll notice that the mathematical difficulty doesn't increase dramatically. The calculations involve more steps and require careful attention to detail, but they don't require advanced mathematical knowledge. What does increase is your conceptual sophistication—your ability to think about relationships between variables, evaluate model quality, and recognize when your analysis makes sense versus when something has gone wrong. This conceptual development is more valuable than computational skill because it enables you to use regression thoughtfully and critically. Modern software handles the tedious calculations, but only you can decide whether regression is appropriate for your problem, interpret results correctly, and communicate findings effectively to others.
How to Use This Book
This book is designed as a progressive learning journey, with each chapter building on concepts from previous chapters. The structure moves from foundational ideas to increasingly sophisticated applications, ensuring you develop a solid understanding at each stage before advancing. If you're new to regression analysis, you'll benefit most from reading chapters in order, working through examples as you go, and pausing to ensure you understand each concept before moving forward. If you have some prior exposure to regression, you might skim earlier chapters for review and focus more attention on later chapters covering model evaluation and multiple regression. Regardless of your starting point, the book is written to be accessible, with clear explanations and minimal jargon.
Each chapter follows a consistent structure designed to support learning:
- Concept introduction: Each topic begins with a clear explanation of what you'll learn and why it matters
- Mathematical foundation: The algebraic principles underlying each technique are explained step by step
- Worked examples: Concrete examples with complete calculations demonstrate how to apply concepts
- Interpretation guidance: You'll learn what results mean and how to communicate findings
- Common pitfalls: Typical mistakes and misconceptions are addressed explicitly
- Practical applications: Real-world contexts show how concepts apply beyond textbook problems
The worked examples throughout the book deserve special attention. These aren't just illustrations—they're learning opportunities where you can see the complete process from problem setup through calculation to interpretation. When you encounter an example, resist the temptation to skim through it quickly. Instead, work through it yourself with paper and pencil (or a calculator), following along with each step. This active engagement dramatically improves retention and understanding compared to passive reading. If you get a different answer than the book shows, don't immediately assume you're wrong—check your work carefully, identify where your calculation diverges, and understand why. These moments of productive struggle often generate the deepest learning.
You'll notice that this book emphasizes hand calculations, especially in early chapters. In practice, you'll likely use software for regression analysis—tools like Excel, R, Python, or specialized statistics packages. So why learn to calculate by hand? First, performing calculations manually builds intuition about what's actually happening in regression analysis. You develop a feel for how data characteristics affect results. Second, hand calculation helps you catch errors. If software produces a regression coefficient of 500 when you expected something around 5, you'll recognize the problem immediately if you understand the calculation process. Third, understanding the mathematics makes you a more sophisticated user of software, able to interpret output correctly and troubleshoot when things go wrong.
The book includes several features to support your learning. Key terms are highlighted when first introduced, helping you build your analytical vocabulary. Formulas are presented both in mathematical notation and explained in plain language, ensuring you understand both what they say and what they mean. Footnotes provide citations for research findings and direct you to additional resources for topics beyond this book's scope. The appendix contains reference materials you'll find useful: a complete formula guide, practice datasets for additional exercises, and calculation worksheets you can use for your own analyses. These resources are designed to support both initial learning and later reference when you're applying regression to your own projects.
As you work through the book, you'll encounter several recurring themes that deserve attention. One is the distinction between statistical significance and practical importance. A relationship might be statistically detectable but too small to matter in practice, or it might be practically important but difficult to detect with limited data. Another recurring theme is the importance of assumptions—the conditions that must be reasonably satisfied for regression results to be trustworthy. You'll learn what these assumptions are, how to check them, and what to do when they're violated. A third theme is interpretation in context—understanding that regression coefficients don't exist in a vacuum but must be interpreted within the specific domain and situation you're analyzing.
Your learning will be most effective if you approach this book with an active, questioning mindset. Don't just accept statements because they appear in print. Ask yourself: Why does this formula work this way? What would happen if I changed this assumption? How would I explain this concept to someone else? When you encounter a new technique, think about situations where you might apply it. When you see a limitation or pitfall, consider how you'd recognize it in your own work. This critical engagement transforms passive reading into active learning, helping you develop not just knowledge but genuine analytical skill.
Finally, remember that learning regression analysis is a process, not an event. You won't master everything on first reading, and that's perfectly normal. Concepts that seem confusing initially often become clear when you see them applied in different contexts or when you return to them after learning related ideas. If you find yourself struggling with a particular concept, don't get discouraged. Mark it for review, continue forward, and return to it later. Often, understanding later material provides the context that makes earlier concepts click into place. The goal isn't perfection but steady progress toward confident, competent application of regression analysis to problems that matter to you.
A Note on Practice: Throughout this book, you'll find opportunities to practice what you're learning. Take advantage of these opportunities. The difference between understanding regression conceptually and being able to apply it effectively comes down to practice. Work through examples, try the practice problems in the appendix, and most importantly, apply regression to your own questions and datasets. Real learning happens when you move from following someone else's example to solving your own problems.
The journey from elementary algebra to practical regression analysis is entirely achievable with the foundation you already have. This book provides the bridge, showing you step by step how algebraic concepts you know become powerful analytical tools when applied systematically to data. Whether your goal is to analyze business metrics, conduct research, or simply understand the quantitative world around you more deeply, regression analysis gives you a rigorous, flexible framework for examining relationships and making predictions. The chapters ahead will equip you with both the technical skills and the conceptual understanding to use regression confidently and appropriately. Let's begin.
Notes
Introduction
- 1. Francis Galton, "Regression Towards Mediocrity in Hereditary Stature," The Journal of the Anthropological Institute of Great Britain and Ireland, 1886
This is the end of the free sample. The full book has 11 chapters.
Want this book written for you?
Tell us your goals and background, and get your own version of this book, tailored by AI to you.


Benefits of AI-tailored books
- Read one book, not ten:
- all the Statistics knowledge you need, gathered into a single book.
- Save days of learning:
- tell us your goals, choose your topics, and the whole book is built around them.
- Learn effortlessly:
- Statistics book written for your specific background and expertise.
- Understand at a glance:
- includes charts, tables, timelines, checklists, decision trees, and more.
- Stay current:
- written the day you order it, not years ago.
- Trust what you read:
- every book is checked for accuracy, with real research when your subject needs it.
Create your unique book in 3 steps
- 1. Select your focus
Select the focus of your Statistics book and share your background
- 2. Personalize your book
Specify your goals and choose sub-topics to include
- 3. Get your tailored book
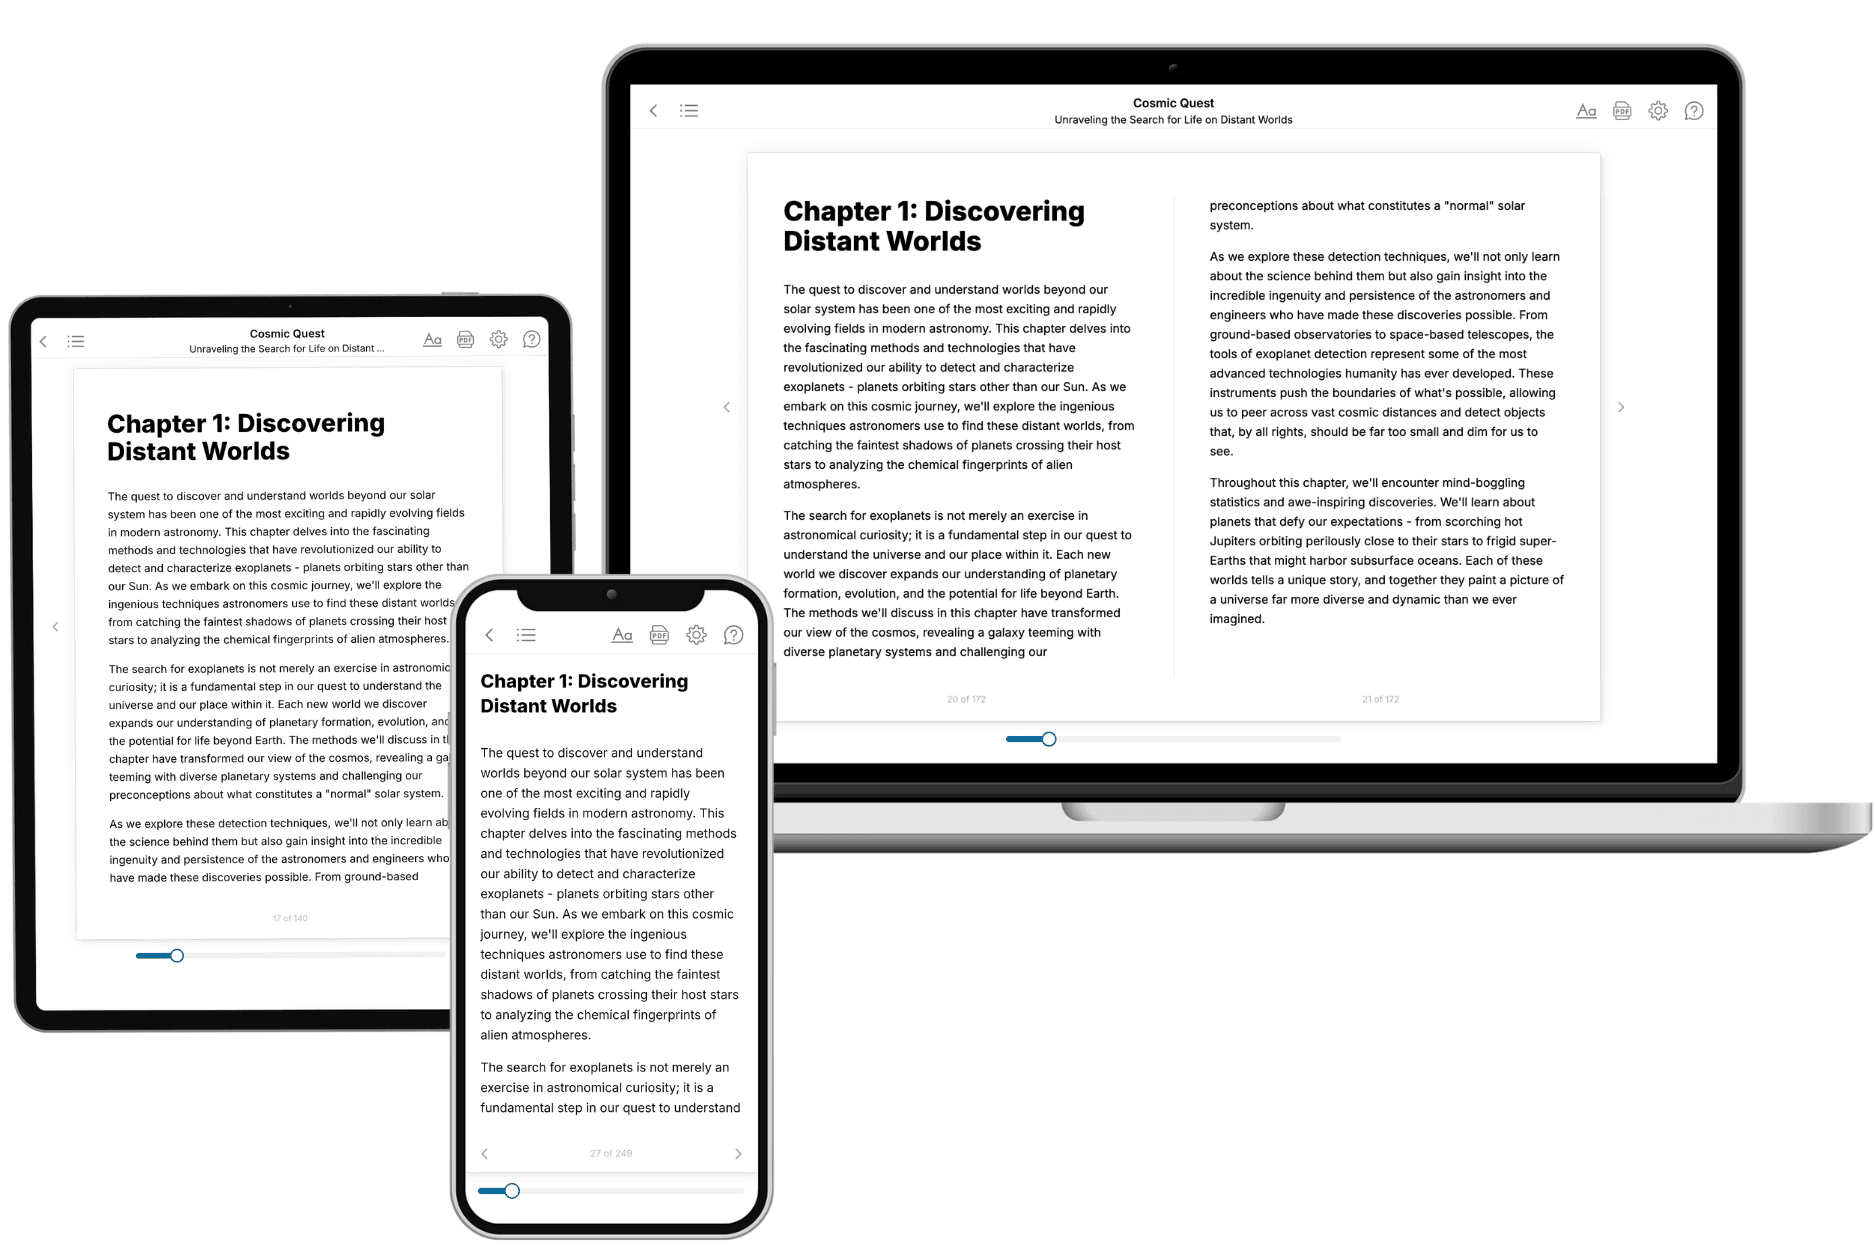
Your book is ready in 10 minutes. Read it online, download as EPUB or PDF, or send to Kindle.
Frequently asked questions
- What is TailoredRead?
TailoredRead creates complete, full-length nonfiction ebooks, written specifically for you. Tell us what you want to learn and why, and TailoredRead writes you a complete ebook on it, with charts, tables, and diagrams throughout. Read it online, on Kindle, or on any e-reader, or download it as a PDF or EPUB. Every book is written fresh the day you order it.
- How is the book tailored to me?
Before anything is written, you answer a few short questions about your goals, your background, and the topics you care about. Your book is then planned around your answers: written at your level, focused on your goals, and covering the topics you chose, instead of the one-size-fits-all book a store sells everyone.
- Will it read like generic AI content?
No. Your book isn't a chat transcript: it's planned chapter by chapter before a single word is written, told in a clear book voice, and explains ideas visually with charts, tables, and diagrams. After writing, every book goes through an editorial pass that polishes chapters so the book reads consistent from start to finish. Judge for yourself: browse thousands of sample books on our Explore Books page.
- How accurate is the content?
Our AI first checks whether your subject needs live research. Niche and fast-moving subjects are researched before writing, and the book plan and chapters are grounded in what it finds. After writing, every book goes through a quality pass that checks its facts and consistency, and researched books list their sources in a Notes section at the back.
- How long is the book?
You choose the length: Comprehensive (250-300 pages), Detailed (150-200 pages), Essential (70-100 pages), or Short (30-50 pages).
- Does the book include visuals?
Yes. Every book includes charts, tables, and diagrams: timelines, checklists, step-by-step guides, decision trees, comparison tables, matrices, and bar charts. A typical book includes dozens of these visual elements.
- Can I read it on Kindle? What formats can I download?
Yes. Every book can be read in our online reader or downloaded as a PDF or EPUB. The EPUB can be opened with Kindle, Apple Books, Kobo, and any e-reader. The Commercial and Author licenses also include an editable Word (DOCX) and Markdown download.
- How much does it cost?
About the price of a regular ebook. The exact price depends on your book's length and complexity, from $2 for the shortest books to $35 for the most comprehensive, and it's shown when you review your book, before you commit to anything. Each book is a one-time purchase, yours to keep, no subscription. Licenses that let you share, teach, or publish your book range from $35.99 to $49.99.
- Can I preview the book before purchasing?
Before you pay, you'll see what your book will cover: the title, a detailed description, the estimated length, and the complete chapter-by-chapter table of contents, so you know what you're getting before you decide. The full text itself is written after you purchase.
- How long does it take to create a book?
About 10 minutes. You can start reading the opening chapters while the rest is still being written.