Seeing Words: A Practical Guide to Visualization in Word2vec and Machine Learning
Master the Art of Visualizing High-Dimensional Data and Understanding Neural Networks
Understand what your machine learning models are actually learning.
207 pages10 chaptersApr 4, 2026Machine Learning
About this book
Word2vec embeddings and neural networks operate in high-dimensional spaces that human minds can't directly perceive—but visualization techniques unlock their secrets. This guide teaches you how to transform abstract numerical representations into clear, interpretable visualizations that reveal semantic relationships, identify biases, and validate model behavior. You'll master practical techniques including t-SNE, UMAP, and PCA, learn when to apply each method, and discover how to create interactive visualizations that enable deeper exploration. Whether you're debugging a model, communicating results to stakeholders, or conducting research, these visualization skills will fundamentally change how you understand and work with machine learning systems. Move beyond black-box models to genuine interpretability.
Table of contents
- IntroductionWhy Visualization Matters in Machine Learning, What You'll Learn in This Book, How to Use This Guide, Prerequisites and AssumptionsRead below
- Chapter 1: Understanding Word2vec and EmbeddingsWhat Are Word Embeddings?, How Word2vec Creates Semantic Representations, The Curse of Dimensionality: Why We Need Visualization, Semantic Relationships Hidden in High Dimensions
- Chapter 2: Foundations of Dimensionality ReductionWhy Reduce Dimensions?, Linear vs. Nonlinear Reduction Techniques, Understanding Information Loss and Trade-offs, Choosing the Right Approach for Your Data
- Chapter 3: Principal Component Analysis (PCA)PCA Fundamentals and Mathematical Principles, Implementing PCA for Word Embeddings, Interpreting PCA Visualizations, Strengths, Limitations, and When to Use PCA
- Chapter 4: t-SNE: Revealing Local Structuret-SNE Theory and How It Preserves Neighborhoods, Implementing t-SNE with Practical Parameters, Interpreting Clusters and Patterns in t-SNE, Common Pitfalls and Misinterpretations
- Chapter 5: UMAP: Balancing Local and Global StructureUMAP Advantages Over t-SNE, Implementing UMAP for Embeddings, Tuning UMAP Parameters for Your Data, Practical Applications and Real-World Examples
- Chapter 6: Creating Effective VisualizationsDesign Principles for Data Visualization, Color Schemes, Labels, and Annotations, Static vs. Interactive Visualizations, Tools and Libraries for Creating Visualizations
- Chapter 7: Interactive Visualization TechniquesBenefits of Interactive Exploration, Building Interactive Dashboards with Plotly and Bokeh, Hover Tooltips, Filtering, and Zooming, Sharing and Deploying Interactive Visualizations
- Chapter 8: Analyzing Semantic Relationships and BiasesVisualizing Word Analogies and Relationships, Detecting and Visualizing Model Biases, Exploring Semantic Clusters and Categories, Comparative Analysis Across Different Models
- Chapter 9: Advanced Visualization Techniques3D Visualizations and When to Use Them, Multi-View and Comparative Visualizations, Visualizing Temporal Evolution of Embeddings, Creating Custom Visualization Methods
- Chapter 10: Practical Case Studies and ApplicationsCase Study: Analyzing Language Models, Case Study: Domain-Specific Embeddings, Case Study: Debugging Model Performance
- ConclusionKey Takeaways, Next Steps in Your Visualization Journey
- Appendix: Code Examples and ResourcesEssential Code Snippets, Recommended Libraries and Tools, Further Reading and Research Papers
Introduction
There is a moment that many machine learning practitioners recognize immediately. You have trained a Word2vec model, the loss has converged, the evaluation metrics look reasonable, and yet you have almost no idea what the model has actually learned. The numbers are there, hundreds of dimensions per word, millions of parameters, but they sit in a file like a locked room. You know something meaningful is inside. You just cannot see it. That gap between a model that works and a model you genuinely understand is exactly what this book is designed to close.
Visualization is the key that opens that room. When you project word embeddings into two or three dimensions and plot them, something remarkable happens. Words that share meaning cluster together. Analogies appear as parallel lines. Biases that were invisible in raw numbers suddenly become obvious patterns on a screen. The model stops being a black box and starts behaving like a map of language itself. This transformation from numbers to insight is not just aesthetically satisfying. It is practically essential for anyone who wants to build, debug, or communicate about machine learning systems with real confidence.
This guide is built around a simple conviction: visualization is not a finishing touch you add after the real work is done. It is a core analytical skill, as fundamental to machine learning practice as knowing how to tune hyperparameters or evaluate a loss function. The techniques covered here, including Principal Component Analysis (PCA), t-SNE, and UMAP, are not decorative tools. They are instruments for discovery. Used well, they reveal structure that no amount of staring at weight matrices will ever show you. Used poorly, they mislead. This book teaches you to use them well.
The chapters ahead move from foundational concepts to practical implementation to advanced applications. Whether you are new to embedding visualization or looking to sharpen skills you already have, the goal is the same: to give you a reliable, repeatable workflow for turning high-dimensional data into clear, interpretable, and actionable visual insights. By the time you finish, you will not just know how to make visualizations. You will know what they mean, when to trust them, and how to use them to make better decisions about your models.
Why Visualization Matters in Machine Learning
Machine learning models, especially those working with language, operate in spaces that human perception cannot directly access. A standard Word2vec model represents each word as a vector with 100 to 300 dimensions. A large language model might use embeddings with thousands of dimensions. No human being can look at a 300-dimensional vector and intuit what it means. This is not a limitation of intelligence. It is a hard constraint of human perception, which evolved to navigate a three-dimensional world. Visualization is the engineering solution to that biological constraint.
The practical stakes are high. Consider what happens when a model behaves unexpectedly in production. A sentiment classifier starts mislabeling certain product categories. A recommendation engine clusters unrelated items together. A translation model produces awkward phrasing for a specific domain. In each case, the root cause is often something structural in the embeddings, a cluster that should not exist, a separation that should not be there, a bias baked in from training data. Without visualization, diagnosing these problems means guessing. With visualization, the problem often becomes immediately obvious.
A 2016 study by researchers at Google Brain found that visualizing neural network activations was one of the most effective methods for identifying unexpected model behavior, outperforming purely metric-based debugging approaches in several benchmark tasks.[1]
Visualization also plays a critical role in model validation. Metrics like cosine similarity scores or nearest-neighbor accuracy tell you that a model is performing well on average. They do not tell you whether the model has learned the right things for the right reasons. A visualization of word clusters can reveal, for example, that a model trained on news data has learned to associate certain demographic terms with crime-related vocabulary, a bias that aggregate metrics would never surface. Seeing that pattern directly changes what you do next.
Communication is another dimension where visualization earns its place. Data scientists regularly need to explain model behavior to stakeholders who do not have technical backgrounds. A scatter plot showing that medical terms cluster together, legal terms form their own group, and financial vocabulary occupies a distinct region of the embedding space communicates something meaningful in seconds. The same information expressed as a table of cosine similarity scores communicates almost nothing to a non-specialist audience. Visualization translates between the language of mathematics and the language of human understanding.
There is also a research dimension to consider. Many of the most important discoveries about how language models work have come directly from visualization experiments. The famous finding that Word2vec embeddings encode analogical relationships, such as king - man + woman = queen, was not predicted theoretically. It was discovered by exploring the geometry of the embedding space.[2] Visualization is not just a reporting tool. It is a discovery tool.
Finally, visualization builds intuition in a way that reading papers and studying equations simply cannot replicate. When you have spent time exploring embedding spaces visually, you develop a feel for how models behave. You start to anticipate what a poorly trained model will look like versus a well-trained one. You recognize the signature of overfitting, the fingerprint of domain mismatch, the shape of a model that has learned syntax but not semantics. That intuition is genuinely valuable, and it only comes from looking at data directly.
What You'll Learn in This Book
This book covers the full arc of embedding visualization, from understanding why high-dimensional data needs to be reduced before it can be visualized, to building interactive dashboards that let you explore model behavior in real time. The progression is deliberate. Each chapter builds on the one before it, so that by the time you reach the advanced techniques, you have the conceptual foundation to use them correctly rather than just mechanically.
The first section of the book establishes the conceptual groundwork. You will learn what word embeddings actually are, how Word2vec creates them, and why the high-dimensional spaces they inhabit create such a fundamental challenge for human interpretation. This is not just background material. Understanding the structure of embedding spaces is what allows you to choose the right visualization technique and interpret the results correctly. Skipping this foundation leads to the most common visualization mistakes, including trusting t-SNE cluster sizes or misreading PCA variance.
The core technical section covers the three most important dimensionality reduction techniques in practical use today:
- PCA (Principal Component Analysis): A linear technique that is fast, deterministic, and excellent for understanding global structure and variance in your embeddings.
- t-SNE (t-Distributed Stochastic Neighbor Embedding): A nonlinear technique that excels at revealing local cluster structure, with important caveats about what its output does and does not mean.
- UMAP (Uniform Manifold Approximation and Projection): A newer nonlinear technique that balances local and global structure better than t-SNE and scales more efficiently to large datasets.
For each technique, you will get the theory you need to understand what the algorithm is actually doing, practical implementation code you can run immediately, guidance on parameter tuning, and clear explanations of how to interpret the output correctly. The goal is not just to show you how to run these algorithms. It is to make sure you understand what the results mean and where they can mislead you.
The visualization design section addresses something that technical books often skip entirely: how to make visualizations that actually communicate effectively. Choosing the right color scheme, placing labels intelligently, deciding when interactivity adds value versus when it adds noise, these decisions matter enormously for whether a visualization does its job. You will learn design principles grounded in perceptual science, not just aesthetic preference.
The interactive visualization chapters are particularly practical. You will learn to build dashboards using Plotly and Bokeh that allow you to hover over individual words, filter by semantic category, zoom into dense clusters, and explore the embedding space in ways that static charts simply cannot support. These skills are increasingly important as embedding spaces grow larger and more complex.
The final section applies everything to real-world scenarios. Case studies cover analyzing general-purpose language models, working with domain-specific embeddings (such as those trained on medical or legal text), and using visualization as a debugging tool when model performance is unexpectedly poor. These chapters are designed to show you how the techniques fit together in practice, not just in isolation.
How to Use This Guide
This book is designed to be read sequentially on a first pass. The chapters build on each other in a specific order, and jumping ahead to the t-SNE or UMAP chapters without reading the dimensionality reduction foundations first is likely to leave you with gaps that cause problems later. That said, once you have read through the book once, it works well as a reference. Each chapter is self-contained enough that you can return to specific sections when you need a refresher on parameter tuning or a reminder of PCA's limitations.
The code examples throughout the book are written in Python, using libraries that are standard in the data science ecosystem. You will see examples using scikit-learn for PCA, openTSNE and sklearn for t-SNE, umap-learn for UMAP, and plotly and bokeh for interactive visualizations. All of these libraries are open source and freely available. The code is written to be readable and adaptable, not just copy-paste functional. Understanding what each line does is more valuable than having working code you cannot modify.
A practical approach to using this book looks like this:
- Read each chapter once for conceptual understanding, without worrying too much about running the code.
- On a second pass, work through the code examples with your own data or with the example datasets referenced in the appendix.
- After completing the book, use the case study chapters as templates for your own projects.
- Return to specific chapters as reference material when you encounter specific challenges in your work.
The case study chapters in particular are worth spending extra time on. They are structured to show not just the final visualization but the reasoning process behind it: why a particular technique was chosen, what the initial results revealed, how parameters were adjusted, and what conclusions were ultimately drawn. Following that reasoning process is more valuable than any single technique or code snippet, because it teaches you how to think about visualization problems, not just how to solve specific ones.
If you are working in a team environment, the chapters on design principles and interactive visualization are especially worth sharing with colleagues who may not have deep technical backgrounds. One of the most underappreciated skills in machine learning is the ability to create visualizations that non-specialists can interpret correctly. The design chapters give you the vocabulary and principles to do that well, and the interactive visualization chapters give you the tools to create outputs that invite exploration rather than just passive viewing.
Throughout the book, you will find callout boxes highlighting common mistakes and how to avoid them. Pay particular attention to these. Many of the most persistent misconceptions about embedding visualization, such as the belief that t-SNE cluster sizes are meaningful or that PCA components always correspond to interpretable linguistic features, come from skipping the caveats. The warnings in this book are not boilerplate. They reflect real errors that practitioners make regularly, often with real consequences for model development decisions.
Finally, treat the footnotes and citations as a starting point for deeper exploration. The field of embedding visualization is active and evolving. The techniques covered here represent the current practical standard, but new methods are emerging regularly. Building the habit of following citations into primary literature will keep your skills current long after you have finished this book.
Prerequisites and Assumptions
This book assumes you are an intermediate practitioner. That means you have worked with machine learning models before, you are comfortable with Python, and you have at least a passing familiarity with concepts like neural networks, training data, and model evaluation. You do not need to be an expert in any of these areas, but you should not be encountering them for the first time here. If terms like loss function, gradient descent, or cosine similarity are unfamiliar, spending some time with an introductory machine learning resource first will make this book significantly more useful.
On the mathematics side, the book assumes comfort with basic linear algebra concepts: vectors, matrices, dot products, and the general idea of a high-dimensional space. You do not need to be able to derive the singular value decomposition from scratch, but you should understand what a vector is and what it means for two vectors to be similar. For the more mathematically involved sections, particularly the PCA and t-SNE theory chapters, the explanations are designed to build intuition rather than rigor. The goal is always practical understanding, not mathematical proof.
Here is a concrete checklist of what you should be comfortable with before starting:
- Python programming: Writing functions, working with NumPy arrays, using pip to install packages, and reading library documentation.
- Basic machine learning concepts: Training and test sets, model evaluation metrics, the general idea of how neural networks learn from data.
- Linear algebra fundamentals: Vectors, matrices, and the concept of distance or similarity between vectors.
- Familiarity with NLP basics: What tokenization is, what a vocabulary is, and the general idea that words can be represented numerically.
- Basic data visualization experience: Having used matplotlib or a similar library to create at least simple plots.
You do not need prior experience with Word2vec specifically. Chapter 1 covers how Word2vec works in enough detail that you will be able to follow everything that comes after, even if you have never trained a Word2vec model yourself. Similarly, you do not need prior experience with dimensionality reduction. The chapters on PCA, t-SNE, and UMAP each start from first principles before moving into implementation details.
What you do need is a willingness to engage with both the theory and the practice. This book deliberately avoids the trap of being purely conceptual on one hand or purely a code tutorial on the other. The theory matters because it determines whether you interpret your visualizations correctly. The practice matters because visualization is ultimately a hands-on skill that develops through doing, not just reading. The most effective way to use this book is to treat every code example as an invitation to experiment, not just a recipe to follow.
One assumption worth stating explicitly: this book does not assume you have access to expensive hardware or proprietary datasets. All of the techniques covered here can be run on a standard laptop for reasonably sized datasets. For larger datasets, the book discusses strategies for sampling and approximation that make visualization tractable without requiring a GPU cluster. The appendix includes pointers to freely available pre-trained embeddings and datasets that you can use to work through the examples if you do not have your own data to start with.
If you find yourself uncertain about any of the prerequisites, the further reading section in the appendix includes recommended resources for filling specific gaps. The goal is not to gatekeep this material behind a long list of prerequisites, but to be honest about what background knowledge will make the content most accessible. With the right foundation in place, the techniques in this book are genuinely learnable by any motivated practitioner, and the payoff in terms of model understanding and debugging capability is substantial.
Notes
Introduction
- 1. C. Olah and others, "Feature Visualization," Distill, 2017
- 2. T. Mikolov and others, Efficient Estimation of Word Representations in Vector Space. arXiv:1301.3781, 2013
This is the end of the free sample. The full book has 10 chapters.
Want this book written for you?
Tell us your goals and background, and get your own version of this book, tailored by AI to you.


Benefits of AI-tailored books
- Read one book, not ten:
- all the Machine Learning knowledge you need, gathered into a single book.
- Save days of learning:
- tell us your goals, choose your topics, and the whole book is built around them.
- Learn effortlessly:
- Machine Learning book written for your specific background and expertise.
- Understand at a glance:
- includes charts, tables, timelines, checklists, decision trees, and more.
- Stay current:
- written the day you order it, not years ago.
- Trust what you read:
- every book is checked for accuracy, with real research when your subject needs it.
Create your unique book in 3 steps
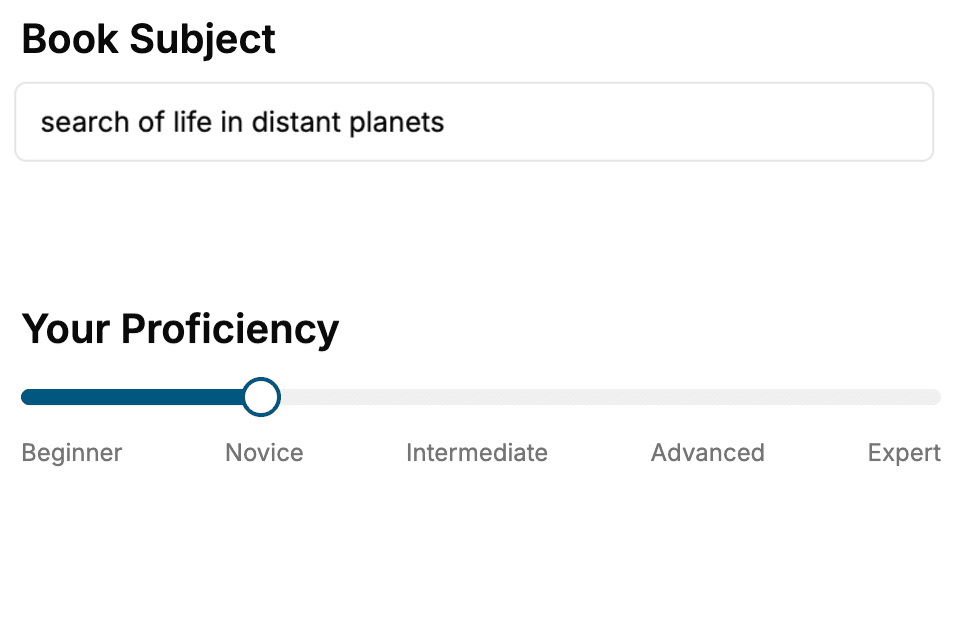
- 1. Select your focus
Select the focus of your Machine Learning book and share your background
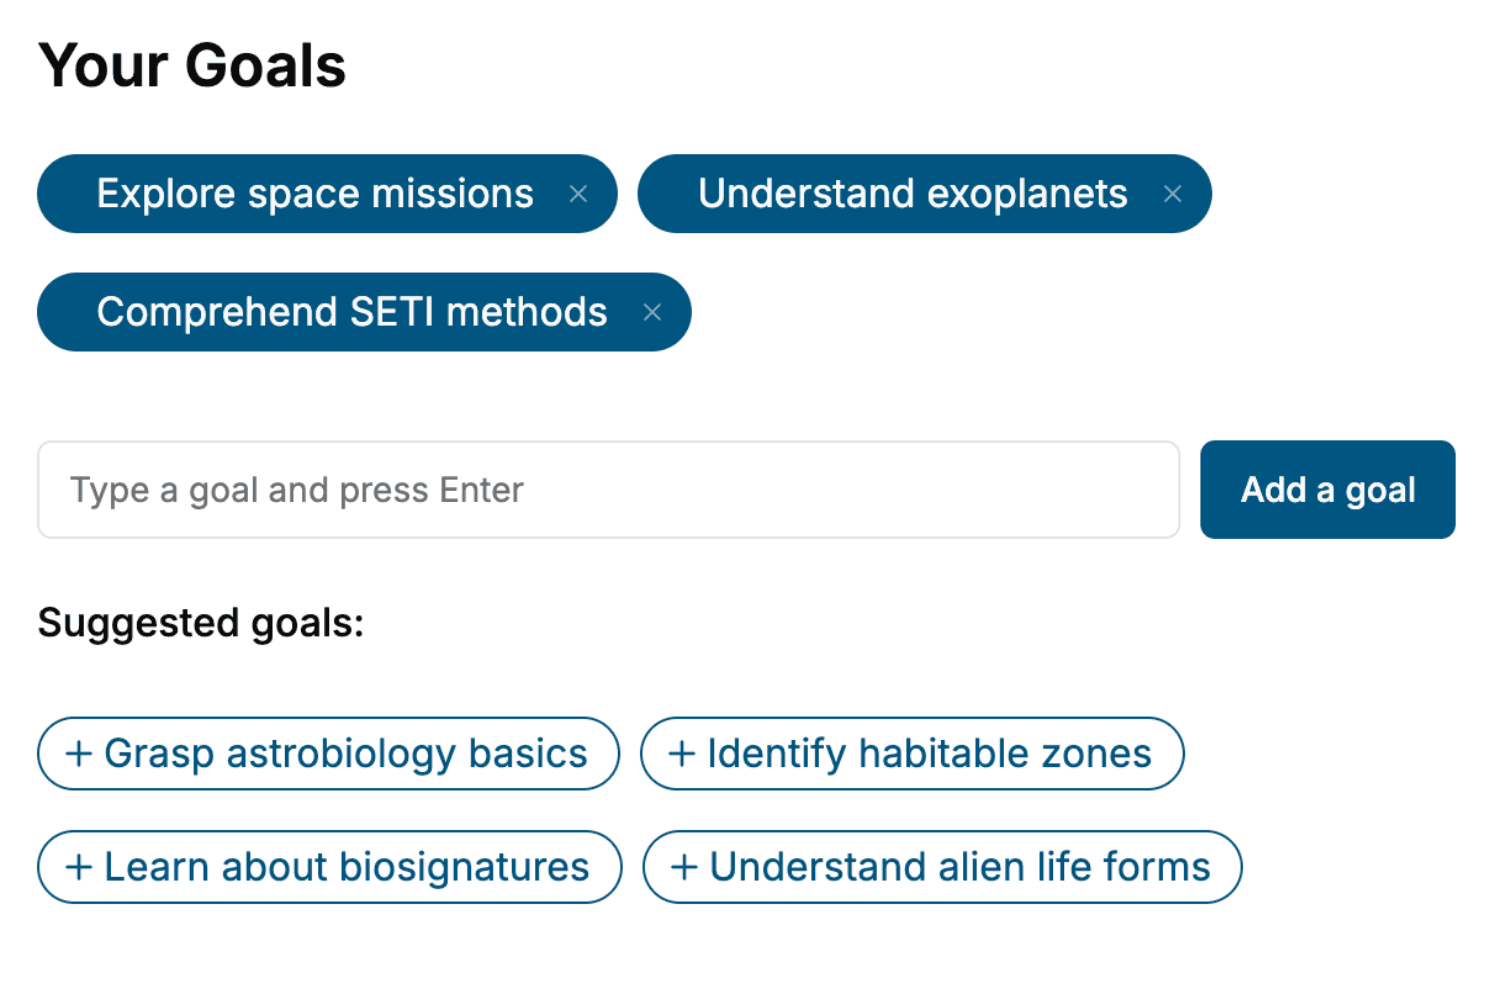
- 2. Personalize your book
Specify your goals and choose sub-topics to include
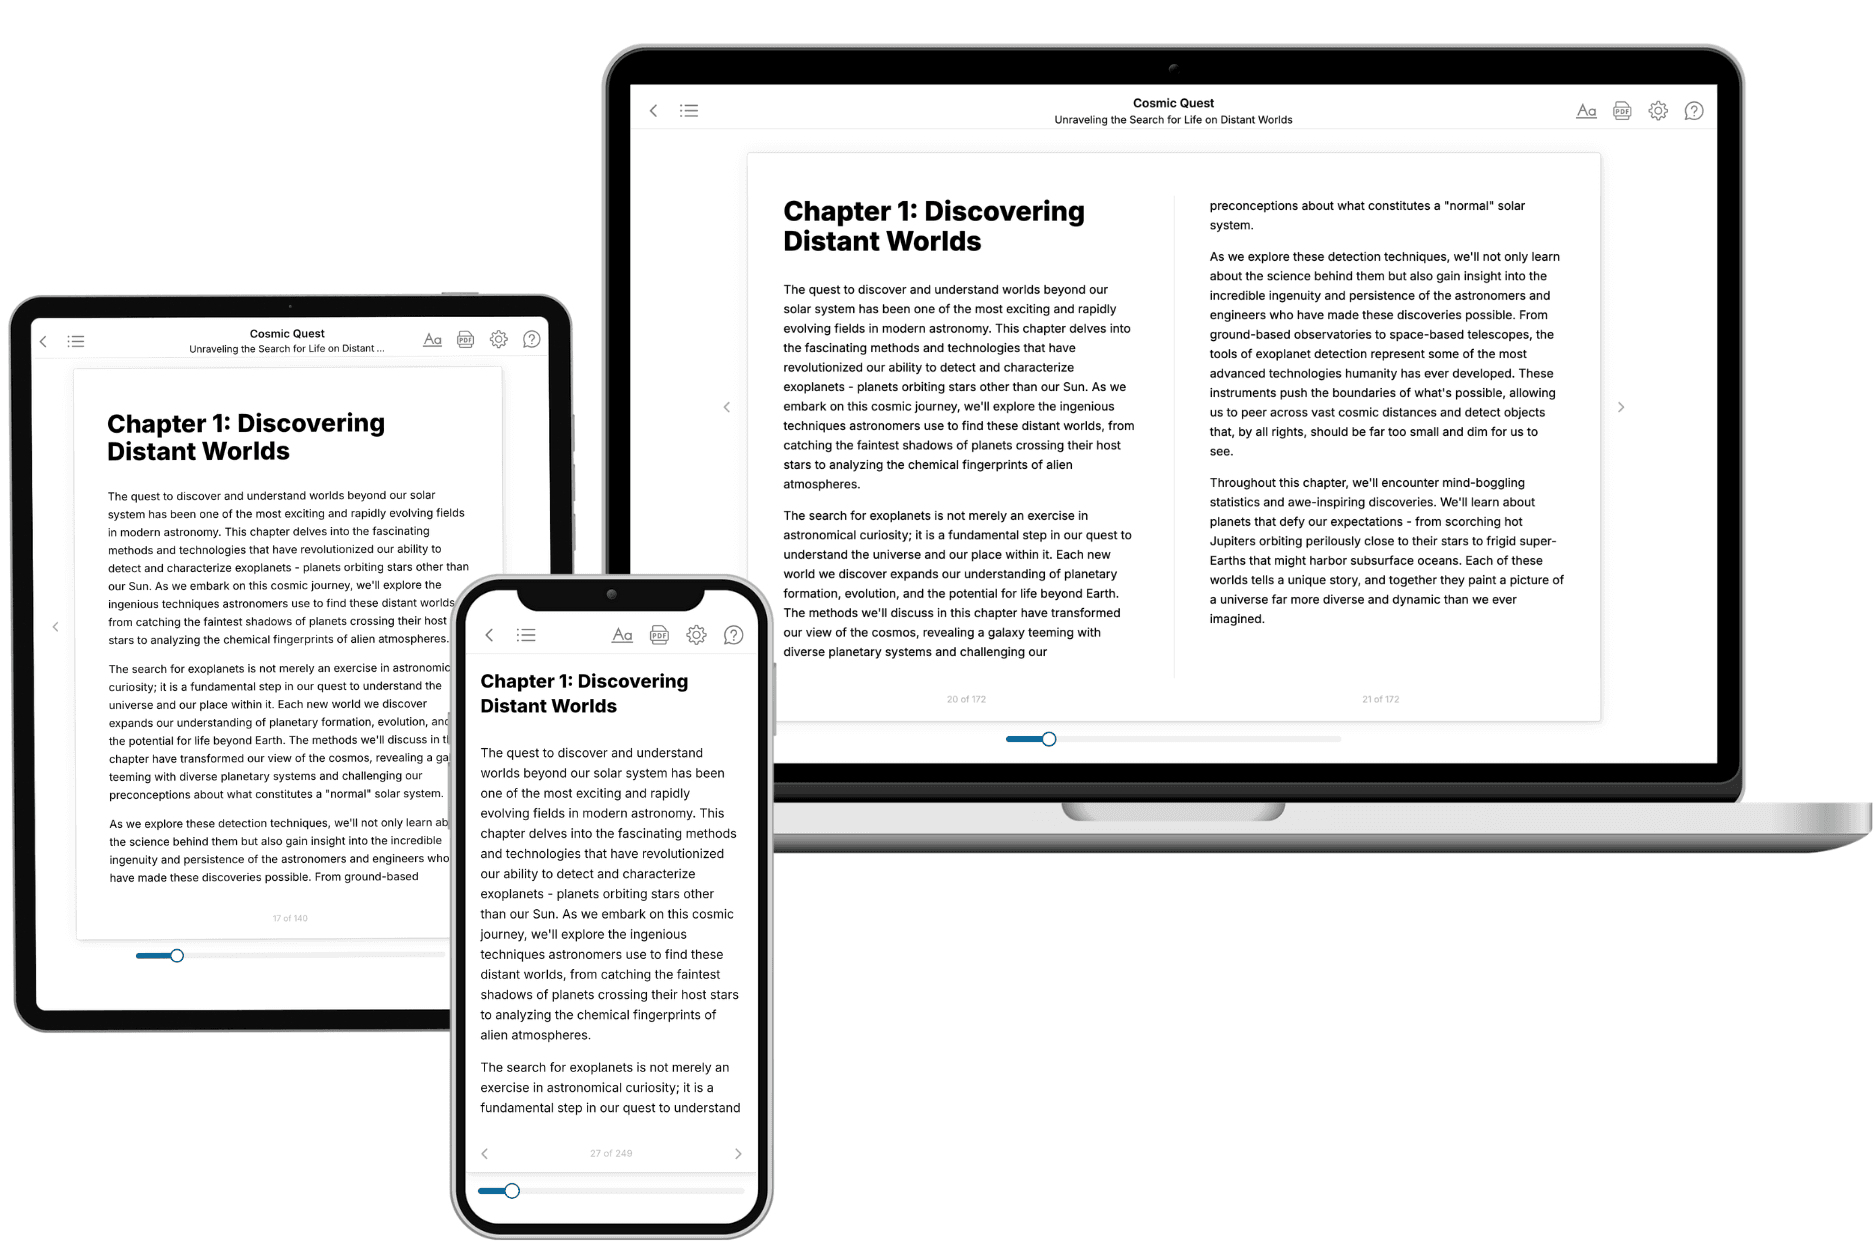
- 3. Get your tailored book
Your book is ready in 10 minutes. Read it online, download as EPUB or PDF, or send to Kindle.
Frequently asked questions
- What is TailoredRead?
TailoredRead creates complete, full-length nonfiction ebooks, written specifically for you. Tell us what you want to learn and why, and TailoredRead writes you a complete ebook on it, with charts, tables, and diagrams throughout. Read it online, on Kindle, or on any e-reader, or download it as a PDF or EPUB. Every book is written fresh the day you order it.
- How is the book tailored to me?
Before anything is written, you answer a few short questions about your goals, your background, and the topics you care about. Your book is then planned around your answers: written at your level, focused on your goals, and covering the topics you chose, instead of the one-size-fits-all book a store sells everyone.
- Will it read like generic AI content?
No. Your book isn't a chat transcript: it's planned chapter by chapter before a single word is written, told in a clear book voice, and explains ideas visually with charts, tables, and diagrams. After writing, every book goes through an editorial pass that polishes chapters so the book reads consistent from start to finish. Judge for yourself: browse thousands of sample books on our Explore Books page.
- How accurate is the content?
Our AI first checks whether your subject needs live research. Niche and fast-moving subjects are researched before writing, and the book plan and chapters are grounded in what it finds. After writing, every book goes through a quality pass that checks its facts and consistency, and researched books list their sources in a Notes section at the back.
- How long is the book?
You choose the length: Comprehensive (250-300 pages), Detailed (150-200 pages), Essential (70-100 pages), or Short (30-50 pages).
- Does the book include visuals?
Yes. Every book includes charts, tables, and diagrams: timelines, checklists, step-by-step guides, decision trees, comparison tables, matrices, and bar charts. A typical book includes dozens of these visual elements.
- Can I read it on Kindle? What formats can I download?
Yes. Every book can be read in our online reader or downloaded as a PDF or EPUB. The EPUB can be opened with Kindle, Apple Books, Kobo, and any e-reader. The Commercial and Author licenses also include an editable Word (DOCX) and Markdown download.
- How much does it cost?
About the price of a regular ebook. The exact price depends on your book's length and complexity, from $2 for the shortest books to $35 for the most comprehensive, and it's shown when you review your book, before you commit to anything. Each book is a one-time purchase, yours to keep, no subscription. Licenses that let you share, teach, or publish your book range from $35.99 to $49.99.
- Can I preview the book before purchasing?
Before you pay, you'll see what your book will cover: the title, a detailed description, the estimated length, and the complete chapter-by-chapter table of contents, so you know what you're getting before you decide. The full text itself is written after you purchase.
- How long does it take to create a book?
About 10 minutes. You can start reading the opening chapters while the rest is still being written.