Spectral Analysis Fundamentals
Master Signal Processing Through Frequency Domain Techniques
What if the patterns you're looking for in your data are hiding in plain sight—just in the wrong domain?
207 pages9 chaptersAug 2, 2026Signal Processing
About this book
Spectral analysis transforms how you understand signals by revealing frequency components that time-domain inspection alone cannot expose. This book guides you through the essential concepts and practical techniques of spectral analysis, from foundational Fourier theory to advanced frequency-domain methods. You'll learn why the Fast Fourier Transform revolutionized signal processing, how windowing functions improve your results, and when to apply different spectral estimation techniques. Whether you're analyzing audio signals, monitoring equipment vibrations, processing medical data, or optimizing telecommunications systems, spectral analysis provides the tools to extract meaningful insights. This guide combines mathematical rigor with practical examples, showing you not just how spectral analysis works, but why it matters and how to apply it effectively to real-world problems. Master the frequency domain and unlock a deeper understanding of the signals that surround you.
Table of contents
- IntroductionWhy Spectral Analysis Matters, Time Domain vs. Frequency Domain, Your Journey Through This BookRead below
- Chapter 1: Foundations of Signal ProcessingWhat Are Signals and Why Analyze Them?, Continuous vs. Discrete Signals, The Sampling Theorem and Nyquist Frequency, Understanding Aliasing and Its Consequences
- Chapter 2: The Fourier Transform: Theory and IntuitionThe Core Concept: Decomposing Signals into Frequencies, Continuous Fourier Transform, Discrete Fourier Transform (DFT), Key Properties and Theorems
- Chapter 3: The Fast Fourier Transform AlgorithmWhy FFT Changed Everything, How the FFT Algorithm Works, Implementing and Using FFT in Practice, Computational Complexity and Performance Considerations
- Chapter 4: Windowing and Spectral LeakageUnderstanding Spectral Leakage, Common Window Functions and Their Characteristics, Choosing the Right Window for Your Application, Resolution vs. Leakage Trade-offs
- Chapter 5: Power Spectral Density and Energy AnalysisWhat Power Spectral Density Tells You, Methods for Estimating Power Spectral Density, Parseval's Theorem and Energy Conservation, Practical Applications of PSD Analysis
- Chapter 6: Advanced Spectral Estimation TechniquesPeriodogram and Modified Periodogram Approaches, Welch's Method for Improved Estimates, Parametric Methods: AR, ARMA, and MEM, Comparing Estimation Methods and When to Use Each
- Chapter 7: Time-Frequency Analysis and WaveletsThe Limitations of Pure Frequency Analysis, Short-Time Fourier Transform (STFT), Wavelet Analysis: Capturing Time and Frequency, Practical Applications of Wavelet Analysis
- Chapter 8: Real-World Applications and Case StudiesAudio Signal Processing and Music Analysis, Vibration Monitoring and Fault Detection, Biomedical Signal Analysis: EEG, ECG, and Beyond, Telecommunications and Radar Signal Processing
- Chapter 9: Implementation and Practical ConsiderationsTools and Libraries for Spectral Analysis, Common Pitfalls and How to Avoid Them, Optimization Strategies for Large-Scale Analysis, Validating and Debugging Your Spectral Analysis
- ConclusionKey Takeaways and Core Principles, Future Directions in Spectral Analysis
- Glossary
- Further Reading and Resources
Introduction
A microphone records a singer's voice. A sensor measures vibrations on a factory floor. An electrode captures electrical activity from the brain. In each case, the raw data looks like a jagged, irregular waveform scrolling across a screen — a time-domain signal that tells you something is happening, but rarely tells you what. The moment you transform that waveform into the frequency domain, the picture changes completely. Peaks emerge at specific frequencies. Noise separates from signal. A hidden fault frequency in a bearing, invisible in the raw trace, suddenly stands out like a spike on a flat horizon.
That transformation is what spectral analysis is about. It is not a single technique but a family of methods, all built on the same foundational insight: most signals of practical interest are composed of multiple frequency components mixed together, and separating those components reveals structure that time-domain inspection alone cannot expose. The tools range from the classical Fourier transform to modern wavelet analysis, from simple periodograms to parametric autoregressive models. Each tool has a purpose, a set of assumptions, and a set of trade-offs worth understanding before you reach for it.
This book is written for people who already have some grounding in signal processing and computer science and want to move from surface-level familiarity to genuine working knowledge. The goal is not to survey every technique that exists, but to build a coherent understanding of why each method works, when it applies, and what can go wrong when you use it carelessly. Theory and practice are treated as inseparable. Every concept is grounded in concrete examples, and every example points back to a principle you can carry into your own work.
The path through the material is deliberate. Foundations come first, because errors made at the sampling stage propagate through every subsequent analysis. From there, the book builds upward through the Fourier transform, the fast Fourier transform algorithm, windowing, power spectral density, advanced estimation methods, and time-frequency analysis. Real-world applications and implementation considerations close the journey. By the end, the frequency domain should feel less like an abstract mathematical space and more like a practical lens you reach for naturally when a signal problem lands on your desk.
Why Spectral Analysis Matters
Consider a rotating machine running at 3,000 RPM. A vibration sensor attached to its housing produces a continuous stream of acceleration data. Looking at that raw waveform, you might notice the signal is noisy and somewhat periodic, but distinguishing a developing bearing fault from normal operational vibration is nearly impossible by eye. Apply a spectral analysis, and the bearing fault frequency — a predictable harmonic determined by the bearing's geometry and rotation speed — appears as a distinct peak in the frequency domain. Maintenance engineers use exactly this approach to catch failures weeks before they cause unplanned downtime.[1]
The same logic applies across disciplines. In audio processing, spectral analysis separates the fundamental frequency of a musical note from its overtones, enabling pitch detection, equalization, and noise reduction. In telecommunications, the Doppler spectrum of a radar return reveals the velocity of a moving target. In neuroscience, decomposing an EEG signal into its EEG spectral bands — delta, theta, alpha, beta, and gamma — gives clinicians and researchers a window into brain states that raw voltage traces cannot provide. The frequency domain is not a mathematical abstraction; it is a practical measurement space where meaningful physical quantities live.
What makes spectral analysis especially valuable is its generality. The same mathematical framework that identifies a fault frequency in a gearbox also identifies a carrier frequency in a radio signal, a respiratory rate in a photoplethysmography trace, or a dominant period in a climate dataset. Once you understand the core machinery, you can apply it across domains with relatively modest adaptation. The concepts transfer; only the physical interpretation changes.
There is also a computational dimension worth appreciating from the start. The fast Fourier transform algorithm, introduced by Cooley and Tukey in 1965, reduced the computational cost of computing a discrete Fourier transform from O(n²) to O(n log n).[2] That reduction is not a minor convenience. For a signal with one million samples, it represents the difference between billions of operations and roughly twenty million. It is what made real-time spectral analysis possible on hardware that would otherwise be far too slow, and it is why the FFT is one of the most consequential algorithms in the history of computing.
Understanding spectral analysis also means understanding its limits. The Fourier transform assumes a signal's frequency content is stationary — that the same frequencies are present throughout the entire observation window. Many real signals violate this assumption. Speech, music, seismic events, and biomedical signals all change their frequency content over time. Recognizing when the standard Fourier approach breaks down, and knowing which alternative to reach for, is as important as knowing how to apply the transform in the first place.
Finally, spectral analysis matters because it is increasingly accessible. Modern scientific computing libraries in Python, MATLAB, Julia, and R provide well-tested FFT implementations that handle the numerical details automatically. But accessibility creates its own risk: it is easy to get a result without understanding whether that result is meaningful. Knowing the theory behind the tools is what separates a practitioner who can interpret and trust their output from one who is simply running functions and hoping for the best.
A spectral analysis result is only as reliable as the decisions made before the transform is computed: the sampling rate, the window function, the segment length, and the estimation method. Getting those decisions right requires understanding, not just software.
Time Domain vs. Frequency Domain
The time domain is the natural way most people think about signals. A time-domain representation shows how a signal's amplitude changes over time. An audio waveform, a stock price chart, a temperature log — all of these are time-domain representations. They are intuitive because time is the dimension we experience directly. You can see when a spike occurred, how long a burst lasted, and whether the signal is growing or decaying.
The frequency domain shows the same information from a different angle. Instead of plotting amplitude against time, it plots amplitude (or power) against frequency. Each point on a frequency-domain plot answers the question: how much of this frequency is present in the signal? A pure sine wave at 440 Hz, for example, appears in the time domain as a smooth oscillation and in the frequency domain as a single vertical spike at 440 Hz with nothing elsewhere. A chord of three notes appears in the time domain as a complex, irregular waveform and in the frequency domain as three distinct spikes, one for each note's fundamental frequency.
The two representations are mathematically equivalent. No information is lost when you move from one to the other. The Fourier transform converts a signal from the time domain to the frequency domain, and its inverse converts it back. This equivalence is not obvious at first, but it is one of the most important facts in signal processing. It means you can choose whichever domain makes a particular problem easier to solve, perform your analysis there, and then return to the other domain if needed.
Some operations are far simpler in the frequency domain than in the time domain. Filtering is the clearest example. Removing a specific frequency band from a signal requires convolution in the time domain, which is computationally expensive for long signals. In the frequency domain, the same operation becomes simple multiplication, thanks to the convolution theorem. You multiply the signal's frequency-domain representation by a filter's frequency response, then take the inverse transform. This is why virtually all practical digital filtering is implemented in the frequency domain.
Other operations are easier in the time domain. Detecting the exact moment a transient event occurs, for instance, is straightforward when you can see the waveform directly. The frequency domain tells you that a transient contains high-frequency energy, but it does not tell you when that energy arrived — at least not in a standard Fourier analysis. This is the fundamental tension between time and frequency representations, and it is what motivates the time-frequency methods covered later in this book, including the short-time Fourier transform and the wavelet transform.
A useful way to build intuition for the frequency domain is to think about musical instruments. When a violin plays the note A4 (440 Hz), the string vibrates not just at 440 Hz but also at 880 Hz, 1320 Hz, and higher harmonics. The relative amplitudes of these harmonics determine the instrument's timbre — why a violin and a flute playing the same note sound different. The time-domain waveforms of the two instruments look quite different, but the frequency-domain representation makes the harmonic structure explicit and comparable. Spectral analysis, in this sense, is a way of reading the harmonic fingerprint of any signal.
It is also worth being clear about what the frequency domain does not show by default. A standard Fourier spectrum gives you the average frequency content over the entire analysis window. If a signal's frequency content changes over time — a singer moving from one note to another, a machine accelerating through different speed ranges — the spectrum smears those changes together into a single averaged picture. Recognizing this limitation early prevents a common class of misinterpretation, where a broad spectral peak is mistaken for a single stable frequency when it actually reflects a time-varying one.
The practical takeaway is this: choose your analysis domain based on what question you are trying to answer. Time domain for timing and amplitude; frequency domain for frequency content and filtering; time-frequency representations for signals whose frequency content evolves. Most real-world signal processing problems benefit from looking at the data in more than one domain before drawing conclusions.
Your Journey Through This Book
The chapters in this book are ordered to build understanding progressively. Each chapter assumes the concepts from the previous ones, so working through them in sequence gives you the strongest foundation. That said, if you have solid prior knowledge in a specific area, the chapters are written to be self-contained enough that you can skip ahead and return to earlier material when a gap appears.
The first chapter establishes the vocabulary and physical intuition of signals. It covers what signals are, how they are sampled, and what the Nyquist-Shannon sampling theorem requires. The concept of aliasing — what happens when you sample too slowly — is treated in detail, because aliasing errors are among the most common and most damaging mistakes in spectral analysis. Understanding the role of the anti-aliasing filter before the analog-to-digital conversion stage is part of that foundation.
The second chapter builds mathematical and geometric intuition for the Fourier transform. Rather than leading with formulas, it starts with the question of why any signal can be decomposed into sinusoids and what that decomposition means physically. The continuous Fourier transform and the discrete Fourier transform are both covered, along with key properties like linearity, the shift theorem, and the convolution theorem. The goal is to make the transform feel like a natural tool rather than an opaque formula.
The third chapter explains the fast Fourier transform algorithm in detail. The Cooley-Tukey algorithm, the divide-and-conquer structure, butterfly operations, and twiddle factors are all explained with enough depth to understand why the algorithm works, not just that it does. Practical topics like zero-padding and choosing FFT sizes are also covered, because these decisions directly affect the quality of your spectral estimates.
The fourth chapter addresses spectral leakage and window functions. Leakage is one of the most misunderstood phenomena in spectral analysis, and it causes real errors in practice. The chapter explains why leakage occurs, how window functions like the Hann window, Hamming window, Blackman window, and Kaiser window reduce it, and how to navigate the resolution-leakage trade-off for different applications. Specific guidance on window selection is provided for common scenarios.
The fifth chapter covers power spectral density and energy analysis. It defines what power spectral density and energy spectral density actually measure, explains Parseval's theorem and why energy conservation across domains matters, and shows how to interpret the noise floor in a spectral estimate. These concepts are essential for any application where you need to quantify signal energy rather than just identify frequencies.
The sixth chapter surveys advanced spectral estimation methods. The basic periodogram is a starting point, but it has well-known limitations. Welch's method and Bartlett's method improve on it through averaging. Parametric approaches — the autoregressive model, the ARMA model, and the maximum entropy method — offer higher frequency resolution for short data records at the cost of model assumptions. The chapter provides a practical comparison to help you choose the right method for your data length, noise level, and resolution requirements.
The seventh chapter moves beyond the stationarity assumption of the Fourier transform. The short-time Fourier transform and its visual output, the spectrogram, are introduced as the first step toward time-frequency analysis. The Heisenberg uncertainty principle (time-frequency) is explained as a fundamental constraint on how precisely you can localize a signal in both time and frequency simultaneously. The wavelet transform — both continuous and discrete — is then presented as a more flexible alternative, with its multiresolution analysis capability and the role of the mother wavelet explained in practical terms.
The eighth chapter grounds all of the preceding techniques in concrete real-world domains. Audio processing, mechanical vibration monitoring, biomedical signal analysis, and telecommunications each receive dedicated treatment. Specific examples include detecting bearing fault frequencies in rotating machinery, interpreting EEG spectral bands in clinical neuroscience, and analyzing the Doppler spectrum in radar systems. These case studies are not decorative; they show how the same underlying methods adapt to very different physical contexts.
The ninth and final chapter addresses implementation and practical considerations. It covers the software tools and libraries available for spectral analysis, common pitfalls and how to avoid them, optimization strategies for large-scale or real-time analysis using methods like the overlap-add method and overlap-save method, and approaches for validating and debugging spectral results. The chapter also addresses normalization conventions, which are a frequent source of confusion when comparing results across different software environments.
Throughout the book, the emphasis is on understanding over memorization. Formulas are presented when they clarify rather than obscure, and they are always accompanied by an explanation of what each term means physically. Examples are drawn from real engineering and scientific contexts. Where trade-offs exist, they are stated explicitly rather than glossed over. The aim is to leave you not just with a set of techniques, but with a way of thinking about signals and frequency that you can apply to problems this book never anticipated.
The most useful thing spectral analysis can teach you is not any single algorithm, but the habit of asking: what frequencies are present, how strong are they, and how does that answer change my understanding of the system that produced this signal?
That question, asked consistently and answered carefully, is what separates effective signal analysis from mechanical computation. The chapters ahead are designed to make you comfortable asking it — and confident in the tools you use to answer it.
This is the end of the free sample. The full book has 9 chapters.
Want this book written for you?
Tell us your goals and background, and get your own version of this book, tailored by AI to you.


Benefits of AI-tailored books
- Read one book, not ten:
- all the Signal Processing knowledge you need, gathered into a single book.
- Save days of learning:
- tell us your goals, choose your topics, and the whole book is built around them.
- Learn effortlessly:
- Signal Processing book written for your specific background and expertise.
- Understand at a glance:
- includes charts, tables, timelines, checklists, decision trees, and more.
- Stay current:
- written the day you order it, not years ago.
- Trust what you read:
- every book is checked for accuracy, with real research when your subject needs it.
Create your unique book in 3 steps
- 1. Select your focus
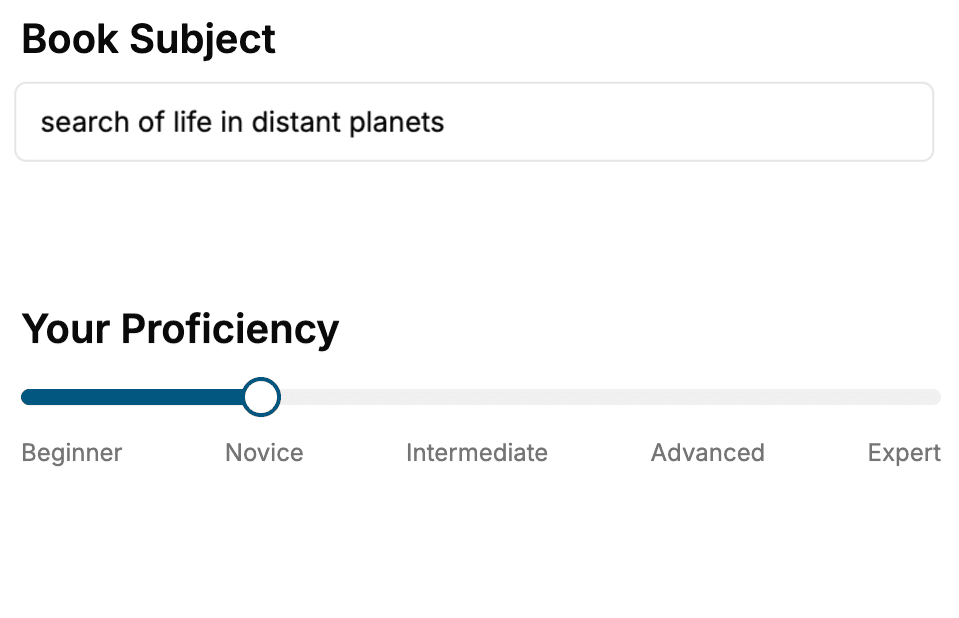
Select the focus of your Signal Processing book and share your background
- 2. Personalize your book
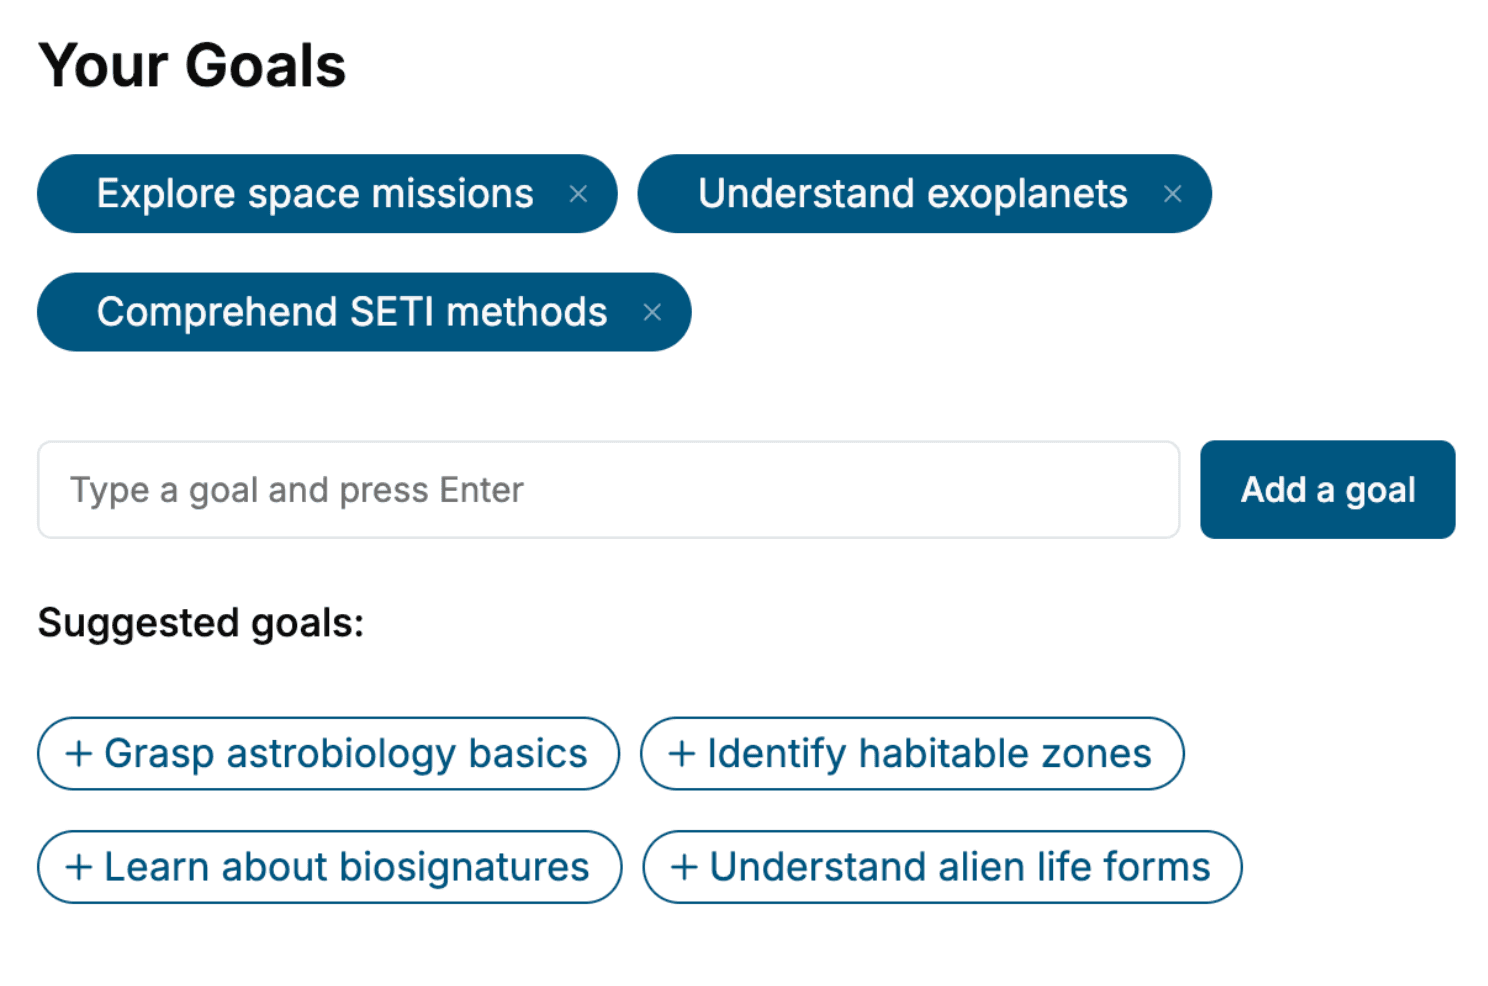
Specify your goals and choose sub-topics to include
- 3. Get your tailored book
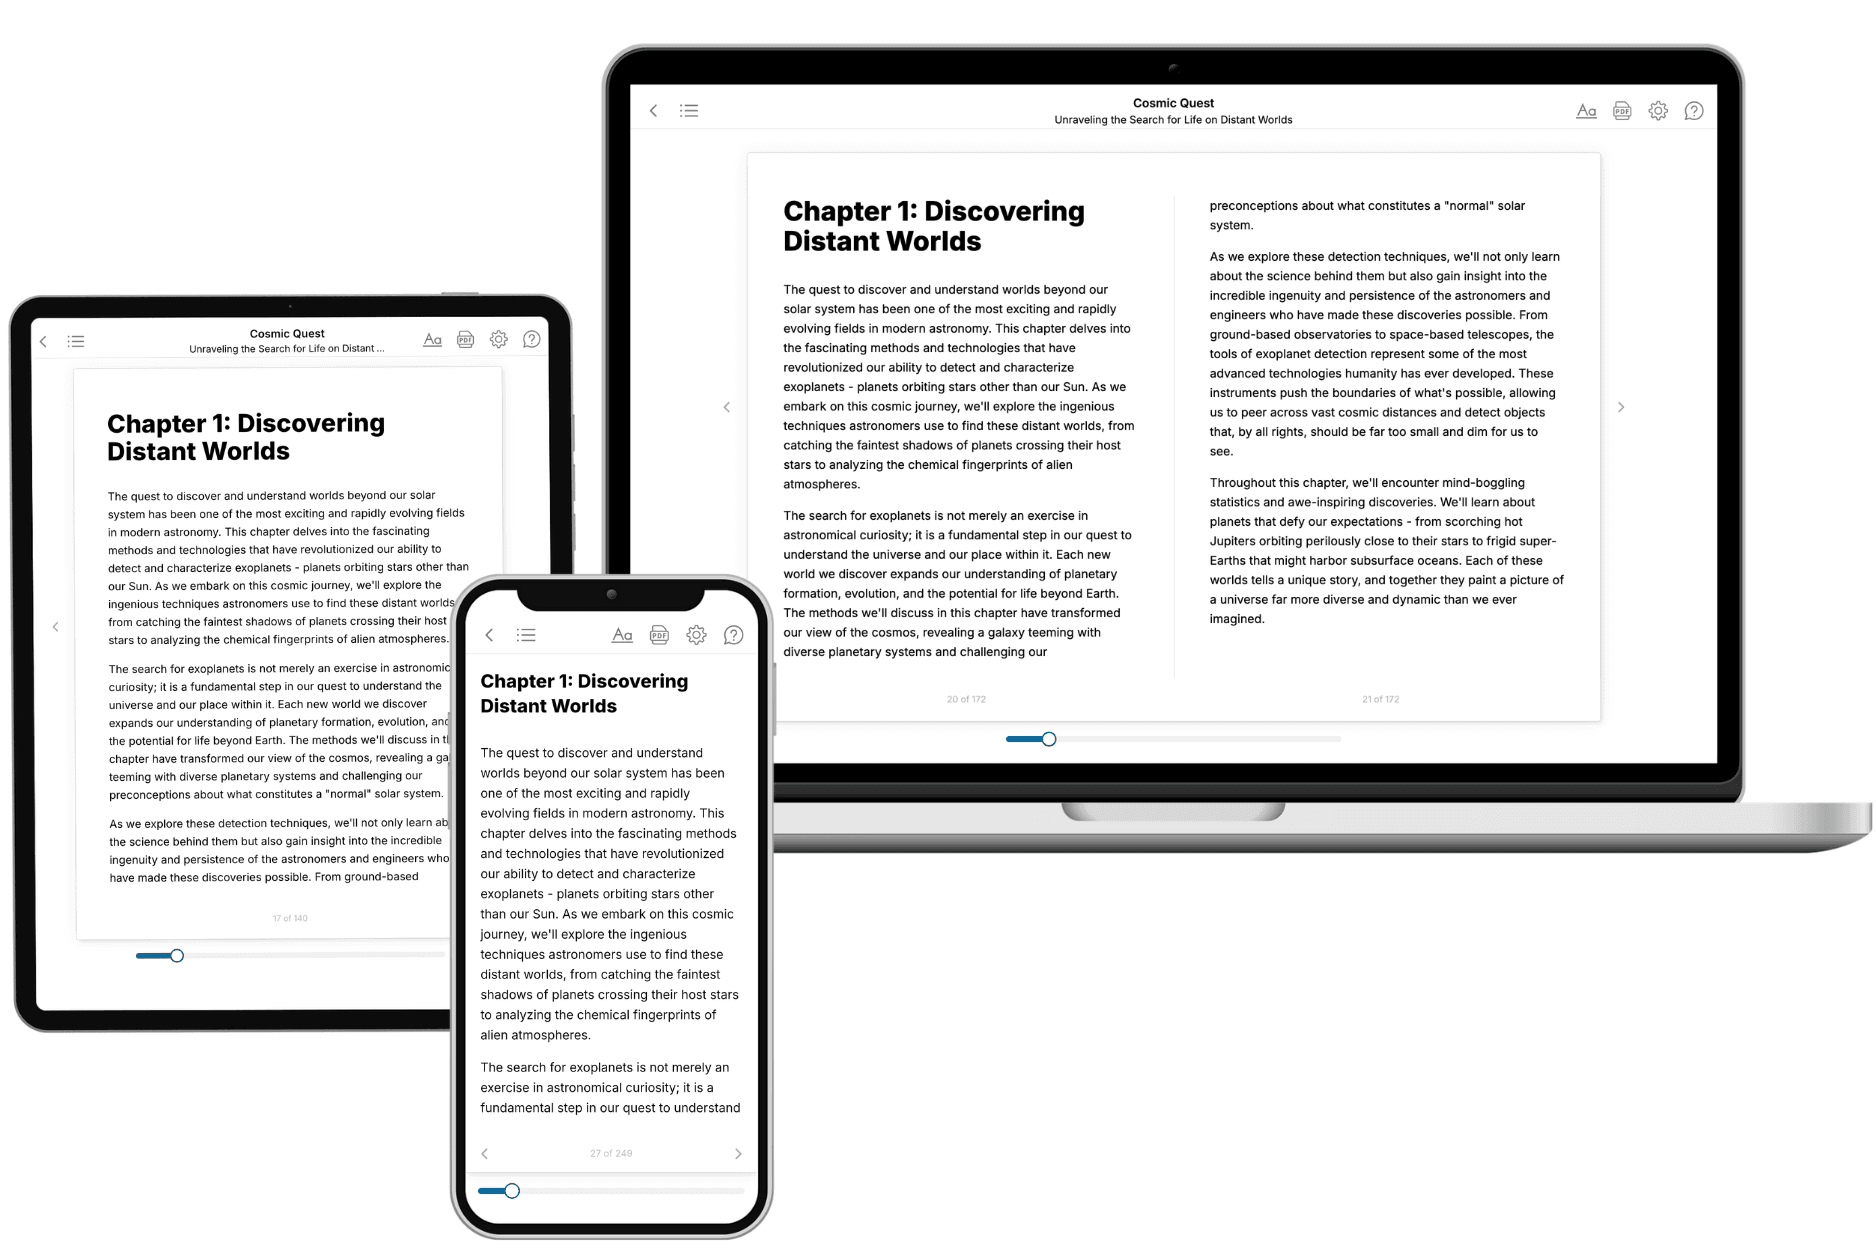
Your book is ready in 10 minutes. Read it online, download as EPUB or PDF, or send to Kindle.
Frequently asked questions
- What is TailoredRead?
TailoredRead creates complete, full-length nonfiction ebooks, written specifically for you. Tell us what you want to learn and why, and TailoredRead writes you a complete ebook on it, with charts, tables, and diagrams throughout. Read it online, on Kindle, or on any e-reader, or download it as a PDF or EPUB. Every book is written fresh the day you order it.
- How is the book tailored to me?
Before anything is written, you answer a few short questions about your goals, your background, and the topics you care about. Your book is then planned around your answers: written at your level, focused on your goals, and covering the topics you chose, instead of the one-size-fits-all book a store sells everyone.
- Will it read like generic AI content?
No. Your book isn't a chat transcript: it's planned chapter by chapter before a single word is written, told in a clear book voice, and explains ideas visually with charts, tables, and diagrams. After writing, every book goes through an editorial pass that polishes chapters so the book reads consistent from start to finish. Judge for yourself: browse thousands of sample books on our Explore Books page.
- How accurate is the content?
Our AI first checks whether your subject needs live research. Niche and fast-moving subjects are researched before writing, and the book plan and chapters are grounded in what it finds. After writing, every book goes through a quality pass that checks its facts and consistency, and researched books list their sources in a Notes section at the back.
- How long is the book?
You choose the length: Comprehensive (250-300 pages), Detailed (150-200 pages), Essential (70-100 pages), or Short (30-50 pages).
- Does the book include visuals?
Yes. Every book includes charts, tables, and diagrams: timelines, checklists, step-by-step guides, decision trees, comparison tables, matrices, and bar charts. A typical book includes dozens of these visual elements.
- Can I read it on Kindle? What formats can I download?
Yes. Every book can be read in our online reader or downloaded as a PDF or EPUB. The EPUB can be opened with Kindle, Apple Books, Kobo, and any e-reader. The Commercial and Author licenses also include an editable Word (DOCX) and Markdown download.
- How much does it cost?
About the price of a regular ebook. The exact price depends on your book's length and complexity, from $2 for the shortest books to $35 for the most comprehensive, and it's shown when you review your book, before you commit to anything. Each book is a one-time purchase, yours to keep, no subscription. Licenses that let you share, teach, or publish your book range from $35.99 to $49.99.
- Can I preview the book before purchasing?
Before you pay, you'll see what your book will cover: the title, a detailed description, the estimated length, and the complete chapter-by-chapter table of contents, so you know what you're getting before you decide. The full text itself is written after you purchase.
- How long does it take to create a book?
About 10 minutes. You can start reading the opening chapters while the rest is still being written.