Statistical Inference Essentials
Master the Art of Drawing Reliable Conclusions from Data
Imagine confidently presenting data-driven insights to stakeholders, knowing your conclusions are statistically sound and defensible.
222 pages10 chaptersDec 29, 2025Statistics
About this book
Statistical inference is the bridge between raw data and reliable conclusions—and mastering it transforms how you approach decision-making. This book cuts through the complexity to reveal the essential principles of statistical inference in clear, practical terms. You'll move beyond memorizing formulas to truly understanding how to draw conclusions from samples, evaluate competing hypotheses, and quantify uncertainty. Whether you're analyzing business metrics, conducting research, or evaluating claims, you'll learn the frameworks that separate rigorous analysis from statistical missteps. Each chapter builds systematically from foundational concepts to advanced applications, with real-world examples that demonstrate why these methods matter. You'll discover how probability distributions underpin inference, why hypothesis testing requires careful interpretation, and how to choose between frequentist and Bayesian approaches. By the end, you'll possess both the conceptual depth and practical skills to conduct inference with confidence and clarity.
Table of contents
- IntroductionWhy Statistical Inference Matters in Today's Data-Driven World, What You'll Learn and How to Use This Book, The Landscape of Statistical Inference: From Theory to PracticeRead below
- Chapter 1: Foundations of ProbabilityUnderstanding Probability: Rules and Interpretations, Random Variables and Their Distributions, How Probability Enables Statistical Inference
- Chapter 2: Probability Distributions and SamplingCommon Probability Distributions and Their Applications, Sampling Distributions: The Key to Inference, The Central Limit Theorem and Its Implications
- Chapter 3: Point Estimation and EstimatorsConstructing and Evaluating Point Estimators, Bias, Variance, and Consistency in Estimators, Maximum Likelihood Estimation: A Powerful Framework
- Chapter 4: Confidence Intervals and Interval EstimationUnderstanding Confidence Intervals: Interpretation and Construction, Confidence Intervals for Means and Proportions, Comparing Groups: Intervals for Differences and Ratios
- Chapter 5: Hypothesis Testing FundamentalsThe Logic of Hypothesis Testing and Test Structure, Type I and Type II Errors, Power, and Sample Size, P-Values: What They Mean and What They Don't
- Chapter 6: Hypothesis Tests in PracticeTests for Means: One-Sample, Two-Sample, and Paired, Tests for Proportions and Categorical Data, Nonparametric Tests When Assumptions Don't Hold
- Chapter 7: Regression Analysis and InferenceLinear Regression: Model Specification and Estimation, Inference in Regression: Testing Coefficients and Predictions, Checking Assumptions and Diagnosing Regression Problems
- Chapter 8: Bayesian Inference and MethodsBayesian Thinking: Prior, Likelihood, and Posterior, Comparing Bayesian and Frequentist Approaches, Practical Bayesian Inference and Decision-Making
- Chapter 9: Avoiding Common Pitfalls and MisinterpretationsStatistical Significance Versus Practical Significance, Multiple Testing, P-Hacking, and Reproducibility, The Limits of Inference: Causation and Confounding
- Chapter 10: Real-World Applications and Case StudiesInference in Business Analytics and A/B Testing, Inference in Scientific Research and Experimental Design, Inference from Surveys and Observational Studies
- ConclusionSynthesizing Your Knowledge: From Theory to Practice, Next Steps in Your Statistical Journey
- Glossary of Key Terms
- Further Reading and Resources
Introduction
Every day, decisions that shape businesses, policies, and scientific understanding rest on a single question: what can we reliably conclude from the data we have? A pharmaceutical company must decide whether a new drug truly works based on trials involving hundreds of patients, not millions. A marketing team needs to determine if a website redesign actually increases conversions after testing it for just two weeks. A researcher wants to know if an observed pattern reflects a genuine phenomenon or merely random chance. These scenarios share a common challenge—drawing trustworthy conclusions about large populations or general truths from limited samples.
Statistical inference provides the mathematical and logical framework for making these leaps from the known to the unknown. It transforms raw data into actionable insights while quantifying the uncertainty inherent in that process. Without inference, you're left guessing whether your observations represent signal or noise, whether differences you observe are meaningful or coincidental, and whether your conclusions will hold up under scrutiny. With it, you gain the tools to make defensible claims, communicate uncertainty honestly, and distinguish between what your data actually supports and what it doesn't.
This book is designed for those who already understand basic statistical concepts—measures of center and spread, probability fundamentals, and perhaps some exposure to hypothesis testing—but want to develop a deeper, more practical command of inference. You'll move beyond memorizing formulas to understanding the logic that makes inference work, the assumptions that make it valid, and the pitfalls that make it fail. By the end, you'll possess both the conceptual clarity and practical skills to conduct rigorous statistical inference in your own work, whether that's business analytics, academic research, policy evaluation, or any field where data drives decisions.
The journey ahead is structured to build systematically from foundations to applications. You'll start by solidifying your understanding of probability and distributions—the mathematical bedrock of all inference. From there, you'll explore estimation methods that let you approximate unknown population parameters, confidence intervals that quantify uncertainty around those estimates, and hypothesis testing frameworks that evaluate competing claims. You'll then examine regression analysis for modeling relationships, Bayesian methods that incorporate prior knowledge, and practical considerations that separate sound inference from statistical malpractice. Throughout, real-world examples and actionable guidance will anchor abstract concepts in concrete applications.
Why Statistical Inference Matters in Today's Data-Driven World
The explosion of available data has paradoxically made statistical inference more important, not less. Organizations collect vast amounts of information—customer behavior, sensor readings, transaction records, survey responses—but data volume alone doesn't guarantee insight. In fact, larger datasets can amplify the risk of finding spurious patterns that appear significant but lack real meaning. Statistical inference provides the discipline needed to separate genuine discoveries from statistical artifacts, ensuring that conclusions are both rigorous and reproducible.
Consider the challenge facing an e-commerce company testing a new checkout process. They implement the change and observe that conversion rates increase from 3.2% to 3.5% over the following week. Is this improvement real, or could it simply reflect normal week-to-week variation? Should they roll out the change to all customers, or continue testing? Without inference, they're forced to rely on intuition or arbitrary rules of thumb. With inference, they can calculate the probability that such a difference would occur by chance alone, construct a confidence interval around the true effect size, and make a decision based on quantified uncertainty rather than guesswork.
The stakes extend far beyond business contexts. Medical researchers use inference to determine whether new treatments are safe and effective, often making life-or-death recommendations based on trials involving hundreds rather than millions of patients. Environmental scientists employ inference to detect climate trends and pollution effects from limited monitoring data. Social scientists rely on inference to understand human behavior from surveys that sample tiny fractions of populations. In each case, the quality of inference directly determines the quality of decisions that follow.
Modern data science has introduced new complexities that make solid inference skills even more critical. Machine learning models can identify patterns with impressive accuracy, but understanding whether those patterns generalize to new data requires inference. A/B testing platforms make it easy to run experiments, but interpreting results correctly demands understanding of multiple testing problems, statistical power, and practical significance. The democratization of data analysis tools means more people are conducting statistical tests than ever before—but without proper training, they risk drawing incorrect conclusions that appear scientifically justified.
Perhaps most importantly, inference provides a common language for communicating uncertainty. When you report that a confidence interval for average customer satisfaction ranges from 7.2 to 7.8 on a ten-point scale, you're conveying both your best estimate and the precision of that estimate. When you state that a p-value is 0.03, you're quantifying how surprising your data would be if a particular hypothesis were true. This shared vocabulary allows stakeholders with different backgrounds to evaluate evidence consistently and make informed decisions about risk and uncertainty.
The consequences of poor inference are tangible and often costly. Companies waste resources scaling interventions that don't actually work because they misinterpreted initial results. Researchers publish findings that fail to replicate because they didn't account for multiple testing or selection bias. Policy makers implement programs based on flawed analyses that showed statistical significance without practical importance. These failures don't stem from lack of data or computational power—they result from misunderstanding or misapplying the principles of statistical inference.
Mastering inference also develops critical thinking skills that extend beyond statistics. The discipline of clearly stating assumptions, considering alternative explanations, and quantifying uncertainty applies to any analytical endeavor. When you learn to ask whether an observed effect could plausibly be due to chance, you're cultivating skepticism that guards against overconfidence. When you practice distinguishing between correlation and causation, you're building reasoning skills that improve decision-making across domains. Statistical inference is ultimately about thinking clearly under uncertainty—a capability that grows more valuable as the world becomes more complex and data-rich.
What You'll Learn and How to Use This Book
This book is organized to build your inference capabilities systematically, starting with essential foundations and progressing to sophisticated applications. Each chapter introduces concepts with clear explanations, demonstrates them with concrete examples, and provides actionable guidance for implementation. You'll encounter both the mathematical logic that makes inference valid and the practical considerations that make it useful. The goal isn't just to teach you how to perform statistical tests, but to develop your judgment about when and how to apply different inference methods appropriately.
The early chapters establish the probabilistic foundation that all inference rests upon. You'll explore how probability distributions describe uncertainty, how random variables model data-generating processes, and how sampling distributions connect sample statistics to population parameters. These concepts might seem abstract initially, but they're essential for understanding why inference methods work and when they fail. You'll see how the Central Limit Theorem—one of statistics' most powerful results—enables inference even when data don't follow normal distributions, and why understanding sampling variability is crucial for interpreting any statistical result.
From this foundation, you'll move into estimation methods that let you approximate unknown population characteristics from sample data. You'll learn to construct and evaluate point estimators, understanding the trade-offs between bias and variance that determine estimator quality. The chapter on confidence intervals will show you how to quantify uncertainty around estimates, providing ranges of plausible values rather than single numbers. You'll discover why a 95% confidence interval doesn't mean there's a 95% probability the true parameter falls within it—a common misinterpretation—and what it actually does mean.
The hypothesis testing chapters form the book's core, covering both the logical framework and practical implementation of tests. You'll learn the structure of hypothesis tests, including null and alternative hypotheses, test statistics, and decision rules. Critically, you'll understand Type I and Type II errors, statistical power, and how sample size affects your ability to detect real effects. The discussion of p-values will clarify what they measure and, equally important, what they don't—addressing widespread misinterpretations that plague scientific literature and business analytics alike.
Practical chapters demonstrate how to apply these concepts to common scenarios:
- Comparing means: One-sample, two-sample, and paired t-tests for evaluating differences between groups
- Analyzing proportions: Tests for categorical data, including chi-square tests and proportion comparisons
- Regression analysis: Modeling relationships between variables and making predictions with quantified uncertainty
- Nonparametric methods: Alternative approaches when standard assumptions about data distributions don't hold
The chapter on Bayesian inference introduces an alternative framework that incorporates prior knowledge and beliefs into analysis. You'll see how Bayesian methods differ from the frequentist approaches covered earlier, when each framework is most appropriate, and how Bayesian thinking can provide more intuitive answers to certain questions. This isn't about choosing sides in a philosophical debate—it's about expanding your toolkit and understanding the strengths and limitations of different approaches.
Later chapters address critical practical considerations often overlooked in traditional statistics courses. You'll learn to distinguish statistical significance from practical significance—recognizing that a result can be statistically significant yet too small to matter in practice. The discussion of multiple testing and p-hacking will help you avoid common pitfalls that inflate false discovery rates. You'll explore the limits of inference, particularly regarding causal claims, understanding when observational data can and cannot support causal conclusions.
The final chapter presents real-world case studies across business analytics, scientific research, and survey sampling. These examples demonstrate how inference principles apply in messy, realistic contexts where assumptions are imperfect, data have limitations, and decisions must be made despite uncertainty. You'll see how practitioners navigate trade-offs, communicate results to non-technical stakeholders, and make defensible decisions based on statistical evidence.
To get the most from this book, approach it actively rather than passively. When you encounter an example, pause to consider how you might analyze it before reading the solution. When a concept seems clear, test your understanding by explaining it in your own words or applying it to a different scenario. The book includes numerous concrete examples, but you'll deepen your learning by connecting these to situations from your own work or studies. Consider keeping a notebook where you work through examples, note questions that arise, and record insights that emerge.
You don't need to read chapters in strict sequence, though the early chapters provide foundations that later ones build upon. If you're already comfortable with probability and distributions, you might skim Chapters 1-2 and focus on estimation and testing. If you're primarily interested in regression, you could jump to Chapter 7 after covering confidence intervals and hypothesis testing basics. The book is designed to support both cover-to-cover reading and selective consultation as a reference. Cross-references throughout will guide you to related concepts when needed.
The Landscape of Statistical Inference: From Theory to Practice
Statistical inference encompasses a diverse collection of methods unified by a common purpose: using sample data to draw conclusions about populations or processes. Understanding the landscape of inference—how different methods relate to each other and when each is appropriate—helps you navigate the field strategically rather than treating each technique as an isolated procedure. This broader perspective reveals that inference isn't a collection of disconnected recipes, but rather a coherent framework built on consistent logical principles.
At the highest level, inference divides into two main paradigms: frequentist and Bayesian. Frequentist inference, which dominates most statistics education and practice, treats probability as long-run frequency. When a frequentist constructs a 95% confidence interval, they mean that if you repeated the sampling and interval construction process infinitely many times, 95% of the resulting intervals would contain the true parameter. Hypothesis tests in the frequentist framework evaluate how surprising your data would be if a null hypothesis were true, without incorporating prior beliefs about parameter values.
Bayesian inference takes a fundamentally different approach, treating probability as a measure of belief or certainty rather than long-run frequency. Bayesian methods explicitly incorporate prior knowledge or beliefs about parameters, then update these beliefs based on observed data to produce posterior distributions. This framework often provides more intuitive answers to questions like "What's the probability this treatment is effective?" that frequentist methods can't directly address. The choice between paradigms isn't about one being right and the other wrong—each has strengths and weaknesses that make it more suitable for different contexts.
Within the frequentist framework, inference methods generally fall into three categories: point estimation, interval estimation, and hypothesis testing. Point estimation provides single-number approximations of unknown parameters—for example, using a sample mean to estimate a population mean. These estimates are useful but incomplete because they don't convey uncertainty. Interval estimation addresses this limitation by providing ranges of plausible values, typically through confidence intervals. Hypothesis testing takes a different approach, evaluating whether data provide sufficient evidence to reject specific claims about parameters.
These three approaches are complementary rather than competing. Consider a study comparing average recovery times for two medical treatments. Point estimation might reveal that Treatment A patients recover in an average of 12.3 days versus 14.7 days for Treatment B—a difference of 2.4 days. A confidence interval might indicate this difference plausibly ranges from 0.8 to 4.0 days. A hypothesis test might reject the null hypothesis of no difference with p = 0.004. Each piece of information contributes to a complete picture: the estimated effect size, the precision of that estimate, and the strength of evidence against no effect.
The choice of inference method depends on your research question and decision context. Hypothesis testing is appropriate when you need to make binary decisions—approve or reject a drug, implement or abandon a policy, publish or withhold a finding. Confidence intervals are preferable when you need to understand effect magnitude and precision, not just whether an effect exists. Point estimates are useful for prediction and decision-making when you need single-number inputs. Sophisticated analyses often combine multiple approaches, using hypothesis tests to screen for effects, confidence intervals to quantify them, and point estimates to make predictions.
Another important distinction separates parametric from nonparametric methods. Parametric inference assumes data follow specific probability distributions characterized by parameters—for example, assuming data are normally distributed with unknown mean and variance. These assumptions enable powerful inference but can produce misleading results when violated. Nonparametric methods make fewer distributional assumptions, instead relying on properties like ranks or signs. They're more robust but often less powerful when parametric assumptions actually hold. Understanding this trade-off helps you choose appropriate methods for your data characteristics.
The complexity of inference methods ranges from simple one-sample tests to sophisticated multivariate models. Simple methods like one-sample t-tests compare a sample mean to a hypothesized value, requiring minimal assumptions and straightforward interpretation. Two-sample tests compare groups, introducing considerations about independence and variance equality. Regression analysis models relationships between variables, enabling prediction and control for confounding factors. Multilevel models account for hierarchical data structures. Each increase in complexity brings additional power and flexibility but also more assumptions to verify and more ways for analysis to go wrong.
Modern computational tools have dramatically expanded the practical scope of inference. Techniques like bootstrapping use computer simulation to approximate sampling distributions without mathematical derivations, making inference possible in situations where traditional methods fail. Bayesian methods, once limited by computational constraints, are now practical for complex models thanks to Markov Chain Monte Carlo algorithms. Permutation tests provide exact p-values without distributional assumptions. These computational approaches don't replace traditional methods but complement them, offering alternatives when assumptions are questionable or mathematical solutions are intractable.
Understanding the inference landscape also means recognizing what inference cannot do. Statistical methods can quantify uncertainty and evaluate evidence, but they cannot make decisions for you—that requires incorporating values, costs, and context that statistics alone cannot capture. Inference can identify associations but rarely proves causation without careful experimental design. It can detect patterns in your sample but cannot guarantee those patterns generalize to different populations or time periods. Recognizing these limitations is as important as understanding inference capabilities, preventing overconfidence and inappropriate applications.
The practical application of inference requires balancing competing considerations. More complex methods can model reality more accurately but are harder to interpret and more prone to overfitting. Larger samples provide more precise estimates but cost more to collect. Stricter significance thresholds reduce false positives but increase false negatives. Lower confidence levels produce narrower intervals but less certainty. There's rarely a single "correct" approach—instead, you must make informed trade-offs based on your specific context, resources, and goals. This book will help you develop the judgment needed to navigate these trade-offs effectively.
As you progress through the chapters ahead, keep this landscape in mind. When you learn about confidence intervals, remember they're one of three main inference approaches, each with distinct purposes. When you study t-tests, recognize they're parametric methods with nonparametric alternatives. When you encounter Bayesian methods, understand they represent a different philosophical framework, not just different formulas. This broader perspective will help you see connections between topics, choose appropriate methods for your problems, and communicate your analytical choices clearly to others. Statistical inference is a rich, interconnected field—and understanding its structure makes you a more capable and confident practitioner.
This is the end of the free sample. The full book has 10 chapters.
Want this book written for you?
Tell us your goals and background, and get your own version of this book, tailored by AI to you.


Benefits of AI-tailored books
- Read one book, not ten:
- all the Statistics knowledge you need, gathered into a single book.
- Save days of learning:
- tell us your goals, choose your topics, and the whole book is built around them.
- Learn effortlessly:
- Statistics book written for your specific background and expertise.
- Understand at a glance:
- includes charts, tables, timelines, checklists, decision trees, and more.
- Stay current:
- written the day you order it, not years ago.
- Trust what you read:
- every book is checked for accuracy, with real research when your subject needs it.
Create your unique book in 3 steps
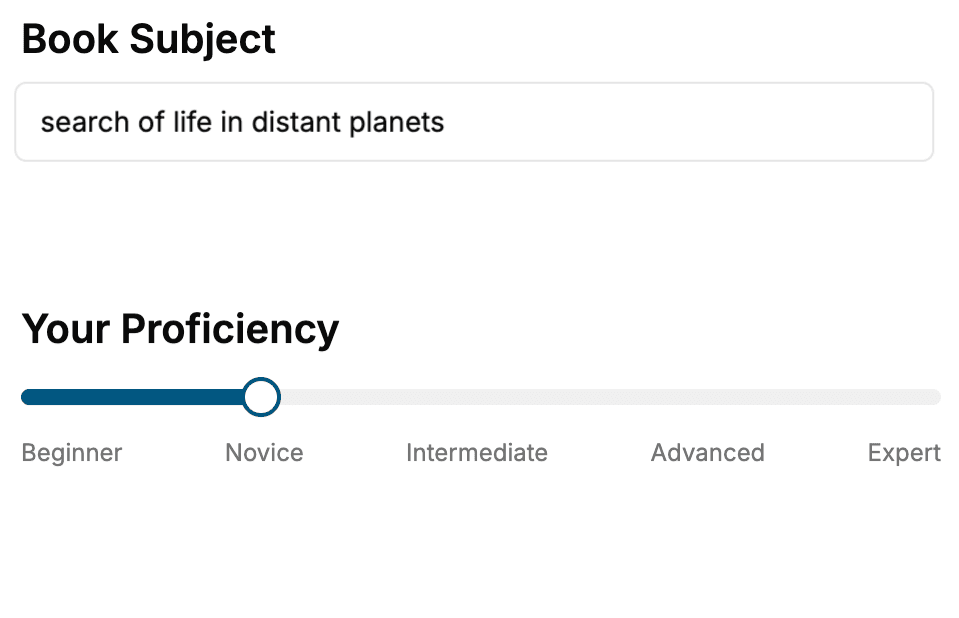
- 1. Select your focus
Select the focus of your Statistics book and share your background
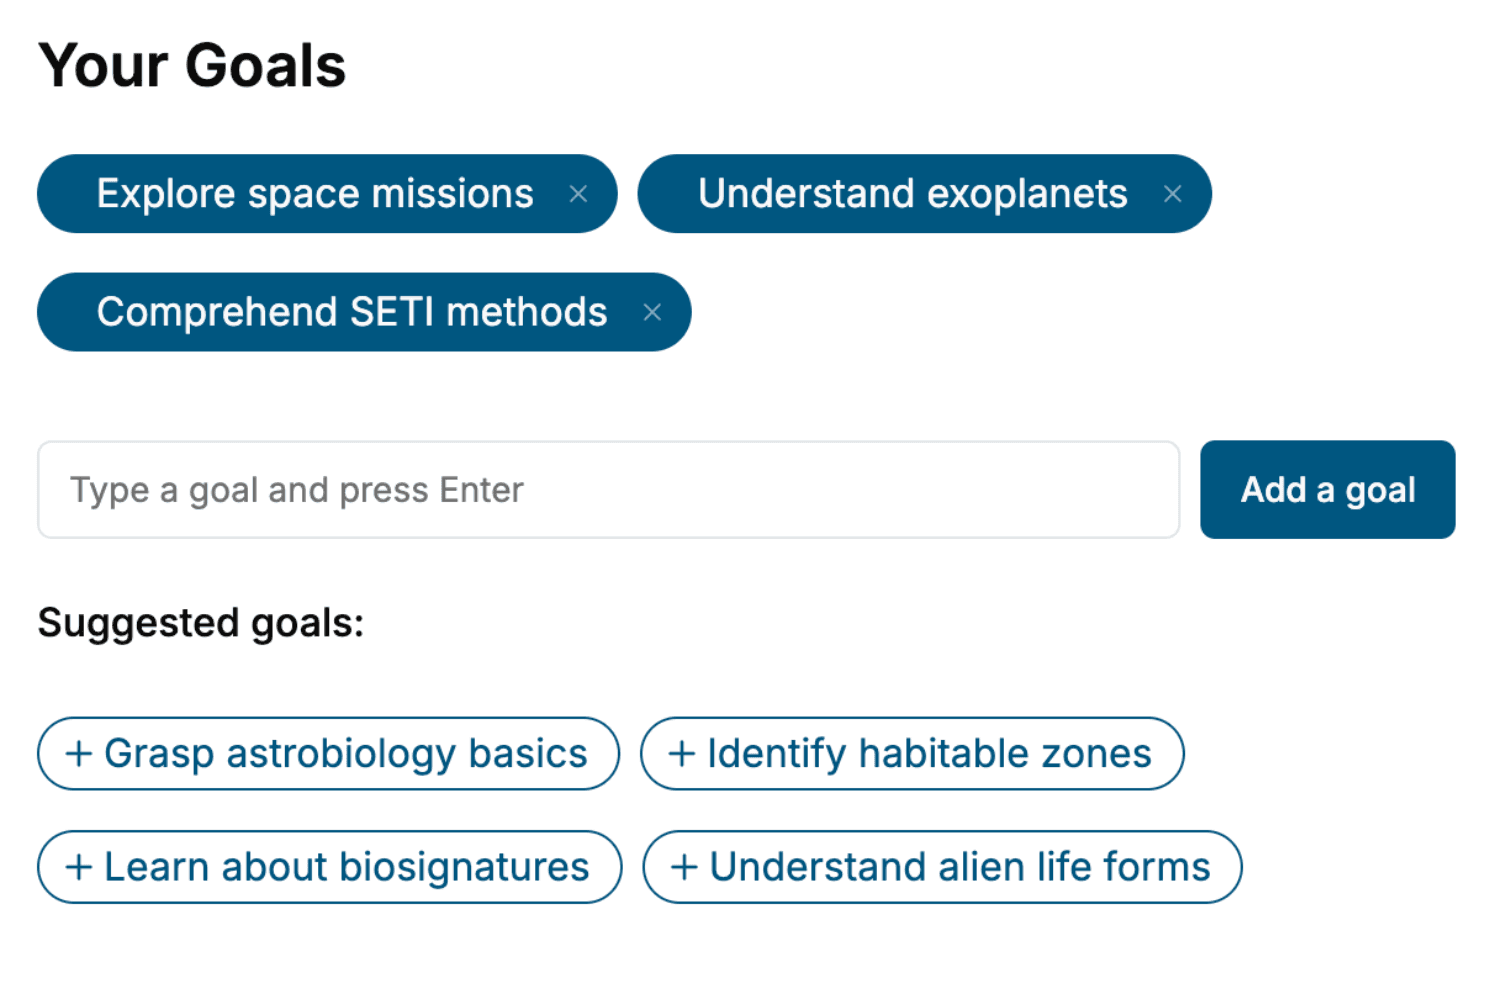
- 2. Personalize your book
Specify your goals and choose sub-topics to include
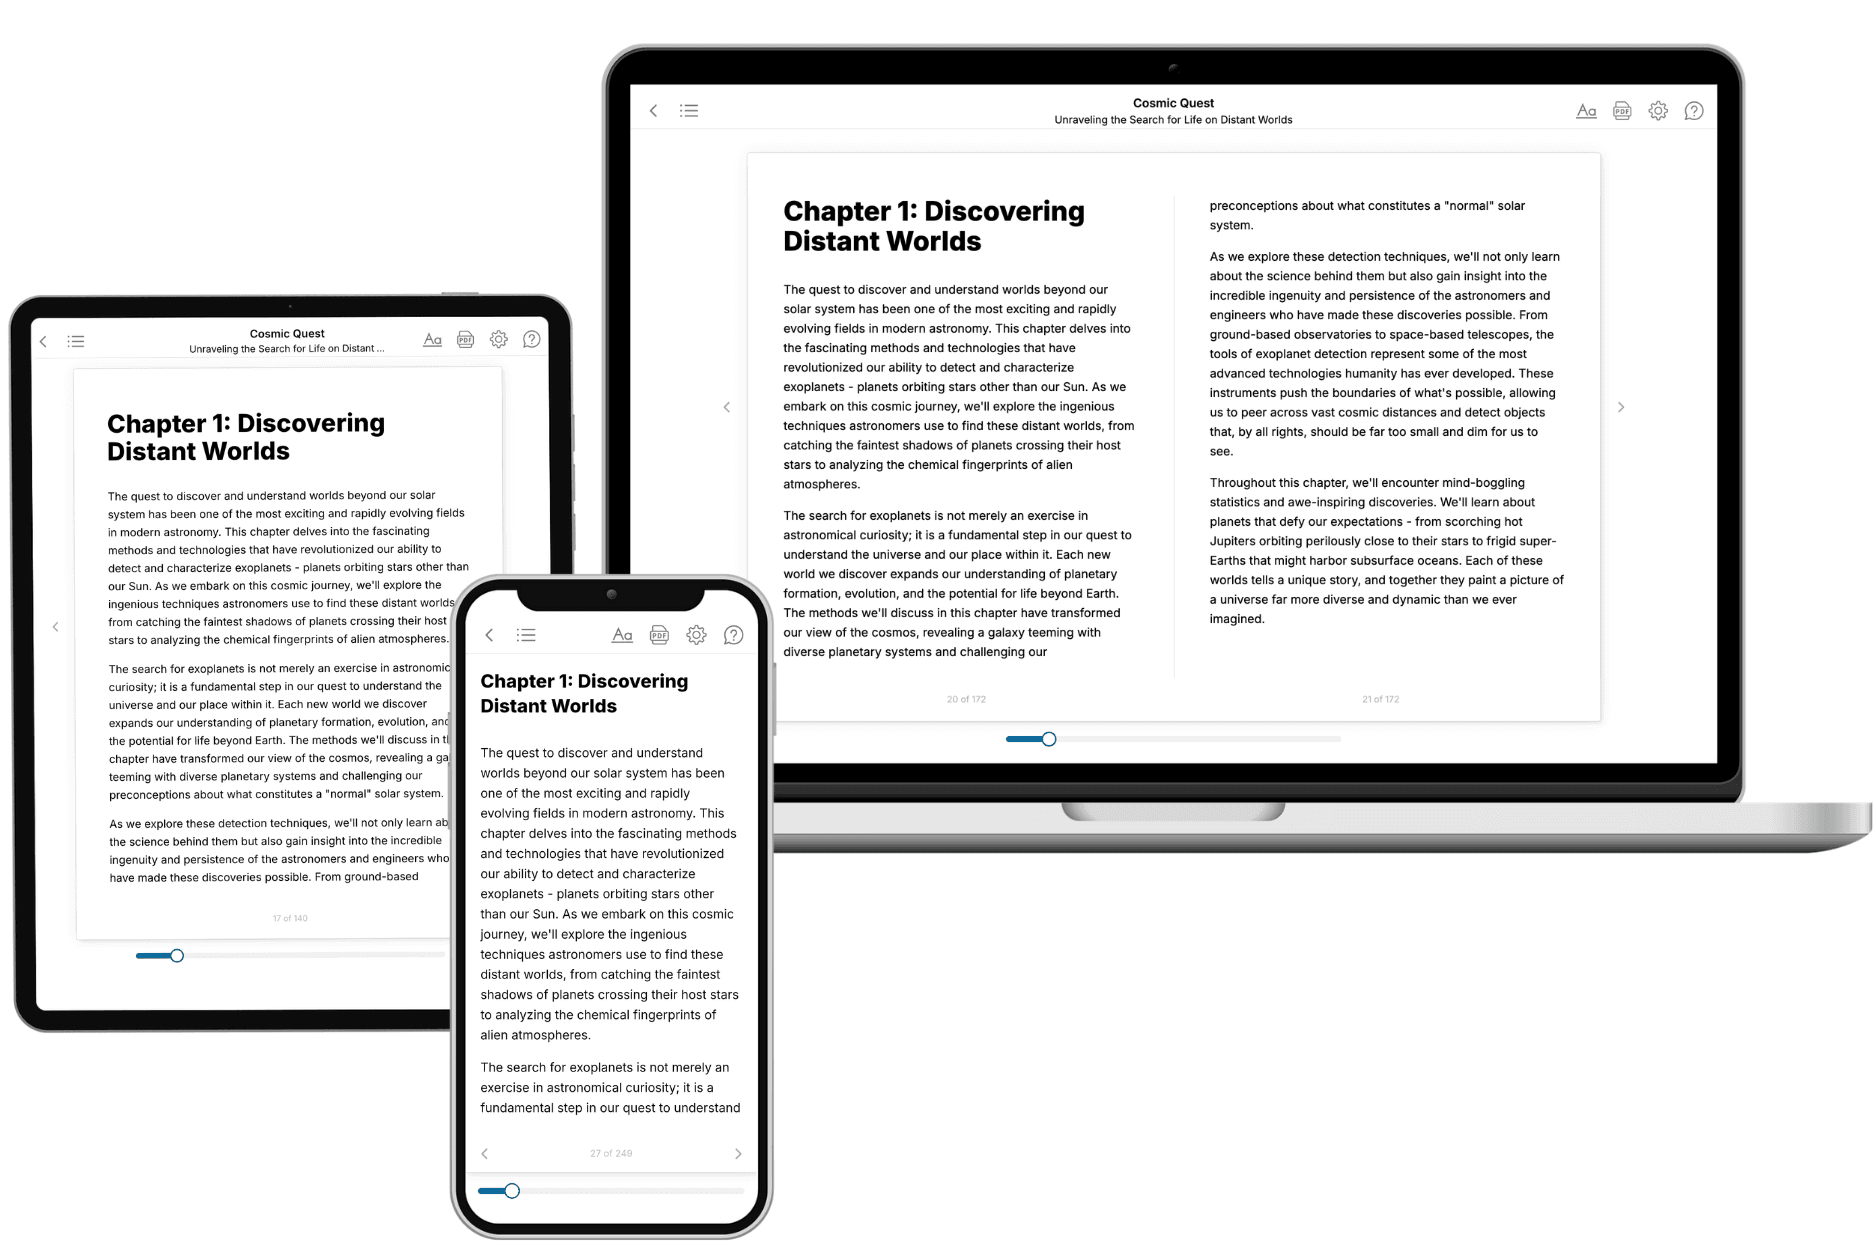
- 3. Get your tailored book
Your book is ready in 10 minutes. Read it online, download as EPUB or PDF, or send to Kindle.
Frequently asked questions
- What is TailoredRead?
TailoredRead creates complete, full-length nonfiction ebooks, written specifically for you. Tell us what you want to learn and why, and TailoredRead writes you a complete ebook on it, with charts, tables, and diagrams throughout. Read it online, on Kindle, or on any e-reader, or download it as a PDF or EPUB. Every book is written fresh the day you order it.
- How is the book tailored to me?
Before anything is written, you answer a few short questions about your goals, your background, and the topics you care about. Your book is then planned around your answers: written at your level, focused on your goals, and covering the topics you chose, instead of the one-size-fits-all book a store sells everyone.
- Will it read like generic AI content?
No. Your book isn't a chat transcript: it's planned chapter by chapter before a single word is written, told in a clear book voice, and explains ideas visually with charts, tables, and diagrams. After writing, every book goes through an editorial pass that polishes chapters so the book reads consistent from start to finish. Judge for yourself: browse thousands of sample books on our Explore Books page.
- How accurate is the content?
Our AI first checks whether your subject needs live research. Niche and fast-moving subjects are researched before writing, and the book plan and chapters are grounded in what it finds. After writing, every book goes through a quality pass that checks its facts and consistency, and researched books list their sources in a Notes section at the back.
- How long is the book?
You choose the length: Comprehensive (250-300 pages), Detailed (150-200 pages), Essential (70-100 pages), or Short (30-50 pages).
- Does the book include visuals?
Yes. Every book includes charts, tables, and diagrams: timelines, checklists, step-by-step guides, decision trees, comparison tables, matrices, and bar charts. A typical book includes dozens of these visual elements.
- Can I read it on Kindle? What formats can I download?
Yes. Every book can be read in our online reader or downloaded as a PDF or EPUB. The EPUB can be opened with Kindle, Apple Books, Kobo, and any e-reader. The Commercial and Author licenses also include an editable Word (DOCX) and Markdown download.
- How much does it cost?
About the price of a regular ebook. The exact price depends on your book's length and complexity, from $2 for the shortest books to $35 for the most comprehensive, and it's shown when you review your book, before you commit to anything. Each book is a one-time purchase, yours to keep, no subscription. Licenses that let you share, teach, or publish your book range from $35.99 to $49.99.
- Can I preview the book before purchasing?
Before you pay, you'll see what your book will cover: the title, a detailed description, the estimated length, and the complete chapter-by-chapter table of contents, so you know what you're getting before you decide. The full text itself is written after you purchase.
- How long does it take to create a book?
About 10 minutes. You can start reading the opening chapters while the rest is still being written.